The validity coefficients typically encountered in validation studies are normally appallingly low. Validity coefficients typically fall below 0,50 and only very seldom reach values as high as 0,70 (Campbell, 1991; Guion, 1998). The validity ceiling first identified by Hull (1928) seemingly still persists. Numerous possibilities have been considered on how to affect an increase in the magnitude of the validity coefficient (Campbell, 1991; Ghiselli, Campbell & Zedeck; 1981, Guion, 1991; 1998; Wiggins, 1973). Most of these attempts revolved around modifications of and/or extensions to the regression strateg y (Gatewood & Feild, 1994). An interesting and provocative alternative to the usual substantive theory and operational design approaches (Twigge, Theron, Steele & Meiring, 2004) to the enhancement of the accuracy with which prediction models estimate criterion performance was proposed by Ghiselli (1956, 1960a, 1960b). Rather than expanding the basic prediction model by including additional job relevant predictors, Ghiselli has chosen to attack the problem of improved prediction directly by the use of empirical regression-based procedures (Ghiselli, 1956, 1960a, 1960b). The essence of the proposed procedure revolves around the development of a composite predictability index that explains variance in the prediction errors or residuals resulting from an existing prediction model. It would, however appear as if the procedure has found very little if any practical acceptance. The actuarial nature of the procedure could probably to a large extent account for it not being utilized in the practical development of selection procedures. The lack of general acceptance must, however, also be attributed in part to the fact that the predictability index originally proposed by Ghiselli (1956, 1960a, 1960b) failed to significantly explain unique variance2 in the criterion when added to a model already containing one or more predictors (Wiggins, 1973). The Ghiselli predictability index only serves the purpose of isolating a subset of individuals for whom the model provides relatively accurate criterion estimates. The selection problem, however, requires the assignment of each and every member of the total applicant sample (and not only subset of the applicant group) to either an accept or reject treatment (Cronbach & Gleser, 1965), based on their estimated criterion performance.
Twigge et al. (2004) found that it is possible to develop a predictability index, which correlates with the real residuals derived from the regression of a criterion on one or more predictors. The modified predictability index did significantly (p < 0,05) explain unique variance in the criterion when added to a model already containing one or more predictors. The addition of the modified predictability index to the original regression model therefore did produce a statistically significant (p < 0,05) increase in the correlation between the selection battery and the criterion. This increase moreover was found to affect a substantial and useful increase in the utility of the selection battery. Twigge et al. (2004) also corroborated Ghiselli’s (1956, 1960a, 1960b) earlier finding that it is possible to develop a predictability index, which correlates with the absolute residuals derived from the regression of a criterion on one or more predictors. The addition of such a predictability index to the original regression model, moreover, did not produce a statistically significant increase in the correlation between the selection battery and the criterion.
To be able to convincingly demonstrate the feasibility of enhancing selection utility through the use of predictability indices would, however, require the successful replication of the results obtained on a second, independent sample from the same population and the successful cross validation of the results obtained on a derivation sample to a holdout sample selected from the same population. Due to the limited size of their available sample, Twigge et al. (2004) were unable to investigate these rather crucial issues.
Successful replication and cross validation of the results obtained on a derivation sample would imply that the following specific requirements should ideally be met. The same test items that correlated significantly (p < 0,05) with the real residuals in the derivation sample should again be flagged for inclusion in the predictability index in the holdout sample. The predictability index, developed on the derivation sample should consequently still correlate significantly with the real residuals obtained from fitting a new basic regression model on a representative holdout sample taken from the same population. Furthermore, the addition of the predictability index, developed
CALLIE THERON
Department of Industrial PsychologyUniversity of Stellenbosch
DEON MEIRING
South African Police Ser vices, Pretoria
ABSTRACT
Twigge, Theron, Steele and Meiring (2004) concluded that it is possible to develop a predictability index based on a concept originally proposed by Ghiselli (1956, 1960a, 1960b), which correlates with the real residuals derived from the regression of a criterion on one or more predictors. The addition of such a predictability index to the original regression model was found to produce a statistically significant increase in the correlation between the selection battery and the criterion. To be able to convincingly demonstrate the feasibility of enhancing selection utility through the use of predictability indices would, however, require the cross validation of the results obtained on a derivation sample on a holdout sample selected from the same population. The objective of this article consequently is to investigate the extent to which such a predictability index, developed on a validation sample, would successfully cross validate to a holdout sample. Encouragingly positive results were obtained. Recommendations for future research are made.
Key words
Personnel selection, validation, predictability, index
A PSYCHOMETRIC INVESTIGATION INTO THE CROSS
VALIDATION OF AN ADAPTATION OF THE GHISELLI
PREDICTABILITY INDEX IN PERSONNEL SELECTION
1
48
on the derivation sample, to the holdout regression model should still significantly explain unique variance in the criterion measure that is not explained by the predictor(s) in the basic model. The first aspect is probably the Achilles heel of the proposed procedure. If the predictability index developed on the derivation sample would succeed in predicting the real prediction errors made by a newly fitted regression model on a second sample taken from the same population, then the second issue most likely will not present a problem. The expanded regression model developed on the derivation sample should finally also accurately predict the criterion when applied on the holdout sample data. This requirement probably forms the crux of the evidence that has to be lead to justify the eventual regular use of predictability indices in selection research.
The eventual regular use of predictability indices in selection research, however also hinges on an important further question, which Twigge et al. (2004) unfortunately failed to raise and investigate. The items included in a predictability index are typically harvested from one or more scales not included in the existing selection battery3. Twigge et al. (2004) for example used the individual items of the Organisational Personality Profile (OPP) Questionnaire (Psytech, 2003). Instead of donating a subset of items to a predictability index, these scales as such could, however, have been added to the existing selection model. The development of a predictability index would firstly make sense only if the incremental validity achieved by adding the predictability index to the regression model exceeds that achieved by adding the scales to the model from which the predictability index items were harvested. Unless all the items in the donor scales significantly correlate with the real unstandardized residuals (Y – E[Y|Xi]) derived from the fitted regression model, this probably should be the case. The eventual regular use of predictability indices in selection research would, however, make sense only if this advantage is maintained in cross validation. The limited number of specially selected items which allowed the predictability index to outperform the donor scale score in the derivation sample, could very well be its undoing in the holdout sample.
Predictability indices most likely are highly situation specific. Each prediction model would most likely require the development of a unique predictability index. The fact that Twigge et al. (2004) succeeded in developing a predictability index for their prediction model does not necessarily mean it would practically be possible to do so for another. But how common would the occurrence of successful predictability index development actually be?
The objective of this research is to further investigate the practical feasibility of using the modified predictability index to increase the accuracy of the criterion estimates obtained from an actuarially developed prediction model. If the Twigge et al. (2004) finding that the addition of the modified Ghiselli predictability index does significantly explain unique variance in the criterion when added to the original regression model can be corroborated, the study will in addition examine the replication of the index and the cross validation of the index and the expanded prediction model.
Research objective
More specifically, the objectives of the study are (a) to corroborate the Twigge et al. (2004) finding that it is possible to develop a predictability index, which correlates with the real residuals derived from the regression of a criterion on one or more predictors, (b) to corroborate the Twigge et al. (2004) finding that the predictability index significantly explains unique variance in the criterion when added to the original regression model, (c) to evaluate the incremental validity achieved by adding the predictability index to the regression model against that achieved by adding the scales to the model from which the predictability index items were harvested, (d) to determine whether the same test items that correlated
significantly (p<0,05) with the real residuals in the derivation sample would again step forward for inclusion in the predictability index in a holdout sample, (e) to determine whether the predictability index, developed on the derivation sample would still correlate significantly with the real residuals obtained from fitting a new basic regression model on a holdout sample, (f) to determine whether the addition of the predictability index, developed on the derivation sample, to the holdout regression model would significantly explain unique variance in the criterion measure that is not explained by the predictor(s) in the basic model, (g) to determine whether the expanded regression model developed on the derivation sample would successfully cross validate to a holdout sample, and (h) to determine whether the shrinkage associated with the regression model expanded with the predictability index differs from the shrinkage associated with the regression model expanded with the scales from which the predictability index items were harvested.
RESEARCH DESIGN
Research approach
Theoretical rationale underlying the modified Ghiselli predictability index
The decision whether to accept an applicant or not is based on the mechanically or judgementally derived expected criterion outcome conditional on information on the applicant or, if a minimally acceptable criterion outcome state can be defined, the conditional probability of success (or failure) given information on the applicant. The accuracy with which mechanical prediction models estimate criterion performance can be enhanced in a number of ways. Twigge et al. (2004) essentially distinguished two classes of approaches. The first category of approaches could be termed substantive theory approaches in as far as they originate from considering the manner in which variance in performance could be substantively explained in terms of theory. The second category of approaches could be termed operational design approaches in as far as they originate from reflecting on the degree of success with which the validation design measures the relevant latent variables and samples the relevant applicant population. The approach suggested by Ghiselli (1956, 1960a, 1960b) does not really fit cleanly in any of the two categories although it could possibly lean towards the former category in terms of a more fundamental explanation as to why it should succeed in improving prediction beyond the specific sample on which it was developed. Ghiselli (1960b) proposed a method whereby a moderator variable may be empirically developed for a specific prediction situation. Ghiselli (1956) envisaged the possibility of differentiating those individuals whose predicted and actual criterion scores show small absolute discrepancies from those individuals whose predicted and actual criterion scores are markedly different. In a derivation sample, the absolute differences between predicted and actual criterion scores are obtained. Correlation analysis is subsequently performed to identify items from a separate item pool that discriminate between high and low predictability. The items that correlate significantly with the absolute residual are then linearly combined in a predictability index. To the extent to which the predictability index correlated with the absolute residuals it should be possible to separate those subjects for whom the regression model provides accurate criterion estimates from those for whom the model performs less well. In an actual applicant sample, applicants would be ordered on the predictability index, and predictions would be made from the original predictors for the most predictable subset of applicants only. As predictions would be limited to an increasingly smaller proportion of the applicant sample, the validity of the predictor should approach unity. Selection procedures are therefore improved, not by explaining a greater proportion of the criterion variance through the addition of valid predictors, but rather by
restricting criterion inferences to those individuals for whom relative accurate predictions would be possible given the available data. Ghiselli (1956, 1960a, 1960b, 1963) has provided a number of convincing demonstrations of the utility of this approach (Wiggins, 1973).
However, the addition of the original Ghiselli predictability index to one or more predictors in a multiple regression model does not seem to improve prediction over that given by the predictor scores alone (Twigge et al., 2004; Wiggens, 1973). The value of predictability index scores lies solely in providing an index of the extent to which prediction of criterion scores from a particular test will be in error. The method does not provide for an alternative meanse of predicting those individuals who have been screened out because of their low predictability. Personnel selection, however, requires that no applicant be left in limbo without being assigned to either an accept or a reject treatment (Cronbach & Gleser, 1965).
An important aspect in the original Ghiselli proposal that seems to hold the key to overcoming this shortcoming is the direction of the differences between actual and predicted scores of performance. Ghiselli viewed this as inconsequential, as he regarded both over- and underestimates as equally important errors (Wiggins, 1973). Twigge et al. (2004), however, argued that the direction of the prediction error is precisely the critical aspect that should be taken into account along with the magnitude of the prediction error when developing a predictability index. The addition of an index to a selection battery that anticipates the direction as well as the magnitude of the prediction error could almost certainly add to the predictive validity of the battery. What is required to improve predictive accuracy, according to Twigge et al. (2004), is the addition of a predictor to the regression model which functions by way of analogy like a an observation post adjusting the distance and angle of mortar or artillery fire onto a target. The predictors in a regression model for the most part provide criterion estimates that are either too high or too low. If a predictive index could be developed which would provide feedback on the magnitude of the prediction error made by the regression model as well as the direction of the error, then the inclusion of such an index in the regression equation as an additional main effect should logically enhance the predictive validity of the selection battery. Twigge et al. (2004) realized that this would mean that the predictive index should be developed from the real differences between actual and predicted criterion scores of subjects, rather than the absolute difference as Ghiselli (1956, 1960a, 1960b, 1963) originally proposed. If the direction of the prediction error is taken into account when developing a predictability index, large positive values on the index signals large positive residuals (underestimation) and large negative values (or low positive values) signal large negative residuals (overestimation), assuming a positive correlation between the predictability index and the real residuals (Y–E[Y|Xi]). Twigge et al. (2004) argued that the addition of such an index to a regression model would enhance the predictive validity of the selection procedure because its values will provide feedback on the magnitude of the prediction error derived from the regression model as well as the direction of the error. The partial regression coefficient associated with the predictability index in the expanded regression model should be positive. An initial estimate derived from the original model, which is too low (underestimate) will therefore be elevated in the subsequent estimate derived from the expanded regression model due to the influence of the positive predictability index value. On the other hand an initial estimate derived from the original model, which is too high (overestimate) will be lower in the subsequent estimate derived from the expanded regression model due to the influence of the negative predictability index value. The same principle still applies even if the predictability index scale would be linearly transformed to run from zero to some positive upper limit.
Participants/respondants
To serve the objectives of this study, the data had to meet a number of specific requirements. The data set, firstly, had to contain an explicit criterion measure and at least one predictor measure that correlates significantly with the criterion. The data set, secondly, had to contain the results of a second predictor, but in this case measures were required on the item level. The items of the second predictor had to provide the data from which the predictability index would be harvested. The data set, thirdly, had to be derived from two independent samples taken from the same population to allow the formation of a derivation sample on which the predictability index would initially be developed, and an independent holdout sample on which the predictability index could be replicated and the on which the predictability index and the expanded regression model could be cross validated.
A data set was obtained from the South African Police Service (SAPS) that satisfied two of the three aforementioned requirements. A non-probability sample of 3333 entry-level students was selected from an original group of 13,681 applicants who applied for entry-level police positions. Performance on the theoretical component of the basic training programme of the South African Police Service was used as the criterion measure. The basic training programme consists of a 10-module program that needed to be successfully completed over a period of 6 months. The module instructors evaluated performance in each module. These scores were standardized per instructor (i.e., platoon) in an attempt to reduce the effect of inter-rater differences. The criterion score was obtained by taking the unweighted average of these standard scores over the ten modules (Meiring, Van de Vijver, Rothman & Sackett, 2004). Two cognitive tests (a reading and comprehension test and a spelling test) developed specifically for the SAPS (Meiring et al., 2004) were used as the primary predictors. The reading and comprehension test consisted of four paragraphs that were selected from the training material used in the basic training modules. The 40 item spelling test was developed by asking training instructors at the training college to generate a pool of police-relevant words that students generally find difficult to spell when they start their basic training. Descriptive statistics on the criterion and the predictors are shown in Table 1 for the total sample.
TABLE1
DESCRIPTIVE STATISTICS OF THE PREDICTOR AND CRITERION DISTRIBUTIONS
Read& Comp Spelling Training (X1) (X2) Performance
(Y)
N Valid 3333 3333 3333
Missing 0 0 0
Mean 8,05 33,54 0,000
Median 8,00 35,00 0,024
Mode 7 37 -0,0842
Std. Deviation 2,516 4,839 0,984 Variance 6,330 23,417 0,967 Skewness 0,335 -1,518 -0,140 Std. Error of Skewness 0,042 0,042 0,042 Kurtosis -0,030 3,725 -0,376 Std. Error of Kurtosis 0,085 0,085 0,085
Minimum 14 -3,466
Maximum 16 40 2,759
Multiple modes exist. The smallest value is shown
small departures from normality. The spelling test total scores really is the only distribution that markedly departs from normality with pronounced negative skewness and positive kurtosis.
The items of the Fifteen Factor Personality Questionnaire Plus (15FQ+) (Psytech, 2004) were used for the development of a predictability index based on real residuals. The 15FQ+ is a normative, trichotomous response, personality test that has been developed by Psytech International as an update of the original 15FQ (Psytech, 2004). The 15FQ+ provides scores on the following sixteen personality dimensions: Cool Reserved – Outgoing; Intellectance; Affected by Feelings – Emotionally Stable; Accommodating – Dominant; Sober serious – Enthusiastic; Expedient – Conscientious; Retiring – Socially Bold; Tough Minded - Tender Minded; Trusting – Suspicious; Practical – Abstract; Forthright – Discreet; Self-assured – Apprehensive; Conventional – Radical; Group Orientated -Self-Sufficient; Undisciplined – Self-Disciplined; Relaxed – Tense Driven (Psytech, 2004). These sixteen personality dimensions will be pitted against the predictability index to determine the more fruitful way of extending the basic regression model.
The data set obtained from the SAPS was subsequently randomly split to form a derivation sample (n = 1667) and a holdout sample (n = 1666). Descriptive statistics on the criterion and the predictors are shown in Table 2 for the two samples separately.
TABLE2
DESCRIPTIVE STATISTICS OF THE PREDICTOR AND CRITERION DISTRIBUTIONS FOR THE TWO SAMPLES SEPARATELY
Read& Comp Spelling Training (X1) (X2) Performance
(Y)
N Valid 1667 1667 1667
Missing 0 0 0
Mean 8,02 33,45 ,041
Median 8,00 35,00 ,036
Mode 7 37 -,359
Std. Deviation 2,490 4,999 ,963 Variance 6,200 24,992 ,928 Skewness ,286 -1,448 -,036 Std. Error of Skewness ,060 ,060 ,060 Kurtosis -,030 2,944 -,554 Std. Error of Kurtosis ,120 ,120 ,120
Minimum 17 -2,481
Maximum 16 40 2,674
Holdout sample
N Valid 1666 1666 1666
Missing 0 0 0
Mean 8,08 33,64 -0,041
Median 8,00 35,00 0,005
Mode 7 37 -0,361
Std. Deviation 2,542 4,673 1,002 Variance 6,463 21,839 1,004 Skewness 0,379 -1,593 -0,224 Std. Error of Skewness 0,060 0,060 0,060 Kurtosis -0,033 4,687 -0,264 Std. Error of Kurtosis 0,120 0,120 0,120
Minimum 14 -3,465
Maximum 16 40 2,759
Multiple modes exist. The smallest value is shown
Table 2 indicates that the predictor and criterion distributions largely coincide in the two samples.
To be able to convincingly demonstrate that a predictability index also functions effectively outside the sample on which it was developed would require independent samples taken from the same population (Guion, 1998; Murphy, 1983). The procedure used in this study of randomly dividing the selected sample into two equal samples, however, fails to achieve this. Any sample bias that might exist in the initial sample would most probably remain in both the derivation sample and the holdout sample. A comparison of the descriptive statistics portrayed in Table 1 to those presented in Table 2 attests to this dilemma. This should positively bias (i.e., artificially restrict) the amount of shrinkage observed. The procedure used here, nonetheless, is preferable to no cross validation at all (Guion, 1998).
Statistical hypotheses
Hypothesis 1: Average training performance (Y) is significantly influenced by reading and comprehension proficiency (X1) as well as spelling proficiency (X2).
H01a: r[Y,X1] = 0 Ha1a: r[Y,X1] > 0 H01b: r[Y,X2] = 0 Ha1b: r[T,X2] > 0
Hypothesis 2: Reading and comprehension proficiency (X1) and spelling proficiency (X2) both significantly explain unique variance in the criterion measure (Y).
H02a: b1[X1] = 0 | b2[X2] ¹0 Ha2a: b1[X1] > 0 | b2[X2] ¹0 H02b: b2[X2] = 0 | b1[X1] ¹0 Ha2b: b2[X2] > 0 | b1[X1] ¹0
Hypothesis 3: A predictability index (X3) can be developed from the items of the 15FQ+ that shows a strong and statistically significant correlation with the real residuals (Y – E[Y|Xi]) (Yres_deri) computed from the regression of the criterion (Y) on a weighted linear composite of reading and comprehension proficiency (X1) and spelling proficiency (X2) in the derivation sample.
H03: r[Yres_deri, X3] = 0 Ha3: r[Yres_deri, X3] > 0
Hypothesis 4: The addition of the predictability index, based on the real values of the residuals (X3), to the basic regression model will significantly explain unique variance in the criterion measure (Y) that is not explained by the existing predictors in the model (X1& X2) in the derivation sample.
H04: b3[X3] = 0 | b1[X1] ¹0 ; b2[X2] ¹0 Ha4: b3[X3] > 0 | b1[X1] ¹0 ; b2[X2] ¹0
Hypothesis 5: The incremental validity achieved in the derivation sample by adding the predictability index based on the real values of the residuals (X2) to the regression model will exceed the incremental validity achieved in the derivation sample by adding the personality scales (Xpi) from which the predictability index items were harvested to the model.
H05: r[E(Y|X1X2X3],Y] = r[ E(Y|X1X2Xpi],Y] Ha5: r[E(Y|X1X2X3],Y] > r[ E(Y|X1X2Xpi],Y]
correlation with the real residuals computed from the regression of the criterion (Y) on a weighted linear composite of reading and comprehension proficiency (X1) and spelling proficiency (X2) in the derivation sample. Fderi= 0 for an item if the item of the 15FQ+ does not significantly correlate with the real residuals in the derivation sample) will therefore correlate perfectly with the filter variable (Fhold) calculated on the holdout sample.
H06: r[Fderi,Fhold] = 1 Ha6: r[Fderi,Fhold] < 1
Hypothesis 7: The predictability index, based on the real values of the residuals, developed on the derivation sample (X3) will correlate significantly with the real residuals obtained from the regression of the criterion (Y) on a weighted linear composite of reading and comprehension proficiency (X1) and spelling proficiency (X2) in the holdout sample (Yres_hold).
H07: r[Yres_hold, X3] = 0 Ha7: r[Yres_hold, X3] > 0
Hypothesis 8: The addition of the predictability index, developed on the derivation sample, to the holdout regression model will significantly explain unique variance in the criterion measure that is not explained by the existing predictors (X1& X2) in the model derived on the holdout sample.
H08: b3[X3] = 0 | b1[X1] ¹0; b2[X2] ¹0 Ha8: b3[X3] > 0 | b1[X1] ¹0; b2[X2] ¹0
Hypothesis 9: The expanded regression model developed on the derivation sample (E[Y|X1 X2 X3]=a+b1X1+b2X2+b3X3) will successfully cross validate to a holdout sample.
H09: r[E[Y|X1, X2X3], Y) = 0 Ha9: rE[Y|X1, X2X3], Y) ¹0
Hypothesis 10: The predictive accuracy achieved by the application of the basic regression model expanded with the predictability index (X3) and developed on the derivation sample (E[Y|X1X2X3]=a+b1X1+b2X2+b3X3) in the holdout sample will exceed the predictive accuracy achieved by the application of the basic regression model expanded with the personality scales (Xpi) and developed on the derivation sample (E[Y|X1 X2 X3]=a+b1X1+b2X2+b3X3) in the holdout sample.
H010: r[E(Y|X1X2X3],Y] = r[ E(Y|X1X2Xpi],Y] Ha10: r[E(Y|X1X2X3],Y] > r[ E(Y|X1X2Xpi],Y]
Statistical analyses
The Statistical Package for Social Sciences (SPSS) version 11 .0 was used to test the foregoing statistical hypotheses. The specific analyses performed and the logic underlying the sequence of analyses will be presented simultaneous with the findings of the study.
RESULTS
Derivation sample
To be able to investigate the feasibility of the proposed modifications to the original Ghiselli procedure, a statistically significant linear relationship between a criterion and at least
one predictor is required. It had been hypothesized that average performance in the theoretical component of the basic training programme of the South African Police Service should be systematically related to reading and comprehension proficiency (X1) as well as spelling proficiency (X2) as measured by two tailor-made SAPS tests. Hypothesis 1 was tested by calculating the zero-order Pearson correlation between average training performance and performance on the t wo predictors (X1 & X2) and the corresponding conditional probabilities P[|rij| ³rc|H0i: r[Y,Xi] = 0]. Given a 5% significance level and directional alternative hypotheses, H01awill be rejected if P[|rij| ³rc|H0i: r[Y,Xi] = 0] < 0,05. The matrix of zero-order product moment correlation coefficients and the corresponding conditional probabilities is portrayed in Table 3.
TABLE3
CORRELATIONS BETWEEN PREDICTORS AND CRITERION IN THE DERIVATION SAMPLE(N= 1667)
Read & Spelling Training Comp (X2) Performance
(X1) (Y)
Read& Comp (X1) Pearson 1 0,065** ,248** Correlation
Sig. (1-tailed) 0 0,004 0,000
Spelling (X2) Pearson 0,065** 10,241** Correlation
Sig. (1-tailed) 0,004 0 0,000
Training Performance Pearson 0,248** 0,241** 1 (Y) Correlation
Sig. (1-tailed) 0,000 0,000 .
** Correlation is statistically significant at the 0,01 level (1-tailed).
The convention proposed by Guilford (cited in Tredoux & Durrheim, 2002, p. 184) has been used to interpret sample correlation coefficients. Although somewhat arbitrary and although it ignores the normative question about the magnitude of values typically encountered in a particular context, it nonetheless fosters consistency in interpretation.
Table 3 suggests that the two cognitive measures could jointly be used as the primary predictors of average training performance. Reading and comprehension (X1) correlates low (0,248) but significantly (p < 0,05) with the criterion. Spelling (X2) likewise correlates low (0,241) but significantly (p < 0,05) with the criterion. H01aand H02acan therefore both be rejected. The two predictors, moreover, correlate only slightly (0,065) albeit significantly with each other. Since the two cognitive predictors both seem to significantly explain unique variance in training performance, the regression of Y on X1and X2should serve as an acceptable basic regression model to empirically investigate the practical feasibility of the predictability index proposed by Twigge et al. (2004) as proposed above.
Average training performance (Y) was subsequently regressed on reading and comprehension ability (X1) and spelling ability (X2) by fitting the regression model shown as equation 1 on the data:
E(Y|X1X2) = a+ b1[X1] + b2[X2] (1 ) The results of the standard regression analysis are presented in Table 4. Table 4 confirms that the two cognitive predictors both do significantly (p < 0,05) explain unique variance in training performance. H02a and H02bcan therefore both be rejected. A rather dismal 11 % of the variance in the criterion can be explained in terms of the weighted linear combination of the two cognitive predictors.
TABLE4
MULTIPLE LINEAR REGRESSION OF AVERAGE TRAINING PERFORMANCE ON READING AND COMPREHENSION AND
SPELLING IN THE DERIVATION SAMPLE
R R Square Adjusted R Square Std. Error of the Estimate
0,335 0,112 0,111 0,90818368
Sum of Squares df Mean Square F Sig.
Regression 173,105 2 86,552 104,938 0,000 Residual 1372,463 1664 0,825
Total 1545,568 1666
Unstandardised Standardised t Sig. Correlations Coefficients Coefficients
B Std. Error BetaZero- Par- Part order tial
(Constant) -2,135 0,163 -13,112 0,000
Read& 9,017E-02 0,009 0,233 10,070 0,000 0,248 0,240 0,233 Comp (X1)
Spelling 4,345E-02 0,004 0,225 9,7410,000 0,2410,232 0,225 (X2)
Dependent Variable: Training Performance (Y)
The real unstandardized residuals (Y – E[Y|Xi]) were sub-sequently derived from the regression model fitted to the derivation sample and written to the active data file. The real unstandardized residuals are plotted against the weighted linear combination of the two cognitive predictors in Figure 1. From Figure 1 it appears as if the linearity, normality and homoscedasticity assumptions underlying the linear model have been reasonably well satisfied (Tabachnick & Fidell, 1989).
Figure 1: Real unstandardized residuals plotted against the weighted linear combination of the two cognitive predictors
The individual items of the 15FQ+ were subsequently correlated with the real residuals computed from the fitted regression model. The 15FQ+ items that correlated significantly with the real residuals at the 0,05 level were flagged for inclusion in the predictability index (X2). Forty-two items (out of 200) correlated significantly with the real residuals at this level4. The selected forty-two 15FQ+ items that correlated with the real residuals were subsequently combined in an unweighted linear composite by taking the mean of the qualif ying items, to form the predictability index (X3) based on real residuals. The items that correlated negatively with the real residuals were first reflected before inclusion in the composite.
The inter-correlation between the predictability index based on the real residuals (X3,), the unstandardized real residuals, the two primary predictors and the criterion are depicted in Table 5.
TABLE5
CORRELATIONS BETWEEN THE PREDICTABILITY INDEX,
THE PRIMARY PREDICTORS, THE UNSTANDARDISED RESIDUALS AND THE CRITERION IN THE DERIVATION SAMPLE(N= 1667)
Pred Unstan Training Read& Spelling Index dardized Perform- Comp (X2)
(X3) Residual ance (Y) (X1)
Pred Index Pearson 10,246** ,309** 0,271** 0,059** (X3) Correlation
Sig. (1-tailed) 0 0,000 0,000 0,000 0,008
Unstandard- Pearson 0,246** 10,942** 0,000 0,000 ized Residual Correlation
Sig. (1-tailed) 0,000 0 0,000 0,500 0,500
Training Pearson 0,309** 0,942** 10,248** 0,241** Performance Correlation
(Y) Sig. (1-tailed) 0,000 0,000 0 0,000 0,000
Read& Comp Pearson 0,271** 0,000 0,248** 1 0,065** (X1) Correlation
Sig. (1-tailed) 0,000 0,500 0,000 0 0,004
Spelling (X2) Pearson 0,059** 0,000 0,241** 0,065** 1
Correlation
Sig. (1-tailed) 0,008 0,500 0,000 0,004 0
** Correlation is statistically significant at the 0,01 level (1-tailed).
Table 5 shows that the predictability index based on real residuals, (X3), did correlate low (0,246) and significantly (p < 0,05) with the real residuals derived from regressing training performance on the two cognitive predictors. H03can therefore be rejected in favour of Ha3. It is possible to develop a predictability index (X3) from the items of a personality measure that shows a statistically significant correlation with the real residuals (Y – E[Y|Xi]) computed from the regression of the criterion on two cognitive predictors. Table 5, moreover, tentatively suggests that that the inclusion of X3 alongside X1 and X2 in a multiple regression model probably should be fruitful. X3shows only a slight (0,059) but significant (p<0,05) correlation with the spelling test results (X2), correlates low (0,271) with the reading and comprehension test (X1), while correlating slightly higher, yet still low (0,309) with the criterion. The predictability index based on real residuals (X2) therefore seems to explain unique variance in the criterion not explained by the primary predictors.
Table 5 also indicates that the unstandardized real residuals correlate very high (0,942) and statistically significantly (p < 0,05) with the dependent variable training performance. This could raise the concern that the real residual and the criterion are essentially the same variable. Since the modified predictability index is constructed from items correlating with the real residual, one could then moreover argue that the whole exercise essentially boils down to using a variable to predict itself. This line of reasoning, however, ignores the fact that the total criterion sum of squares (S(Yi -E[Y])²) can be partition into a sum of squares due to regression (S(E[Y|Xi]-E[Y])²) and a residual sum of squares (S(Yi-E[Y|Xi])²). The total variance can thus be partitioned into a proportion criterion variance that can be explained in terms of the regression model (0,335²) and a proportion criterion variance that cannot be explained in terms of the weighted linear combination of the reading and comprehension test and the spelling test (1-0,335²). The very high correlation observed between training performance and the real residual is therefore simply an alternative expression
Unstandardized Predicted Value
1.5 1.0 .5 0.0 -.5 -1.0 -1.5
Unstandardized
Residual
3
2
1
0
-1
-2
of the fact that the multiple regression model only explains a small proportion (0,335² = 0,112) of the variance in training performance. The remaining proportion of the variance in training performance (0,942² = 0,887) is explained by an array of unknown systematic and random influences reflected in the real residual.
Table 6 reveals that the addition of the predictability index, based on the real values of the residuals (X2), to the basic regression model significantly (p < 0,05) explains unique variance in the criterion measure that is not explained by the original two cognitive predictors. H04can thus be rejected in favour of Ha4. The original predictors still significantly (p < 0,05) explain variance in the criterion not explained by the predictabilit y index. The expanded regression model explains approximately 17% of the variance in the criterion, compared to the approximately 11 % explained by the basic model. The addition of the predictability index thus affected a rather modest 6% increase in the proportion criterion variance explained.
TABLE6
STANDARD MULTIPLE REGRESSION OF TRAINING PERFORMANCE ON THE TWO COGNITIVE PREDICTORS AND THE PREDICTABILITY INDEX DERIVED FROM REAL RESIDUALS(X3) IN THE DERIVATION SAMPLE
R R Square Adjusted R Square Std. Error of the Estimate
0,413 0,170 0,169 0,87816037
Sum of Squares df Mean Square F Sig.
Regression 263,120 3 87,707 113,732 0,000 Residual 1282,448 1663 0,771
Total 1545,568 1666
Unstandardised Standardised t Sig. Correlations Coefficients Coefficients
B Std. Error BetaZero- Par- Part order tial
(Constant) -3,715 0,215 -17,289 0,000
Read& Comp 6,407E-02 ,009 0,166 7,128 0,000 0,248 0,172 0,159 (X1)
Spelling 4,145E-02 ,004 0,215 9,603 0,000 0,241 0,229 0,214 (X2)
Pred Index 1,438 ,133 0,251 10,804 0,000 0,309 0,256 0,241 (X3)
Dependent Variable: Training Performance (Y)
Table 6 reveals that the unique variance in the predictability index (X3) explains approximately 7% (0,256²) of the unique variance in the criterion. The unique variance in the predictability index (X3) explains approximately 6% (0,241²) of the total variance in the criterion. Judged by the standardized partial regression coefficients and the partial and semi-partial correlation coefficients the predictability index is the more influential predictor in the regression model.
The question, however, is whether it is worth dissecting the 15FQ+for items for the predictability index, thus forfeiting the chance of utilizing the 15FQ+ scale scores as additional predictors in the regression model. The best subset of 15FQ+ factors (Xpi) was consequently identified that would maximally explain unique variance in the criterion when added to a model already containing the t wo cognitive predictors, utilizing a combination of hierarchical and stepwise regression. The two cognitive predictors were entered into the model as a block in step 1. In step 2, stepwise regression was used to select the subset of personality variables that is useful in explaining variance in the criterion not explained by the variables already in the model.
A comparison of the results shown in Table 6 to those shown in Table 7 indicates that the incremental validity achieved in the derivation sample by adding the predictability index based on the real values of the residuals (X3) to the regression model marginally exceeds the incremental validity achieved in the derivation sample by adding the personality scales (Xpi) from which the predictability index items were harvested to the model. Dissecting the 15FQ+for items for the predictability index, instead of utilizing the 15FQ+scale scores as additional predictors in the regression model resulted in only a modest gain of 2,7% additional criterion variance being explained.
TABLE7
STANDARD MULTIPLE REGRESSION OF TRAINING PERFORMANCE ON THE TWO COGNITIVE PREDICTORS AND THE BEST SUBSET OF
15FQ+FACTORS IN THE DERIVATION SAMPLE
R R Square Adjusted R Square Std. Error of the Estimate
0,379 0,143 0,139 0,89389859
Sum of Squares df Mean Square F Sig.
Regression 221,534 9 24,615 30,805 0,000 Residual 1324,034 1657 0,799
Total 1545,568 1666
Unstandardised Standardised t Sig. Correlations Coefficients Coefficients
B Std. Error BetaZero- Par- Part order tial
(Constant) -2,892 ,389 -7,434 0,000
Read& 7,277E-02 ,009 0,188 7,962 0,000 0,248 0,192 0,181 Comp (X1)
Spelling 4,166E-02 0,004 0,216 9,418 0,000 0,241 0,225 0,214 (X2)
FL -1,841E-02 0,006 -,081 -3,333 0,001 -0,139 -0,082 -0,076 FQ3 4,349E-02 0,014 ,070 3,053 0,002 0,115 0,075 0,069 FE 1,727E-02 0,007 ,061 2,550 0,011 0,078 0,063 0,058 FA 2,506E-02 0,008 ,077 3,054 0,002 0,147 0,075 0,069 FI -1,140E-02 0,005 -,051 -2,181 0,029 -0,037 -0,053 -0,050 FO -1,581E-02 0,006 -,064 -2,697 0,007 -0,110 -0,066 -0,061 FH -1,256E-02 0,005 -,057 -2,293 0,022 -0,006 -0,056 -0,052 Dependent Variable: Training Performance (Y)
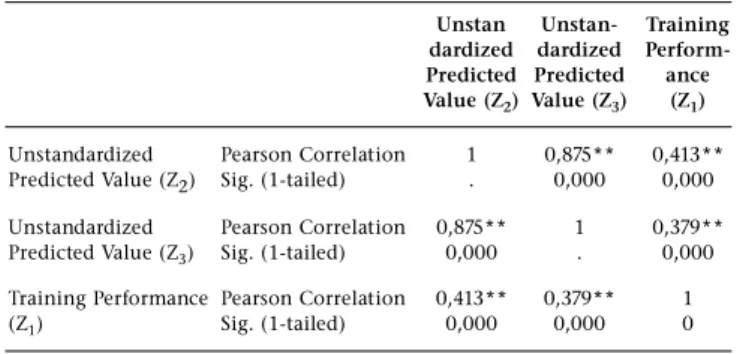
H05was tested by calculating a test statistic shown as equation 2 below, proposed by Hotelling (Guilford & Fruchter, 1978) for situations where two different variables (Z2& Z3) are correlated with the same third variable (Z1) from data obtained from the same sample.
tdr= (r12–r13)Ö{[(n-3)(1+r23)]/[2(1-r23²-r12²-r13²+2r23r12r13]} 2 where:
Z1= the criterion Y (i.e., average training performance);
Z2= a weighted linear composite of X1, X2and X3utilizing the unstandardized regression weights depicted in Table 6;
Z3= a weighted linear composite of X1, X2and Xpiutilizing the unstandardized regression weights depicted in Table 7. The requisite correlations are depicted in Table 8.
Inserting the values in Table 8 into equation 2:
tdr = (0,413-0,379) Ö{[(1667-3)(1 +0,875)]/[2(1 -0,875²-0,413²-0,379²+2(0,875)(0,413)(0,379)]}
TABLE8
CORRELATION BETWEEN TRAINING PERFORMANCE,
Z2 AND Z3(N= 1667)
Unstan Unstan- Training dardized dardized Perform-Predicted Perform-Predicted ance Value (Z2) Value (Z3) (Z1)
Unstandardized Pearson Correlation 10,875** 0,413** Predicted Value (Z2) Sig. (1-tailed) . 0,000 0,000
Unstandardized Pearson Correlation 0,875** 10,379** Predicted Value (Z3) Sig. (1-tailed) 0,000 . 0,000
Training Performance Pearson Correlation 0,413** 0,379** 1 (Z1) Sig. (1-tailed) 0,000 0,000 0
** Correlation is statistically significant at the 0,01 level (1-tailed).
Given 1664 degrees of freedom, tdr< tk= 1,64. H05can consequently not be rejected. Although the predictability index marginally outperforms the scales from which it was constructed in explaining unique variance in the criterion in the derivation sample, the difference is too small not to be attributable to sampling error.
Holdout sample: Replication and cross-validation
To determine whether it would be possible to replicate the predictability index in the holdout sample, the criterion was regressed on the two cognitive predictors, the real unstandardized residuals were derived and written to the active data file.
TABLE9
MULTIPLE LINEAR REGRESSION OF AVERAGE TRAINING PERFORMANCE ON READING AND COMPREHENSION AND
SPELLING IN THE HOLDOUT SAMPLE
R R Square Adjusted R Square Std. Error of the Estimate
0,350 0,122 0,121 0,93926995
Sum of Squares df Mean Square F Sig.
Regression 204,678 2 102,339 116,000 0,000 Residual 1467,145 1663 0,882
Total 1671 ,823 1665
Unstandardised Standardised t Sig. Correlations Coefficients Coefficients
B Std. Error BetaZero- Par- Part order tial
(Constant) -2,519 0,178 -14,184 0,000
Read& 9,317E-02 0,009 0,236 10,255 0,000 0,256 0,244 0,236 Comp (X1)
Spelling 5,130E-02 0,005 0,239 10,379 0,000 0,259 0,247 0,238 (X2)
Dependent Variable: Training Performance (Y)
A comparison of the model parameter estimates obtained from the derivation (Table 4) and holdout (Table 9) samples indicate that the initial finding on the regression of the training criterion of reading and comprehension proficiency (X1) and spelling proficiency (X2) replicated quite well.
The individual items of the 15FQ+were again correlated with the real residuals computed from the fitted regression model. The 15FQ+items that correlated significantly with the real residuals at the 0,05 level were flagged for inclusion in the predictability index (X2). Two dichotomous filter variables (Fderi and Fhold) were subsequently created to indicate which items stepped forward to be included in the two predictability indices calculated in the derivation and holdout samples. The two filter variables were cross
tabulated to determine the extent to which the decision on which 15FQ+ items to include in the in the predictability indices calculated on the derivation and holdout samples agree. Table 10 portrays a rather discouraging picture. Only approximately 45% of the items included in the derivation sample predictability index reappeared in the holdout sample predictability index. Only approximately 40% of the items included in the holdout sample predictability index were originally employed to form the predictability index in the derivation sample.
TABLE10
CROSS TABULATION OF FILTER VARIABLES REPRESENTING ITEM SELECTION DECISIONS FOR THE CALCULATION OF THE PREDICTABILITY INDICES OF THE DERIVATION(FDERI)
AND HOLDOUT(FHOLD) SAMPLES
Fhold Total
Excluded Included
Fderi Excluded Count 129 29 158 Expected Count 120,1 37,9 158,0 % within Fderi 81,6% 18,4% 100,0% % within Fhold 84,9% 60,4% 79,0% % of Total 64,5% 14,5% 79,0%
Included Count 23 19 42 Expected Count 31,9 10,1 42,0 % within Fderi 54,8% 45,2% 100,0% % within Fhold 15,1% 39,6% 21,0% % of Total 11,5% 9,5% 21,0%
Total Count 152 48 200
Expected Count 152,0 48,0 200,0 % within Fderi 76,0% 24,0% 100,0% % within Fhold 100,0% 100,0% 100,0% % of Total 76,0% 24,0% 100,0%
Value Asymp. Approx. Approx. Std. Error T Sig.
Nominal by Nominal Phi 0,256 0,000 Cramer's V 0,256 0,000 Contingency 0,248 0,000 Coefficient
Interval by Interval Pearson's R 0,256 0,078 3,732 0,000
Ordinal by Ordinal Spearman 0,256 0,078 3,732 0,000 Correlation
N of Valid Cases 200
TABLE11
CORRELATIONS BETWEEN THE PREDICTABILITY INDEX,
THE PRIMARY PREDICTORS, THE UNSTANDARDISED RESIDUALS AND THE CRITERION IN THE HOLDOUT SAMPLE(N= 1666)
Training Unstan Pred. Read& Spelling Perform- dardized Index Comp (X2)
ance Residual (X3) (X1) (Y)
Training Pearson 10,937** 0,214** 0,256** 0,259** Performance (Y) Correlation
Sig. (2-tailed) 0 0,000 0,000 0,000 0,000
Unstandardized Pearson 0,937** 10,132** 0,000 0,000 Residual Correlation
Sig. (2-tailed) 0,000 0 0,000 1,000 1,000
Pred Index (X3) Pearson 0,214** 0,132** 1 0,269** 0,114**
Correlation
Sig. (2-tailed) 0,000 0,000 0 0,000 0,000
Read& Comp Pearson 0,256** 0,000 0,269** 10,082** (X1) Correlation
Sig. (2-tailed) 0,000 1,000 0,000 0 0,001
Spelling (X2) Pearson 0,259** 0,000 0,114** 0,082** 1
Correlation
Sig. (2-tailed) 0,000 1,000 0,000 0,001 0
** Correlation is statistically significant at the 0,01 level (2-tailed).
Although the predictability index (X3) formed on the derivation sample lost some of its original ability to explain variance in the unstandardized residuals (see Table 5), it nonetheless retained some ability to anticipate the magnitude and direction of the prediction errors made by the regression model developed on the holdout sample. Table 11 , moreover, tentatively suggests that that the inclusion of X3, formed on the derivation sample, alongside X1and X2in a multiple regression model fitted to the holdout sample probably should be fruitful.
Table 12 confirms that the addition of the predictability index, developed on the derivation sample, to the holdout regression model does significantly explain unique variance in the criterion measure that is not explained by the existing predictors (X1& X2) in the model. H08can therefore be rejected in favour of Ha8.
TABLE12
STANDARD MULTIPLE REGRESSION OF TRAINING PERFORMANCE ON THE TWO COGNITIVE PREDICTORS AND THE PREDICTABILITY INDEX DERIVED FROM REAL RESIDUALS(X3) IN THE HOLDOUT SAMPLE
R R Square Adjusted R Square Std. Error of the Estimate
0,373 0,139 0,137 0,93063518
Sum of Squares df Mean Square F Sig.
Regression 232,395 3 77,465 89,443 0,000 Residual 1439,428 1662 0,866
Total 1671 ,823 1665
Unstandardised Standardised t Sig. Correlations Coefficients Coefficients
B Std. Error BetaZero- Par- Part order tial
(Constant) -3,363 0,231-14,579 0,000
Read& 7,934E-02 0,009 0,2018,506 0,000 0,256 0,204 0,194 Comp (X1)
Spelling 4,864E-02 0,005 0,227 9,887 0,000 0,259 0,236 0,225 (X2)
Pred Index 813 0,144 0,134 5,657 0,000 0,214 0,137 0,129 (X3)
Dependent Variable: Training Performance (Y)
Judged by the standardized partial regression coefficients and the partial and semi-partial correlation coefficients the predictability index no longer is the most influential predictor in the regression model as was the case in the derivation sample (see Table 6).
The crux of the evidence that has to be lead to justif y the eventual regular use of predictability indices in selection research would be to show that the expanded regression model developed on the derivation sample also accurately predicts the criterion when applied on the holdout sample data. Table 13 indicates that the expanded regression model developed on the derivation sample (E[ Y|X1 X2 X3 ]=-3,715+6,407E-02X1+4,145E-02X2+1,438X3; see Table 6) did successfully cross validate to the holdout sample. H09 can therefore be rejected in favour of Ha9.
TABLE13
CORRELATIONS BETWEEN ACTUAL TRAINING PERFORMANCE OF THE HOLDOUT SAMPLE AND PREDICTED PERFORMANCE
DERIVED FROM THE DERIVATION SAMPLE REGRESSION MODEL(N= 1666)
Training Predicted Performance Training
(Y) Performance
Training Performance Pearson Correlation 10,360** (Y) Sig. (1-tailed) 0 0,000
Predicted Training Pearson Correlation 0,360** 1 Performance Sig. (1-tailed) 0,000 0
** Correlation is statistically significant at the 0,01 level (1-tailed).
Although the multiple correlation shrunk from a moderate (Tredoux & Durrheim, 2002) 0,413 (See Table 6) to a small 0,360, the degree of shrinkage observed (0,053) increases confidence in regular use of predictability indices in selection models. The concerns raised earlier about the lack of independence between the derivation and holdout samples should, however, be kept in mind.
The predictive accuracy achieved by the application of the basic regression model expanded with the predictability index (X3) and developed on the derivation sample (E[Y|X1 X2 X3]=-3,715+6,407E-02X1+4,145E-02X2+1,438X3) in the holdout sample relative to the predictive accuracy achieved by the application of the basic regression model expanded with the personality scales (Xpi) and developed on the derivation sample (See Table 7) in the holdout sample, however, tends to temper the foregoing enthusiasm somewhat. A comparison of the results shown in Tables 6 and 7 to those depicted in Tables 13 and 14 indicates that the marginal advantage achieved by adding the predict-ability index based on the real values of the residuals (X3) to the regression model rather than the personality scales (Xpi) from which the predictabilit y index items were harvested, is maintained in cross validation. H010 could not be formally tested.
TABLE14
CORRELATIONS BETWEEN ACTUAL TRAINING PERFORMANCE OF THE HOLDOUT SAMPLE AND PREDICTED PERFORMANCE DERIVED FROM
THE DERIVATION SAMPLE REGRESSION MODEL EXPANDED BY THE BEST SUBSET OF15Q+ FACTORS(N= 1666)
Training Predicted Performance Training
(Y) Performance
Training Performance Pearson Correlation 10,354** (Y) Sig. (2-tailed) 0 0,000
Predicted Training Pearson Correlation 0,354** 1 Performance
Sig. (2-tailed) 0,000 0
** Correlation is statistically significant at the 0,01 level (2-tailed).
DISCUSSION
The findings of this study provide reason for cautious optimism regarding the development of predictability indices based on real residuals and their use in personnel selection procedures. The study confirms the finding of Twigge et al. (2004) that it is possible to develop a predictability index, which correlates with the real residuals derived from the regression of a criterion on one or more predictors. The study moreover substantiates the finding of Twigge et al. (2004) that the addition of such a predictability index to the original regression model can produce a statistically significant (p<0,05), albeit modest, increase in the correlation between the selection battery and the criterion. The fairly small improvement affected by the predictability index in this study in comparison to the more substantial incremental validity found in the Twigge et al. (2004) study could possibly (but not necessarily) be attributed to the questionable reliability of the criterion. Although no psychometric evidence on the reliability of the criterion is available to substantiate this suspicion, the unstandardized, subjective nature of the module instructor evaluations, combined with the fact that only one instructor evaluated each student, seems to make this a reasonable speculation. The modest correlations found between the two cognitive predictors and the criterion could also be a symptom of the same problem, although again this need not necessarily be the case. Restriction of range could also have played a role given the fact that the study sample had been selected from the initial intake via the two predictors utilized in this study.
The items combined in the predictability index were donated by one or more existing scales. These scales as such could, however, have been added to the existing selection model. This study offers only limited and rather unconvincing support for dissecting the donor scales for items for the predictability index, instead of utilizing the scale scores themselves as additional predictors in the regression model. The incremental validity achieved by adding the predictability index to the regression model only marginally exceeded that achieved by adding the scales from which the predictability index items were harvested to the prediction model. The reliability of the personality sub-scales in relation to the reliability of facets comprising the predictability index (see discussion below) almost certainly will play a role in deciding the relative advantage of dissecting the donor scales but this had not been formally taken into account in this study.
Confidence in the regular use of predictability indices in selection models would be greatly enhanced if it could be shown that the same test items that qualified for inclusion in the predictability index in the derivation sample would again step forward for inclusion in the predictability index in a holdout sample. This study, however, fails to provide this
assurance. Only approximately 45% of the items included in the derivation sample predictability index reappeared in the holdout sample predictability index. Only approximately 40% of the items included in the holdout sample predictability index were originally employed to form the predictability index in the derivation sample. This issue seems to relate to a core question underlying the debate on the use of predictability indices in personnel selection. Why do specific items demonstrate the ability to reflect and even anticipate the prediction errors made by an existing prediction model? Systematic variance in the criterion is induced by systematic differences in a complex nomological network of person-centred and situational latent variables. The manner in which criterion performance rises and falls in response to changes in these (assume p) determining latent variables could be conceptualised in terms of a (possibly curvilinear) hyper plane in a p+1 dimensional space. To the extent that influential determinants of criterion performance are excluded from a prediction model, the accuracy of prediction will suffer because the push and/or pull effects of numerous influential variables on criterion performance are ignored. The extent to which prediction accuracy will suffer will, however, vary across individuals. For some individuals the omitted variables exert a marked push or pull force to dramatically adjust the effect of the predictor(s) currently taken into account by the prediction model on criterion performance. Large real residuals are thus obtained for these individuals. For others the effect of the omitted variables on criterion performance is less dramatic. Smaller real residuals thus result. The real residuals contain the influence of all systematic influences that affect criterion performance but were omitted from the regression model. Could it be that the procedure used to develop a predictability index is uncovering indicator variables of some of the latent variables that affect criterion performance but that were not incorporated in the original prediction model? The results reported by Twigge et al. (2004) tentatively suggested that the predictability index could possibly be more than simply an incoherent, meaningless collection of items that have nothing more in common than their correlation with the regression residuals. Although Twigge et al. (2004) were not willing to take a definite stance on this, their findings at least point to the possibility that the items comprising the predictability index could systematically measure one or more underlying common latent variables relevant to the criterion. If this is indeed the case, the question arises whether the same basic latent structure underlies the items that qualified for inclusion in the predictability indices calculated in the derivation and holdout samples? The question thus essentially is whether the items not shared across the two indices are alternative indicators of the same underlying latent variables? Should this be the case, the present findings clearly become significantly less disturbing. This study unfortunately chose not examine this issue. Future studies should, however, attempt to examine this possibility by performing separate exploratory factor analyses on the items that qualified for inclusion in the predictability indices calculated in the derivation and holdout samples. If similar latent structures would be found and if a sufficient number of marker items would appear in both indices, the fit of a measurement model reflecting the hypothesized loading of all items that qualified for inclusion in the predictability indices could be evaluated. The strong empirical character of the predictability index tends to raise the concern that the index is nothing more than an opportunistic exploitation of chance relationships. This justified fear shared by the researcher will remain until a convincing theoretical explanation can be offered as to why specific items demonstrate the ability to reflect and even anticipate the prediction errors made by an existing prediction model.
nonetheless still correlated significantly (p<0,05) with the real residuals obtained from fitting a new basic regression model on the holdout sample. Moreover, the addition of the predictability index, developed on the derivation sample, to the holdout regression model significantly (p<0,05) explained unique variance in the criterion measure not explained by the predictors in the basic model.
Confidence in the regular use of predictability indices in selection models was bolstered by the fact that the expanded regression model developed on the derivation sample successfully cross validated to the holdout sample. But then again, the degree of shrinkage associated with the regression model expanded with the predictability index, small as it may be, exceeded the shrinkage associated with the regression model expanded with the scales from which the predictability index items were harvested. Despite this, however, the marginal advantage achieved by adding the predictability index to the regression model rather than the scales from which the predictability index items were harvested, was maintained in cross validation.
Research on the feasibility of the regular use of predictability indices in personnel selection could probably be served if the opportunities offered by normal validation studies would be better utilized. More often than not validation studies fail to find empirical support for the use of at least one or more predictors initially hypothesized to significantly explain variance in the criterion. Rather than simply eliminating the failed predictors from the analysis, these scales could be dissected in search of possible predictability indices.
REFERENCES
Campbell, J.P. (1991). Modelling the performance prediction problem in industrial and organisational psychology. In M.D. Dunnette & L.M. Hough (Eds), Handbook of industrial and organizational psychology (pp.39-74). Palo Alto, Callifornia: Consulting Psychologists Press.
Cronbach, L.J., & Gleser, G.C. (1965). Psychological tests and personnel decisions(2nd ed.). Urbana, Illinois: University of Illinois Press.
Gatewood, R.B. & Feild, H.S. (1994). Human resource selection (3rd ed.). Fort Worth, Texas: Dryden.
Ghiselli, E.E. (1956). Differentiation of individuals in terms of their predictability. Journal of Applied Psychology, 40, 374–377. Ghiselli, E.E. (1960a). The prediction of predictability.
Educational and Psychological Measurement, 20, 3-8. Ghiselli, E.E. (1960b). Differentiation of tests in terms of the
accuracy with which they predict for a given individual. Educational and Psychological Measurement, 20, 675-84. Ghiselli, E.E. (1963). Moderating effects and differential reliability
and validity. Journal of Applied Psychology, 47, 81-86
Ghiselli, E.E., Campbell, J.P. & Zedeck, S. (1981). Measurement theory for the behavioral sciences. San Francisco, Callifornia: Freeman & Company.
Guilford, J.P. & Fruchter, B. (1978). Fundamental statistics in psychology and education. Tokyo: McGraw Hill.
Guion, R.M. (1991 ). Personnel assessment, selection and placement. In M.D. Dunnette & L.M. Hough (Eds), Handbook of industrial and organizational psychology(2nded.) (pp. 327-398). Palo Alto, Callifornia: Consulting Psychologists Press. Guion, R.M. (1998). Assessment, measurement and prediction for
personnel decisions. Mahwah, New Jersey: Lawrence Erlbaum Associates, Publishers.
Hull, C.L. (1928). Aptitude testing. London: Harrap.
Meiring, D., Van de Vijver, F.J.R., Rothman, S. & Sackett, P.R. (2004). Differential prediction of cognitive and personality measures in South Africa. Unpublihed manuscript.
Murphy, K.R. (1983). Fooling yourself with cross-validation: single sample designs. Personnel Psychology, 36, 111 -118. Psytech (2003). Instruments. World Wide Web
(http://www.psytech.co.za). Psytech SA (Pty) Ltd.
Tabachnick, B.G. & Fidell, L.S. (1989). Using multivariate statistics (2nded.). New York, New York: Harper Collins.
Tredoux, C.G. & Durrheim, K.L. (2002). Numbers, hypotheses and conclusions. Cape Town: Juta.
Twigge, L., Theron, C.C., Steele, H. & Meiring D. (2005). A psychometric investigation into the use of an adaptation of the Ghiselli predictability index in personnel selection. SA Journal of Industrial Psychology, 31(1), 18-30.