Urban Air Pollution Monitoring Using Wireless
Sensor Networks:
A Comprehensive Review
Movva Pavani
1, P.Trinatha Rao
21
Department of ECE, Faculty of Science and Technology, IFHE University, Hyderabad, India
2
Department of ECE, School of Technology, GITAM University, Hyderabad, India
Abstract: Air pollution is evolving as a severe environmental
concern due to its enormous impact on the well being of the people, universal environment and also on the global economy. Conventional air pollution systems are not able to provide air pollution data of high spatiotemporal resolution due to non-scalability and limited data availability. With the advances in the areas of Micro Electro Mechanical Sensor (MEMS) and Wireless Sensor Network (WSN), the researchers proposed various state-of-the-art air pollution monitoring systems for measuring major air pollutants like CO2, CO, O3, SO2, VOC and Particulate Matter (PM)
with better results. A comprehensive review of continuous air pollution surveillance of both indoor and outdoor pollution by employing WSN is presented. It presents the various techniques and algorithms employed in the design of dedicated air pollution monitoring systems using WSN. A comprehensive and detailed review of the existing methods of Air Quality Monitoring systems using WSN is done along with their comparisons.
Keywords: Air Quality Monitoring, Wireless Sensor Network,
Air Quality Index, Mobility, Temporal Resolution, Quality of Service (QoS), Routing Algorithms, Global System for Mobile (GSM).
1.
Introduction
Air pollution is primary concern for the human kind, as it is degrading the environmental health and inhaling the pollutant air is dangerous for the health of the humankind. Due to these adverse effects of the air pollution on the human kind, the demand for the development of high-quality air monitoring systems has been in high demand and drawing the attention of researchers [1]. The air pollution monitoring systems detect the concentration levels of air pollutants and the analysis of the collected information is required for the policymakers to take necessary and proper steps to decrease the level of air pollution for the wellbeing of their citizens. For controlling air pollution first, we need to track Air Quality Index (AQI) which provides the levels of air pollution by using different sensors [2]. For the preservation of environment and health of the people measuring the air pollutants is a significant and a vital task.In the urban areas due to increase in the number of industries and automobile vehicles, emission of toxic gases like CO, NO2 and CO2 etc.
are also increasing causing the severe impact on the health conditions of the general public like coughing, wheezing and asthma. Poor air quality may cause increased short-term health problems such as fatigue and nausea as well as chronic respiratory diseases, heart disease, and lung cancer. To monitor the indoor and outdoor air pollution, the
necessary steps involved in the design of the monitoring systems are data collection, analyzing the collected data and transmission of collected data. Wireless Sensor Networks (WSNs) are extensively used in the real-time applications to gather and examine the data smartly without the human involvement. In the present day, WSNs are widely employed in all the commercial, industrialized and military applications [2].Air pollution is monitored by conventional systems with stationary devices traditionally[1]. These monitoring stations are highly reliable, accurate and able to measure pollutants by employing the traditional analytical equipment, such as gas chromatograph-mass spectrometers. The drawbacks of the conventional monitoring devices are their large size, heavyweight and extraordinarily expensive. The locations of the monitoring stations need to be carefully placed to be useful as the concentration levels of air pollutants are sensitive to the human habitations and also depend on construction activities, movement of automobiles. Conventional air pollution systems are not able to provide air pollution data of high spatiotemporal resolution due to non-scalability and limited data availability
In the proposed paper, different air pollution monitoring methods using WSN is presented. It also brings the difference between conventional and WSN based air pollution monitoring systems [24].It describes the implementation, simulation methods to monitor Air pollution
2.
Related work
Wei Ying Yi et al. 2015 [1] presented the concept of The Next Generation Air Pollution Monitoring System (TNGAPMS) with emphasis on the need for developing a real-time air pollution monitoring systems with low cost, energy efficient and high spatiotemporal resolution. The Next Generation Air Pollution Monitoring System (TNGAPMS) classified into three types of sensor networks based upon the carriers of the sensing elements are Sensors static Sensor Network (SSN), Community Sensor Network (CSN), Vehicle Sensor Networks (VSN). The working of these sensor networks was discussed along with the advantages, disadvantages, comparisons and limitations of present works
view program. All the CO sensors on the sensor nodes integrate with Zigbee communications. Air pollutant data sensed by the sensor nodes were sent to the central system through the gateway. The designed system was implemented in the main roads of Taipei city which were able to collect finest air pollution information in real time scenario. The presented work is categorized under the static sensor networks.
Kadri, A et al. 2013 [4] developed a wireless sensor network for outdoor air pollution monitoring and tested the designed prototype on the real-time basis. In the designed system the sensors are used to collect the pollution data of O3, NO2, CO,
H2S and sensed information is send to the server through the
GPRS. A solar panel was used for solving the power limitation of the stationary sensor nodes. Air pollution data captured by the sensor nodes can be made available to the public through the customized mobile and web Apps etc. after obtaining the authorization for the data dissemination. The presented work is categorized under the static sensor networks.
Mansour, S et al. 2014 [5] presented the outdoor air quality monitoring system based on wireless sensor networks for industrialized and urban areas. Designed system is capable of sensing O3, CO and NO2.These sensors are mounted on the
sensor nodes Libelium’s [43] Wasp mote. ZigBee communication link is used to upload the collected data by the gas sensors to the central server. Approved air pollution data is made available to the community through customized Web App, Emails or SMS. Designed system is simple, and it can be easily integrated with other applications. Clustering Protocol of Air Sensor (CPAS) was implemented in the designed system to improve the efficiencies in network lifetime, communication rate and network energy consumption in the simulation environment. In the proposed protocol, detection of failed sensor nodes and minimization of power consumption by the sensor nodes was achieved. The presented work is categorized under the static sensor networks in which the reliability, delay and accuracies of the system are also considered.
Khedo, K.K et al. 2010 [6] proposed a novel wireless sensor based system for air pollution monitoring (WAPMS).It consists of a communication system for collecting the air pollution information to the server from the array of sensor nodes. Air pollution data sensed by the sensor nodes sent to the server through the cluster heads autonomously. A Data aggregation algorithm Recursive Converging Quartiles (RCQ) was used to minimize the power consumption and to maximize the energy efficiency of the sensor nodes; a hierarchical routing protocol [33] was used. The designed system is implemented in the Mauritius city to monitor the outdoor air pollution. The presented work is categorized under the static sensor networks.
Jelicic, V et al. 2013 [7] proposed an indoor air pollution monitoring system based on WSN, which had addressed the issues related to the power consumption levels of the sensors, sensor nodes. In the proposed work, 36 sensor nodes were deployed on the first floor of the four-storied building to study the lifetime of the designed system. Various sensors are used on the sensor nodes for capturing the information related to temperature, humidity, carbon monoxide, VOC, accelerometers, motion sensors and obtained information is provided only to the researchers. The presented work is categorized under the static sensor networks
Hasenfratz, D et al. 2012 [9] proposed the mobile based outdoor air pollution monitoring system which is a low-cost sensing system consist of sensor nodes with small sensors for detecting the O3 and a smartphone. Using the cellular
network, location-based (GPS module built in smartphones) air pollutants information are uploaded to the server, and it is made available to the community with the customized mobile apps. In the proposed paper techniques are used to improve the quality of the data sensed by the sensors and it showed high spatial resolution. The presented work is categorized under the community sensor networks.
Mendez, D et al. 2011 [10] presented the participatory sensing technology for monitoring outdoor air pollution based on community sensor networks (P-Sense). Information sensed by the various sensors(CO, CO2, VOCs, H2,
temperature and humidity) on the sensors nodes are sent to the smart phones through the Bluetooth link. Cellular networks are used to sense the information and then uploaded the gathered information to the server to make it available to the community with the customized mobile apps. Practical issues related to the deployment of the designed system are also discussed.
Lo Re, G et al. 2014 [20] proposed a low cost and portable Urban Air Quality Monitoring Using Vehicular Sensor Networks. The designed system consists of various sensors mounted on the public transportation vehicles like buses, a GPS module and Zigbee communication link. Sensors on the sensor nodes are used to collect the levels of temperature, relative humidity, NO2, CO2, CO andO3 which are
transmitted to the central server through the Zigbee communication link. By using the mobility of public transportation vehicles, it is possible to achieve broad area coverage resulting in high spatial resolution level of information even with few sensors. Air pollution information is shared only for the research purposes.
Devarakonda, S et al. 2013 [21] presented a real-time air quality monitoring through mobile sensing in metropolitan areas. In the proposed work, portable sensor nodes are used consisting of Mobile Sensing Box (MSB) and other individual sensing devices to collect the fine-grained air pollution information.CO and PM concentration levels are sensed by the sensors of the Mobile Sensing Box. MSB mounted on the dedicated car travels around the city for the data collection, and this information was transmitted to the cloud server through the cellular network. Air pollution data captured by the sensor nodes are made available to the public through the customized mobile and web Apps etc.
Sherin Abraham et al. 2014[22] presented a low-cost wireless sensor network based indoor air quality monitoring system Designed system consist of a micro gas sensor, Arduino board and XBee modules which are capable of measuring six air quality parameters simultaneously. Sensor calibration is performed using Least Square Estimation method (LSM). Designed system results are compared with the commercially available indoor air quality monitoring systems, and the system showed an appreciable performance. The overall architecture for the WSN based Indoor air quality monitoring system is shown in the figure 1.
Problem (BSDP). Chemical Reaction Optimization (CRO) is an optimization tool used to choose the buses to install the sensors. The project was implemented in the Hong Kong Island bus route and the real-time data acquired showed the CRO technique could solve optimization problems efficiently.
Figure 1. The architecture of WSN based Indoor Air Quality Monitoring System Figures are adapted from [24].
Elias Yaacoub et al. 2013[25] presented the wireless sensor network for monitoring and analyzing the air quality in Doha, Qatar. Multi-gas monitoring stations (MGMS) are used machine-to-machine (M2M) communications to communicate with a backend server. A smart platform was deployed on the server. The platform handles data cleaning filtering and data processing tasks. It presented the data presentation for environmental experts using dedicated software tools, e.g., the R software system and its OpenAir package. Analysis and assessment of real measurement data was also investigated. Air Quality Monitoring System Architecture is as shown in the figure
Figure 2. Air Quality Monitoring System Architecture Figures are adapted from [27].
Figure 3. Block diagram of the RF sensor unit.Figures are adapted from [28].
Joonhee Kang et al. 2012 [26] proposed a low cost and portable RF based Sensor system to measure air pollution parameters like VOC, O3, NO2, and dust. Designed system
was also used for measuring the pH and DO of water. It
consists of Sensor unit, GPS unit, a Central processing unit and RF unit. Performance and efficiency of the designed system was tested against the commercially available units for the O3 and NO2 gases, and it showed the accuracy was
comparable with the standard commercial unit. Project was implemented for the air pollution monitoring in the city of Incheon in South Korea.
Tanuj Ahuja et al. 2016[27] presented a low-cost portable air pollution monitoring system by using the Internet of things (IoT) to create awareness to the public about the air quality enabling them to make better choices regarding traveling a route or purchasing of houses in the better area.
Ruiyun Yu et al. 2016[28] suggested a random forest method for finding the air quality (RAQ) for urban areas. Urban sensing systems collect the data regarding the meteorology, the historical air quality data, road information, point of Interest (POI) and real-time traffic pollution data. The algorithm was used for the data training and prediction, and it was evaluated with the city data. This algorithm showed a better prediction precision when compared with three algorithms Box model, Gaussian model, Lagrangian model. Gyu-Sik Kim et al., 2016[29] presented the environmental sensors based air quality monitoring station to capture the information related to the temperature, humidity, PM10, and
CO2.The proposed work was implemented at the Seoul
Metro and Seoul Metropolitan Rapid Transit Corporation. In the subways [37], the accuracy and precision of the PM instrument to monitor the PM10 concentrations using the light
scattering method was enhanced by the linear regression analysis technique. It was observed that use of ventilation fans experimentally in the subways could improve the air quality level and reduce the PM10 level
Movva Pavani et al. 2016 [30,31] presented a real-time pollution monitoring using wireless sensor networks (WSN).The sensors sense the concentration levels of carbon monoxide,carbon dioxide and oxygen gases deployed on sensor motes (Libelium Waspmote) which were calibrated correctly and the project was implemented in the industrial belt of Hyderabad city. A multihop data aggregation algorithm was employed, and air pollutant data collected from the designed test beds are made available onto the internet through the middleware and web interface. The developed system is capable of obtaining the fine grain pollution data on the real-time basis.
3. WSN applications in air pollution monitoring
chemical and toxins prone areas. The capability of self-organization, ability to process concurrently, economical, limited energy resources, limited range of operation, fault-tolerance and rapid deployment characteristics of Wireless Sensor Networks make them resourceful for versatile applications like military, intelligence, control, monitoring, and surveillance of targeted areas.
Figure 4. Wireless Sensor Network
The primary elements in air quality monitoring system using Wireless Sensor Networks are gas sensors (Fig. 5).
Figure 5.Various Gas Sensors
In Figure 6, the classification of gas sensors based on their working principles is shown.
The gas sensors of metal oxide semiconductor operate on the principle that the conductivity of the sensing element on the surface of the gas sensors will vary when they are exposed to the gas to be measured. Metallic oxide materials are used as sensing element. In polymer semiconductor gas sensors, the layer phtalocyanines are used as the sensitive element which has high thermal chemical stability. It works on the principle that the layer conductivity varies with the presence of gases. In the catalytic gas sensor, because of the catalytic reactions, there is a variation in the heat energy with the exposure to the gases.
Figure 6. Classification of Gas Sensors
In the Electrochemical gas sensors, a chemical reaction takes place between the two electrodes which are made up of catalytic metals. These widely used gases sensors are classified further into potentiometric and amperometric gas sensors. The working principle involved in the optical gas sensors is the variation in the radiation characteristics like polarization, intensity when the surface is exposed to the gases. In the Gravimetric sensors, there is variation in the
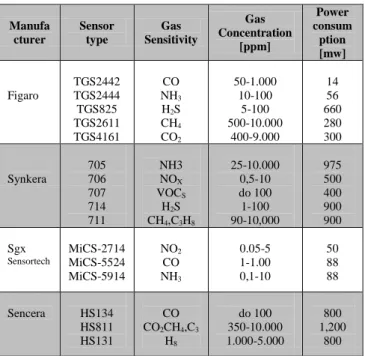
mass due to the absorption of gas molecules leading to change in the mechanical properties. In Gas sensors based on MOS- structure, the characteristics of the transition metal electrodes vary with the exposure of gas. For developing the low-cost air quality monitoring systems, metal oxide gas sensors are preferred as they have high sensitivity and fast response time. The main drawbacks of these sensors are low selectivity and more sensitive to the temperature, humidity which makes identification of gases difficult. The characteristics of metal oxide gas sensors of the various
companies are provided in Table 2.
Table 2. Characteristics of the Metal Oxide Sensors
Manufa cturer
Sensor type
Gas Sensitivity
Gas Concentration
[ppm]
Power consum ption [mw]
Figaro
TGS2442 TGS2444 TGS825 TGS2611 TGS4161
CO NH3
H2S
CH4
CO2
50-1.000 10-100
5-100 500-10.000
400-9.000
14 56 660 280 300
Synkera
705 706 707 714 711
NH3 NOX
VOCS
H2S
CH4,C3H8
25-10.000 0,5-10 do 100 1-100 90-10,000
975 500 400 900 900
Sgx
Sensortech
MiCS-2714 MiCS-5524 MiCS-5914
NO2
CO NH3
0.05-5 1-1.00 0,1-10
50 88 88
Sencera HS134
HS811 HS131
CO CO2CH4,C3
H8
do 100 350-10.000 1.000-5.000
800 1,200
800
4. Impact of air pollution on the health
Air Quality Index (AQI) is also referred as Pollutant Standard Index (PSI) or Air Pollution Index (API) gives the quality of the air in the range of 1 to 500 at a particular location.
Table 3. Air Quality Index (US Standards)
S.No Air Quality Index ( AQI) Values
Levels of Health Concern
Colors
When the AQI is in this range:
…air quality conditions are:
….as symbolized by this colour
1 0 to 50 Good
Green
2 51 to 100 Moderate
Yellow
3 101 to 150 Sensitive Groups Unhealthy for Orange
4 151 to 200 Unhealthy
Red
5 201 to 300 Very Unhealthy Purple
6 301 to 500 Hazardous Maroon
Higher the AQI value, higher the health risks. It is calculated for the primary air pollutants like Carbon monoxide, sulphur dioxide, particle matters and ozone.AQI value up to 50 is
MOS Structure
Gravimetric G
A S
S E N S O R S
Semiconductor
Catalytic
Optical
Electrochemical
Metal Oxide
Polymer
Potentiometric
considered to be good quality air and inhaling this air will not affect the public health. AQI value above 300 is deemed to be hazardous causing severe concerns on the public health. AQI value of 100 is set as a standard air quality by the Environmental Protection Agency (EPA). AQI value less than 100 is acceptable and above 100 is considered to be harmful to specific sensitive groups. AQI norms will differ for various countries and the AQI standards for the US is given in the table 3.
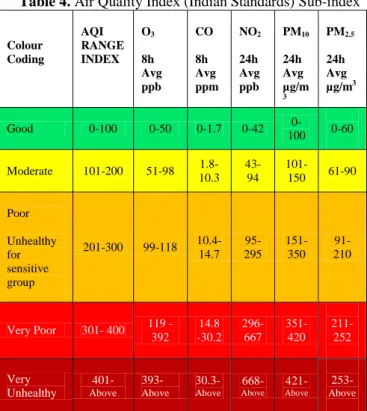
Table 4. Air Quality Index (Indian Standards) Sub-index
Colour Coding
AQI RANGE INDEX
O3
8h Avg ppb
CO
8h Avg ppm
NO2
24h Avg ppb
PM10
24h Avg µg/m
3
PM2.5
24h Avg µg/m3
Good 0-100 0-50 0-1.7 0-42
0-100 0-60
Moderate 101-200 51-98 10.3 1.8- 43-94 101-150 61-90
Poor
Unhealthy for sensitive group
201-300 99-118
10.4-14.7 95-295
151-350
91-210
Very Poor 301- 400 119
-392 14.8 -30.2
296-667
351-420
211-252
Very Unhealthy
401-Above
393-Above
30.3-Above
668-Above
421-Above
253-Above
Air Quality Index, sub-categories proposed by IITM (MoES) for the Indian standards. Each group corresponds to the various levels of health risks.
Good: Air quality is good and no health hazard when the AQI value is between 0 to 50
Moderate: Air quality is acceptable and can cause respiratory problems to those who are sensitive to ozone or particle pollutants when the AQI value is in the range of 51-100.
Unhealthy: Only Sensitive group will experience health effects when the AQI value is in the range of 101-150. Unhealthy: Every person will experience the risk of health concerns, and the sensitive group will have serious health issues when AQI is between 150 – 200.
Very Unhealthy: Poses severe health problems to all when AQI value is in the range of 201 - 300.
Hazardous: AQI values above 300 represent acute health effects; it's a health emergency condition.
Air pollution is a complex mix of various components like particulate matter (PM) , gaseous pollutants like ozone, nitrogen dioxide (NO2), carbon monoxide (CO), sulphur
dioxide (SO2) and volatile organic compounds (including
benzene). It is posing serious health concerns of respiratory diseases like asthma, chronic obstructive pulmonary disease, lung cancer and even cardiovascular diseases.Gaseous pollutant, Ozone will have a severe health impact on the
people suffering from lung disease, children and old people. Particle pollutants will have a serious health effect on the sections of people suffering from heart or lung diseases, older adults and children. It is suggested that the research should take place in this area to find the methods to reduce the air pollution levels to avoid cardiovascular diseases.
Table 5. The six standard pollutants and their health effects
S.No Pollutant Health Effects
1 Carbon
Monoxide (CO)
Reducing oxygen in the blood cells leads to decreased oxygen delivery to the body's organs and tissues. The extremely high level can cause death.
2 Nitrogen
Dioxide (NO2)
The high-risk factor for emphysema, asthma and bronchitis diseases. Aggravate existing heart disease and increase premature death.
3 Ozone (O3) Trigger chest pain, throat irritation, coughing and
congestion. Worsen bronchitis, emphysema and asthma
4
Sulphur Dioxide (SO2)
The high-risk factor of bronchoconstriction can increase asthma symptoms.
5 Particulate
Matter (PM2.5
& PM10)
Cause premature death in people with heart and lung diseases. Aggravate asthma, decrease lung function and increase respiratory symptoms like coughing and difficulty breathing.
6 Lead (Pb) Accumulate in bones and affect the nervous
system, kidney function, immune system,
reproductive systems, developmental systems and cardiovascular system. Affect oxygen capacity of blood cells.
5. Existing air pollution monitoring techniques
using Sensor networks
Based upon the carriers of the sensor nodes, the present air pollution monitoring systems are classified broadly into three categories [1].
Static Sensor Network (SSN) Community Sensor Network (CSN) Vehicle Sensor Network (VSN)
5.1 Static Sensor Network (SSN)
Low-cost sensors are deployed on fixed structures like traffic lights, street lights, walls or at meticulously planned areas as shown in Figure 4. The number of sensors used in Static Sensor Network can be increased by using low-cost sensors, and the density of the sensor nodes in Static Sensor Network is much larger than the conventional air pollution monitoring systems. Air pollution data captured by the sensor nodes can be made available to the public through various devices /platforms like internet pages, mobile and Web Apps, etc. after obtaining the authorization for the data dissemination. Advantages of Static Sensor Networks
1. No constraint on energy consumption
2. No limitation on the size and weight of sensors 3. Multiple sensors can be placed per node 4. Accurate and reliable data
5. Network connectivity guaranteed 6. Well-calibrated and maintained sensors
Disadvantages of Static Sensor Networks
2. Requires large number of sensor nodes 3. Resource wastage
4. Inconvenience in calibration and maintenance 5. Requirement of customised network
5.2 Community Sensor Network (CSN)
Low-cost portable sensors are used, and these nodes are carried by the public or the professional users usually environmental volunteers who are concerned about the quality of air as shown in Figure 5. Analysed air pollution data captured by the sensor nodes can be made available to the public through various devices /platforms like internet pages, mobile and web Apps, etc. after obtaining the authorization for the data dissemination.
Advantages of Community Sensor Networks
1. Cost efficiency 2. Public driven property 3. Mobility of sensor nodes
Disadvantages of Community Sensor Networks
1. Low data accuracy and reliability 2. Poorly calibrated and maintained sensors 3. Severe energy consumption constraints 4. Uncontrolled/semi-controlled mobility
5. Severe limitation on size and weight of sensors
5.3 Vehicle Sensor Network (VSN)
Low-cost portable sensors are used for acquiring the air pollution data in Vehicle Sensor Network (VSN) systems, typically carried by the public transportations like buses, trains, taxis as shown in Figure 6. By the mobility of vehicles, a large geographic area can be covered by the single sensor node which can achieve sufficient broad geographic coverage. Air pollution data captured by the sensor nodes can be made available to the public through various devices /platforms like internet pages, mobile and Web Apps, etc. after obtaining the authorization for the data dissemination.
Advantages of Vehicle Sensor Networks
1. Loose constraint on energy consumption 2. No limitation on size and weight of the sensors 3. Can place multiple sensors per node
4. Accurate and reliable data 5. High mobility of sensor nodes
6. Well-calibrated and maintained sensors 7. Feasibility in maintenance
Disadvantages of Vehicle Sensor Networks
1. Uncontrolled/semi-controlled mobility 2. Redundant sampling issues
3. Requirement of locating and communication devices equipment
4. Customised network requirement
Traditional and conventional air pollution monitoring systems use complex measurement techniques with sophisticated and high precision equipment with proper calibration techniques. To ensure the quality and data accuracy obtained from these systems, they are assisted by the build-in calibrator, air filtering equipment, temperature controller (cooler and heater) and relative humidity
controllers. As a result, these equipment consume high power and they are in large volumes with heavyweight and cost.Due to significant size, power limitations, high maintenance cost and high initial investment traditional Air Quality Monitoring stations are used in the limited number. Wireless Sensor Network presents an attractive and alternate solution for the large conventional air monitoring stations as we could able to deploy the sensing stations with smaller size and low-cost sensors. The sensing stations are capable of collecting and transmitting the sensed information to the other sensing stations in the network. Comparison of methods and instruments employed in the existing air quality monitoring systems are given in Table 7.
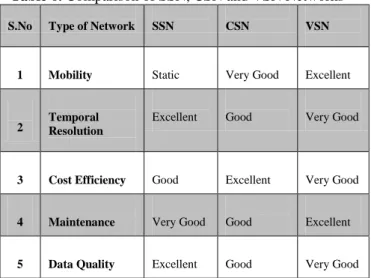
Table 6. Comparison of SSN, CSN and VSN Networks
S.No Type of Network SSN CSN VSN
1 Mobility Static Very Good Excellent
2 Temporal Resolution Excellent Good Very Good
3 Cost Efficiency Good Excellent Very Good
4 Maintenance Very Good Good Excellent
5 Data Quality Excellent Good Very Good
6.
Research challenges and future directions
Critical issues that determine the performance and design of a wireless sensor network [34] for the air pollution monitoring are as follows:Energy Efficiency: Designing the energy efficient [35] software algorithms, protocols [33] and developing the energy-efficient scalable hardware architectures are the critical challenges for the researchers in this domain. Sensors operate on the batteries and energy is consumed in data collection, data processing, and data communication and also in idle condition. Regularly batteries are needed to be replaced or recharged after they have been drained out. It is difficult sometimes to restore or replace the batteries because of demographic conditions.
Self Management: Wireless sensor networks should able to manage the network configuration, maintenance and repair by itself once deployed and function without any human intervention [36, 37].
Hardware and Software Issues: Hardware components in Sensor Networks consist of hundreds of thousands of nodes, Flash memories and FPGA-based microcontrollers which are to be inexpensive and practically economically viable. Software in WSN should be light and less energy consuming which is hardware independent [38, 39].
Quality of Service (QoS): Air pollution monitoring systems using WSNs are used in real time, and it is mandatory for the network to provide an excellent level of service QoS to its users. Unbalanced traffic, constantly changing network topology and imprecise routing affects the QoS and these issues should be addressed for improving the QoS. WSNs QoS should not be affected by adding or removing the nodes in the network [41, 42].
Security: Security of data is a relatively challenging task in WSNs as it should provide the safety of data traveling between the sensor nodes of the network or between the sensors and the base station. The sensor networks should be designed adequately with each sensor node and the base station having the capability to verify the data received from the trusted sender. A false data can change the way a network could be predicted. The integrity of data has to be maintained without any change in the data, and accurate data must reach at the user end [44, 45].
Architecture: Properly designed sensor network architecture should be employed as they will support the durability and scalability of the system without affecting the QoS [46] There is a significant need for research required in the design and development of air monitoring stations using the wireless sensor networks. Some of the future areas of research to be addressed are (i) Designing the energy efficient software protocols and developing the energy-efficient scalable hardware architectures (ii) Design of the self management systems (iii) Security and privacy (iv) Approaches for handling and utilization of the big data from numerous sensor deployed in the network. Hardware engineers should work towards designing the scalable architectures providing desirable QoS whereas software engineers should work towards developing efficient energy protocols. Wireless sensor networks present various practical issues which are needed to be addressed and feasible solutions should be evolved in building the future efficient and portable systems.
7. Conclusion
Air pollution is evolving as a severe environmental concern due to its enormous impact on the wellbeing of the people universal environment and also on the global economy. Conventional air pollution systems are not able to provide air pollution data of high spatiotemporal resolution due to non-scalability and limited data availability. Air pollution is majorly contributed by the industries and automobile vehicles. Hence there is a need to investigate and develop real-time, continuous air pollution monitoring systems of low cost and energy efficient. There is a need of proposing new methods in future to reduce Air pollution by introducing the proper controlling mechanisms.In the present review, various issues and challenges faced by the researchers during the implementation of the existing systems were presented.
References
[1] Wei Ying Yi, Kin Ming Lo, Terrence Mak, Kwong Sak Leung, Yee Leung and Mei Ling Meng " A Survey of Wireless Sensor Network Based Air Pollution Monitoring Systems," Sensors, Vol.15, pp 31392–31427, 2015.
[2] Murty R.N, Mainland G, Rose I, Chowdhury A.R, Gosain A, Bers J, Welsh M,“ City Sense: An Urban-Scale Wireless Sensor Network and Test bed," IEEE Conference on
Technologies for Homeland Security, Waltham, MA, USA, pp. 583–588, May 2008.
[3] Liu J.H, Chen Y.F, Lin T.S, Lai D.W, Wen T.H, Sun C.H, Juang J.Y,Jiang J.A, “Developed urban air quality monitoring system based on wireless sensor networks”, Fifth International Conference on Sensing Technology (ICST), Palmerston North, New Zealand, pp. 549–554, December 2011.
[4] Kadri A, Yaacoub E, Mushtaha M, Abu-Dayya, “A Wireless sensor network for real-time air pollution monitoring,"1st International Conference on Communications, Signal Processing, and their Applications (ICCSPA), Sharjah, UAE, pp. 1–5, February 2013.
[5] Mansour S, Nasser N, Karim L, Ali A, “Wireless Sensor Network-based air quality monitoring system," International Conference on Computing, Networking and Communications (ICNC), Honolulu, HI, USA, pp.545–550, February 2014. [6] Kavi K. Khedo, Rajiv Perseedoss and Avinash Mungur, "A
Wireless Sensor Network Air Pollution Monitoring System," IJWMN Journal, Vol.2, No.2, pp. 31-45, May 2010.
[7] Jelicic V, Magno M, Brunelli D, Paci G, Benini L, “Context-Adaptive Multimodal Wireless Sensor Network for Energy-Efficient Gas Monitoring," IEEE Sens.J,Vol 13,328–338, 2013.
[8] Postolache O.A, Pereira J.M.D, Girao P.M.B.S, "Smart Sensors Network for Air Quality Monitoring Applications," IEEE Trans. Instrum. Meas., vol 58, 3253–3262, 2009. [9] Hasenfratz D, Saukh O, Sturzenegger S, Thiele L,
“Participatory Air Pollution Monitoring Using Smartphones. In Mobile Sensing: From Smartphones and Wearables to Big Data”, ACM: Beijing, China, 2012
[10] Mendez D, Perez A.J, Labrador M.A, Marron J.J. P-Sense: "A participatory sensing system for air pollution monitoring and control," IEEE International Conference on Pervasive Computing and Communications Workshops (PERCOM Workshops), Seattle, WA, USA, pp. 344–347, March 2011. [11] Jiang Y, Li K,Tian L, Piedrahita R, Yun X, Mansata O, Lv Q,
Dick R.P, Hannigan M, Shang L, MAQS: “A Personalized Mobile Sensing System for Indoor Air Quality Monitoring”, International Conference on Ubiquitous Computing, Beijing, China, pp. 271–280,September 2011.
[12] Honicky R, Brewer E.A, Paulos E, White R,"N-smarts: Networked Suite of Mobile Atmospheric Real-time Sensors," 2nd ACM SIGCOMM Workshop on Networked Systems for Developing Regions, Seattle, WA, USA,pp.25–30, August 2008.
[13] Maisonneuve N, Stevens M, Niessen M.E, Hanappe P, Steels L,"Citizen Noise Pollution Monitoring,"10th Annual International Conference on Digital Government Research, Puebla, Mexico, pp. 96–103, May 2009.
[14] Tsow F, Forzani E, Rai A, Wang R, Tsui R, Mastroianni S, Knobbe C, Gandolfi A.J, Tao N.J,"A Wearable and Wireless Sensor System for Real-Time Monitoring of Toxic Environmental Volatile Organic Compounds," IEEE Sens. J. vol 9, 1734–1740, 2009.
[15] Volgyesi P, Nadas A, Koutsoukos X, Ledeczi,“ Air Quality Monitoring with SensorMap," 7th International Conference on Information Processing in Sensor Networks, St. Louis, MO, USA, pp. 529–530, April 2008.
[16] Ma Y, Richards M, Ghanem M, Guo Y, Hassard J,"Air Pollution Monitoring and Mining Based on Sensor Grid in London," Sensors, vol 8, 3601–3623, 2008.
[17] Hu S.C, Wang Y.C, Huang C.Y, Tseng Y.C,“A vehicular wireless sensor network for CO2 monitoring”, IEEE Sens.,
498–1501, 2009.
[19] Wong K.J, Chua C.C, Li Q," Environmental Monitoring Using Wireless Vehicular Sensor Networks," WiCom ’09, Beijing, China, pp. 1–4, September 2009.
[20] Lo Re G, Peri D, Vassallo S, “Urban Air Quality Monitoring Using Vehicular Sensor Networks," Advances onto the Internet of Things, Springer, pp. 311–323, 2014.
[21] Devarakonda S, Sevusu P, Liu H, Liu R, Iftode L, Nath B, "Real-time Air Quality Monitoring Through Mobile Sensing in Metropolitan Areas," 2nd ACM UrbComp ’13, Chicago, USA, pp. 15:1–15:8, August 2013.
[22] Sherin Abraham, Xinrong Li, "A Cost-Effective Wireless Sensor Network System for Indoor Air Quality Monitoring Applications," Elsevier, Science Direct, Procedia computer Science, vol 34, pp165-171,2014.
[23] J. J. Q. Yu, V. O. K. Li and A. Y. S. Lam, "Sensor deployment for air pollution monitoring using public transportation system," IEEE Congress on Evolutionary Computation, Brisbane, pp. 1-7, 2012.
[24] L. V. Shum et al., "On the Development of a Sensor Module for Real-Time Pollution Monitoring," International Conference on Information Science and Applications, Jeju Island, pp. 1-9, 2011.
[25] E. Yaacoub, A. Kadri, M. Mushtaha and A. Abu-Dayya, "Air quality monitoring and analysis in Qatar using a wireless sensor network deployment," 9th International Wireless Communications and Mobile Computing Conference (IWCMC), Sardinia, pp. 596-601, 2013.
[26] Joonhee Kang and Jin Young Kim, “Portable RF-Sensor System for the Monitoring of Air Pollution and Water Contamination,” Journal of Analytical Methods in Chemistry, vol. 2012, Article ID 568974, 5 pages, 2012.
[27] Tanuj Ahuja, Vanita Jain and Shriya Gupta “Smart Pollution Monitoring for Instituting Aware Travelling,"International Journal of Computer Applications, vol 145(9), pp 4-11, July 2016.
[28] Ruiyun Yu, Yu Yang, Leyou Yang, Guangjie Han and Oguti Ann Move, “RAQ–A Random Forest Approach for Predicting Air Quality in Urban Sensing Systems," Sensors, vol 16(86), 2016.
[29] Gyu-Sik Kim, Youn-Suk Son, Jai-Hyo Lee, In-Won Kim, Jo-Chun Kim, Joon-Tae Oh and Hiesik Kim, "Air Pollution Monitoring and Control System for Subway Stations Using Environmental Sensors," Hindawi Publishing Corporation Journal of Sensors Volume 2016, Article ID 1865614, 10 pages,2016.
[30] M. Pavani, P. T. Rao, “Monitoring Real-Time Urban Carbon Monoxide (CO) Emissions Using Wireless Sensor Networks," Information and Communication Technology for Intelligent Systems, Ahmadabad, SIST Springer, vol 84, pp.290 -297, 2017.
[31] M. Pavani and P. T. Rao, "Real time pollution monitoring using Wireless Sensor Networks," IEEE 7th Annual Information Technology, Electronics & Mobile Communication Conference (IEMCON), Vancouver, BC, pp. 1-6, 2016.
[32] M. Pavani and P. T. Rao, "End-end delay minimization using real time routing protocol for wireless sensor networks," IEEE 7th Annual Information Technology, Electronics and Mobile Communication Conference (IEMCON), Vancouver, BC, pp. 1-6, 2016.
[33] M. Pavani and P. T. Rao,"Routing Protocols in Wireless Sensor Networks: A Survey," International Journal of Computer Networking, Wireless and Mobile Communications (IJCNWMC), Vol. 6, Issue 2, pp 1-12, Apr 2016.
[34] A. Kumar, H. Kim, and G. P. Hancke, “Environmental monitoring systems: a review,” IEEE Sensors Journal, vol. 13, no. 4, pp.1329–1339, 2013.
[35] M.H. Anisi, A.H. Abdullah, and S.A. Razak, "Energy-efficient Data Collection in Wireless Sensor Networks," Wireless Sensor Networks, vol. 3, pp. 329-333, 2011.
[36] K. Sohrabi, J. Gao, V. Ailawadhi and G.J. Pottie, "Protocols for self organization of wireless sensor networks," IEEE Personal Communications, vol. 7, no. 5, pp. 16-27, 2000. [37] S. Vaidyanathan and M. Vaidyanathan, "Wireless Sensor
Networks- Issues & Challenges," Information Systems: Behavioral & Social Methods e-Journal, pp. 7, 2011.
[38] P. Zhang, M. Sadler, A. Lyon and M. Martonosi, "Hardware Design Experiences in ZebraNet," 2nd International Conf. Embedded Networked Sensor Systems (SenSys), pp. 227-238, Nov.2004.
[39] R. Sugihara and R.K.Gupta, "Programming Models for Sensor Networks: A Survey," ACM Transactions on Sensor Networks, vol. 4, no. 2, pp. 8:1-8:29, 2008.
[40] TinyOS, http://www.tinyos.net
[41] E. Troubleyn, I. Moerman and P. Demeester, "QoS Challenges in Wireless Sensor Networked Robotics," Springer Wireless Personal Communications, vol. 70, no. 3, pp. 1059-1075, June 2013.
[42] M.K. Jain, "Wireless Sensor Networks: Security Issues and Challenges," International Journal of Computer and Information Technology, vol. 2, no. 1, pp. 62-67, 2011. [43]Libelium Waspmote. Available online:
http://www.libelium.com/products/waspmote
[44]Aqeel-ur-Rehman, Sadiq Ur Rehman, Iqbal Uddin Khan, Muzaffar Moiz and Sarmad Hasan,"Security and Privacy Issues in IoT,"International Journal of Communication Networks and Information Security (IJCNIS), Vol. 8, No. 3, pp 147 - 157, December 2016.
[45] Blaise Omer Yenke, Damien Woh we Sambo, Ado Adamou Abba Ari and Abdelhak Gueroui "MMEDD: Multithreading Model for an Efficient Data Delivery in wireless sensor networks," International Journal of Communication Networks and Information Security (IJCNIS), Vol. 8, No. 3, pp 179-186, 2016.
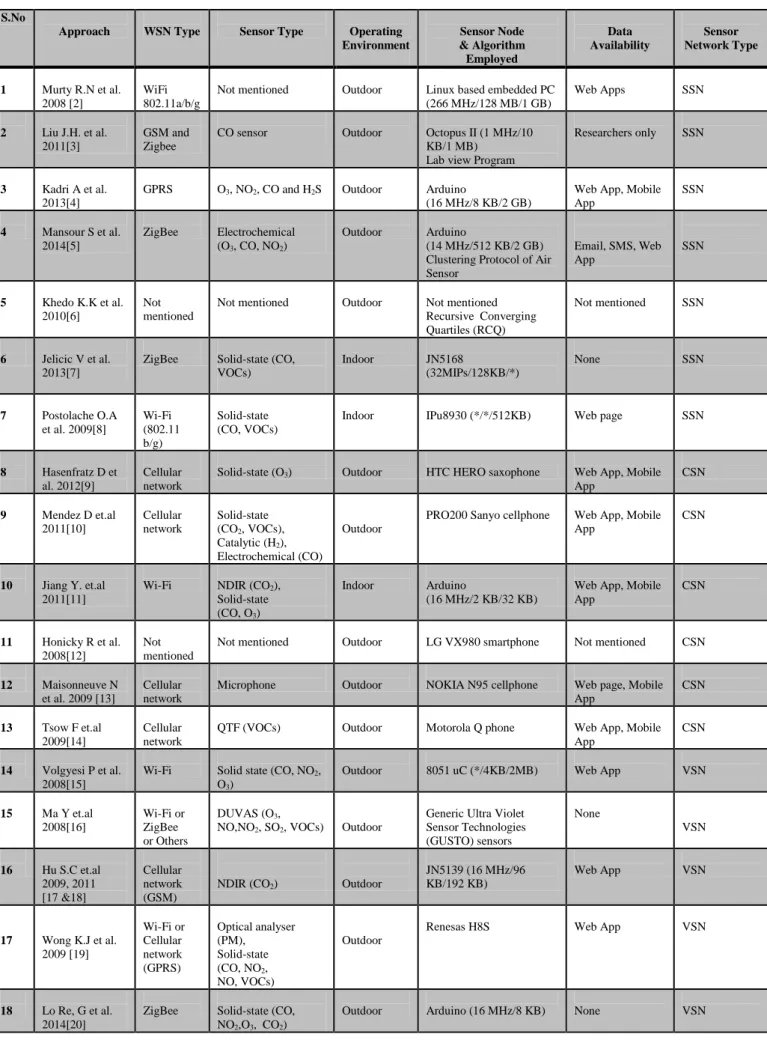
Table 1. Summary of Existing Air Pollution Monitoring Systems
S.No
Approach WSN Type Sensor Type Operating
Environment
Sensor Node & Algorithm Employed
Data Availability
Sensor Network Type
1 Murty R.N et al.
2008 [2]
WiFi 802.11a/b/g
Not mentioned Outdoor Linux based embedded PC
(266 MHz/128 MB/1 GB)
Web Apps SSN
2 Liu J.H. et al.
2011[3]
GSM and Zigbee
CO sensor Outdoor Octopus II (1 MHz/10
KB/1 MB) Lab view Program
Researchers only SSN
3 Kadri A et al.
2013[4]
GPRS O3, NO2, CO and H2S Outdoor Arduino
(16 MHz/8 KB/2 GB)
Web App, Mobile App
SSN
4 Mansour S et al.
2014[5]
ZigBee Electrochemical
(O3, CO, NO2)
Outdoor Arduino
(14 MHz/512 KB/2 GB) Clustering Protocol of Air Sensor
Email, SMS, Web App
SSN
5 Khedo K.K et al.
2010[6]
Not mentioned
Not mentioned Outdoor Not mentioned
Recursive Converging Quartiles (RCQ)
Not mentioned SSN
6 Jelicic V et al.
2013[7]
ZigBee Solid-state (CO,
VOCs)
Indoor JN5168
(32MIPs/128KB/*)
None SSN
7 Postolache O.A
et al. 2009[8]
Wi-Fi (802.11 b/g)
Solid-state (CO, VOCs)
Indoor IPu8930 (*/*/512KB) Web page SSN
8 Hasenfratz D et
al. 2012[9]
Cellular network
Solid-state (O3) Outdoor HTC HERO saxophone Web App, Mobile
App
CSN
9 Mendez D et.al
2011[10]
Cellular network
Solid-state (CO2, VOCs),
Catalytic (H2),
Electrochemical (CO)
Outdoor
PRO200 Sanyo cellphone Web App, Mobile
App
CSN
10 Jiang Y. et.al
2011[11]
Wi-Fi NDIR (CO2),
Solid-state (CO, O3)
Indoor Arduino
(16 MHz/2 KB/32 KB)
Web App, Mobile App
CSN
11 Honicky R et al.
2008[12]
Not mentioned
Not mentioned Outdoor LG VX980 smartphone Not mentioned CSN
12 Maisonneuve N
et al. 2009 [13]
Cellular network
Microphone Outdoor NOKIA N95 cellphone Web page, Mobile
App
CSN
13 Tsow F et.al
2009[14]
Cellular network
QTF (VOCs) Outdoor Motorola Q phone Web App, Mobile
App
CSN
14 Volgyesi P et al.
2008[15]
Wi-Fi Solid state (CO, NO2,
O3)
Outdoor 8051 uC (*/4KB/2MB) Web App VSN
15 Ma Y et.al
2008[16]
Wi-Fi or ZigBee or Others
DUVAS (O3,
NO,NO2, SO2, VOCs) Outdoor
Generic Ultra Violet Sensor Technologies (GUSTO) sensors
None
VSN
16 Hu S.C et.al
2009, 2011 [17 &18]
Cellular network (GSM)
NDIR (CO2) Outdoor
JN5139 (16 MHz/96 KB/192 KB)
Web App VSN
17 Wong K.J et al.
2009 [19]
Wi-Fi or Cellular network (GPRS)
Optical analyser (PM), Solid-state (CO, NO2,
NO, VOCs)
Outdoor
Renesas H8S Web App VSN
18 Lo Re, G et al.
2014[20]
ZigBee Solid-state (CO,
NO2,O3, CO2)
19 Devarakonda S et.al 2013 [21]
Cellular network Solid-state (CO),
Optical analyzer (PM)
Outdoor Arduino (16 MHz/8
KB/128 KB)
Web App VSN
20 Sherin Abraham
et al. 2014[22]
Zigbee/Wi-Fi Heating
semiconductor sensors - CO2,O3,VOC
Chemical sensors- CO2
Digital Sensors- Temperature and Humidity
Indoor Arduino (16 MHz/8
KB/128 KB)
Web App SSN
21 James J.Q.YU et
al. 2012[23]
Not mentioned Not mentioned Outdoor Not mentioned Web App VSN
22 Elias Yaacoub
et.al 2013[25]
Internet Solid state gas
sensors
Outdoor R software system Web App SSN
23 Joonhee Kang et
al. 2012 [26]
RF Solid state gas
sensors
Outdoor
MCU ATmega 128
Web App SSN
24 Tanuj Ahuja et
al. 2016[27]
Zigbee/GSM/ GPRS/ Wi-Fi/ Blue Tooth
Solid state gas sensors
Outdoor Microcontroller Web App SSN
25 Ruiyun Yu et al.
2016[28]
Not mentioned Not mentioned Outdoor Random forest method
for the air quality (RAQ)
Web App SSN
26 Gyu-Sik Kim et
al., 2016[29]
Internet Temperature,
humidity, PM10, and
CO2
Outdoor ATmega128 Web App SSN
27 Movva Pavani
et.al 2016[31]
Internet Solid state gas
sensors CO2, O2
Outdoor Libelium Waspmote
& multihop data aggregation algorithm
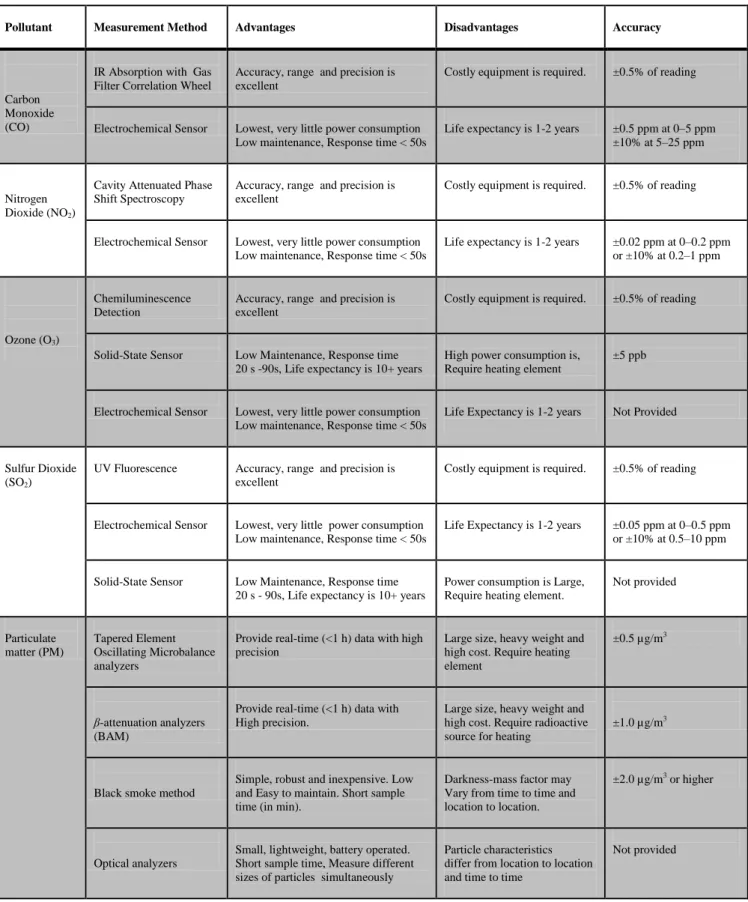
Table 7. Comparison of Methods and Instruments used in Existing Air Quality Monitoring Systems
Pollutant Measurement Method Advantages Disadvantages Accuracy
Carbon Monoxide (CO)
IR Absorption with Gas Filter Correlation Wheel
Accuracy, range and precision is excellent
Costly equipment is required. ±0.5% of reading
Electrochemical Sensor Lowest, very little power consumption
Low maintenance, Response time < 50s
Life expectancy is 1-2 years ±0.5 ppm at 0–5 ppm
±10% at 5–25 ppm
Nitrogen Dioxide (NO2)
Cavity Attenuated Phase Shift Spectroscopy
Accuracy, range and precision is excellent
Costly equipment is required. ±0.5% of reading
Electrochemical Sensor Lowest, very little power consumption
Low maintenance, Response time < 50s
Life expectancy is 1-2 years ±0.02 ppm at 0–0.2 ppm
or ±10% at 0.2–1 ppm
Ozone (O3)
Chemiluminescence Detection
Accuracy, range and precision is excellent
Costly equipment is required. ±0.5% of reading
Solid-State Sensor Low Maintenance, Response time
20 s -90s, Life expectancy is 10+ years
High power consumption is, Require heating element
±5 ppb
Electrochemical Sensor Lowest, very little power consumption
Low maintenance, Response time < 50s
Life Expectancy is 1-2 years Not Provided
Sulfur Dioxide (SO2)
UV Fluorescence Accuracy, range and precision is
excellent
Costly equipment is required. ±0.5% of reading
Electrochemical Sensor Lowest, very little power consumption
Low maintenance, Response time < 50s
Life Expectancy is 1-2 years ±0.05 ppm at 0–0.5 ppm
or ±10% at 0.5–10 ppm
Solid-State Sensor Low Maintenance, Response time
20 s - 90s, Life expectancy is 10+ years
Power consumption is Large, Require heating element.
Not provided
Particulate matter (PM)
Tapered Element Oscillating Microbalance analyzers
Provide real-time (<1 h) data with high precision
Large size, heavy weight and high cost. Require heating element
±0.5 µg/m3
β-attenuation analyzers (BAM)
Provide real-time (<1 h) data with High precision.
Large size, heavy weight and high cost. Require radioactive source for heating
±1.0 µg/m3
Black smoke method
Simple, robust and inexpensive. Low and Easy to maintain. Short sample time (in min).
Darkness-mass factor may Vary from time to time and location to location.
±2.0 µg/m3 or higher
Optical analyzers
Small, lightweight, battery operated. Short sample time, Measure different sizes of particles simultaneously
Particle characteristics differ from location to location and time to time
![Figure 3. Block diagram of the RF sensor unit.Figures are adapted from [28]](https://thumb-us.123doks.com/thumbv2/123dok_us/8124482.2154799/3.892.80.441.860.1048/figure-block-diagram-rf-sensor-unit-figures-adapted.webp)