Measuring the Effectiveness of Selectivity:
An Analysis of the MCC Foreign Aid Model
by
Jason Kajer
A Master’s Project submitted to the faculty of the University of North Carolina at Chapel Hill
in partial fulfillment of the requirements
for the degree of Master of City and Regional Planning in the Department of City and Regional Planning.
Chapel Hill
Acknowledgments
Without the support, patience, and guidance of the following people, this study would not have been completed. It is to them that I owe my greatest gratitude.
Dr. Meenu Tewari who undertook to act as my advisor, providing me with invaluable input and guidance throughout this process. Her wisdom, commitment, and critical eye have inspired and motivated me.
Dr. William Lester who took a significant amount of time to help me formulate my research question and empirical approach.
Measuring the effectiveness of selectivity: An analysis of the MCC
foreign aid model
I.
Introduction
Controversies related to the effectiveness of foreign aid have persisted for decades. One of the most controversial aspects of foreign aid is the practice of donor agencies imposing policy conditions on recipient countries. Aid conditionality – which is employed by all donor agencies, but is most often attributed to the International Monetary Fund and the World Bank – uses foreign aid as an ex-ante incentive to influence recipient governments’ macroeconomic policies. Many analysts argue that these policies have not led to economic growth, either because the countries did not implement the reforms as promised or because the donors imposed policies that were inappropriate for the countries’ economic development. Following this argument, aid reformers have advocated for more country-ownership in the process, allowing
governments to decide which policies they believe will be most effective in leading to their country-specific economic growth. Others have promoted the concept of ‘selectivity,’ whereby aid allocations are based on a country’s past commitments to a set of predetermined policies – the argument being that aid will be more effective in countries that have already adopted pro-growth policies. Finally, aid reformers contend that foreign aid is ineffective, in part, due to the allocation process which has predominately been non-transparent, subjective, and tied to national foreign policy interests.
United States implements its foreign aid policy. The organization established to manage MCA, the Millennium Challenge Corporation (MCC), has adopted a new model for aid allocation. MCC allocates aid through a selection process that measures countries’ past performance on a set of publicly accessible governance indicators that countries are able to choose from to exhibit their commitments to economic growth. In this way, the MCC model incorporates a variety of the concepts from aid reformists in its method for allocating aid, including selectivity, transparency, and county-ownership. In addition, MCC evaluates the past performance of countries relative to one another, creating a competitive arena for foreign aid allocations, and suggests that this model has the dividend of creating incentives for other countries to pursue pro-growth policies (MCC, 2011). This incentive-based outcome, whereby countries are influenced to make policy reforms in hopes of being rewarded for their efforts, has been termed the ‘MCC effect’ (MCC, 2011).
The most recent study, which focused on a single governance indicator, Control of Corruption, found that only those countries close to meeting the eligibility threshold for this indicator were induced to improve their performance (Ohler, 2010). The research postulates that countries weigh the costs associated with becoming eligible against the chances of being adequately rewarded for their efforts within a reasonable timeframe, and therefore countries starting out significantly below the thresholds choose not to compete for the funding (Ohler, 2010). Finally, Ohler (2010) found that once countries attain eligibility status, their efforts to improve performance on the Control of Corruption indicator diminish. This raises a similar concern to research evaluating traditional models that use ex-post conditionality to induce policy change, whereby countries agree to adopt certain policies, but fail to do so once they receive the aid and the incentive to reform disappears (Tendler, 1975; Svensson, 2003; Easterly, 2006). In this sense, the ex-ante conditionality model may initially be more effective at inducing policy reforms than the traditional ex-post model; however, once countries pass the “hurdles” necessary to acquire foreign aid, i.e. eligibility and recipient status, they may cease or reverse their policy reform efforts.
The literature has shown that one of the key challenges of evaluating development programs is disaggregating the complex role that incentives play. Departing from the previous studies related to the MCC model, which focused exclusively on the so-called MCC effect on countries
only the model’s effectiveness at inducing long-term adoption of these policies by eligible and recipient countries. I use a difference-in-difference time series regression model to examine the question of whether reaching the eligibility threshold or being awarded funding has an effect on how countries perform on the eligibility criteria. Specifically, I aim to answer the questions: Does country performance on policy reforms decrease after countries attain eligibility status or receive aid? And, is there a difference between how low-income countries (LICs) and lower-middle-income countries (LMICs) respond to the program overtime?
Answering these questions is vital to gaining a better understanding of the incentive structure at play within an aid allocation model based on competitive selectivity.
I find evidence that eligible and recipient countries continue to make minimal gains after becoming eligible in a number of the governance indicators; however these efforts appear to significantly diminish once countries receive aid. The general trend in indicator performance suggests that LMIC recipients continue to invest in the democratic governance indicators (e.g.
Control of Corruption and Government Effectiveness), whereas LICs shift from focusing on the social services indicators (e.g. Health Expenditures), to some of the economic governance indicators (e.g. Days to Start a Business) once they receive funding. In addition, my findings show that the indicators of Control of Corruption, Government Effectiveness, Rule of Law, Voice and Accountability, and Regulatory Policy are all highly correlated. This is consistent with previous research that shows these indicators are only measuring two dimensions of
measuring individual country improvements over a period of time in absolute terms. This would increase the proportion of competing countries, forcing continued improvement on the indicators among eligible and recipient countries, in addition to creating a more equitable aid allocation process. Finally, I suggest the democratic governance indicators be replaced with more action-oriented indicators which would be easier for poorer countries to implement.
This paper is organized as follows: Section II summarizes the debates related to foreign aid effectiveness and conditionality. It describes the MCA model and clarifies the current status of the MCC foreign assistance program. Section III discusses the findings from past empirical studies related to country performance on the MCC eligibility criteria. Section IV outlines the data I use and my research design and empirical strategy. Section V presents the results and discusses the policy implications of the findings.
II.
The Emergence of Selectivity as a New Form of Conditionality
A discussion surrounding foreign aid conditionality cannot be separated from the larger debates related to aid effectiveness. These debates have essentially resulted in impasses where
authors representing different schools of thought have taken opposing positions on the
effectiveness of foreign aid. Today, there are generally three dominant perspectives related to bilateral and multilateral aid, namely: Aid works, aid doesn’t work, and aid works under certain conditions.
They argue that foreign aid and conditions should be tailored to each specific country, and that standardized tools such as governance indexes are ethnocentric and unable to capture the complex interaction of social, political, and economic factors in countries (Sachs, 2005; Merry, 2010; Stewart, Wang, 2008). They contend that more flexibility is needed in aid programs, and that performance should be measured over longer periods of time in order to allow for more rational long-term planning of public expenditures. Proponents of this view argue that more funding is needed to scale up activities and remove the factors that cause countries to be trapped in persistent poverty (Collier, 2005; Sachs, 2005). From this perspective, the focus should not be on macro-level policies, but instead on addressing local insufficiencies such as human capital, infrastructure, environmental capital, and security (Sachs, 2005). Finally, advocates of this view argue that aid conditionality can lead to an inequitable use of resources by providing a disproportionate amount of funding to “top performing” countries, who by definition have less need than “poor performing” countries (Collier, 2005; Sachs, 2005).
their own incentive issues that prioritize disbursing funds regardless of country compliance. Conditionality models are also criticized for not encouraging the development of credible social contracts between foreign governments, due to the donor-recipient relationship that makes foreign government accountable to the multi-lateral donor agencies (Van de Walle, 2005). Finally, because the intended beneficiaries control neither the funds nor the decision-making processes involved in foreign aid programs, critics argue there can never be accountability and the level of knowledge exchange necessary for transformational development (Tendler, 1975; Easterly, 2006).
governance through selectivity, i.e. past performance on a set of predetermined criteria. Even strong critics of foreign aid have had a difficult time dismissing the relevance of selectivity, as seen with Easterly’s (2007) acknowledgement that “the idea that aid money directed to governments would be more productive if those governments had pro-development policies and institutions is very intuitive.”
In 2002, the U.S. Government announced the new MCA foreign aid program stressing that it sought to transform U.S. foreign assistance by addressing a number of the key issues raised in previous debates (Hook, 2008). Firstly, MCC employs a competitive process that rewards countries for past performance related to 16 eligibility indicators, i.e. selectivity, as opposed to the traditional model that imposes ex-ante conditions on recipient countries. Secondly, a greater degree of flexibility and country-ownership were built into the model by allowing countries to choose which policy areas they want to improve upon to show their commitment to economic growth. Flexibility and country-ownership were also incorporated into the implementation phase, whereby qualifying countries are required to design and implement their own programs with broad-based civil society involvement. Finally, transparency is
assured in aid allocation decisions by publishing country score cards on an annual basis showing the performance of all candidate countries on the eligibility indicators (Tarnoff, 2011).
1. The MCC Model
separate unit with the State Department or USAID, the Bush Administration proposed to create a new government entity to manage the initiative in 2002 (Tarnoff, 2003). MCC has a CEO, confirmed by the Senate, and a staff of no more than 300 to maintain oversight and
accountability standards (Tarnoff, 2006). A Board of Directors oversees the program, which is chaired by the Secretary of State, and composed of the Secretary of Treasury, the U.S. Trade Representative, the Administrator of USAID, the CEO of the MCC, and four public members appointed by the President of the United States (Tarnoff, 2003).
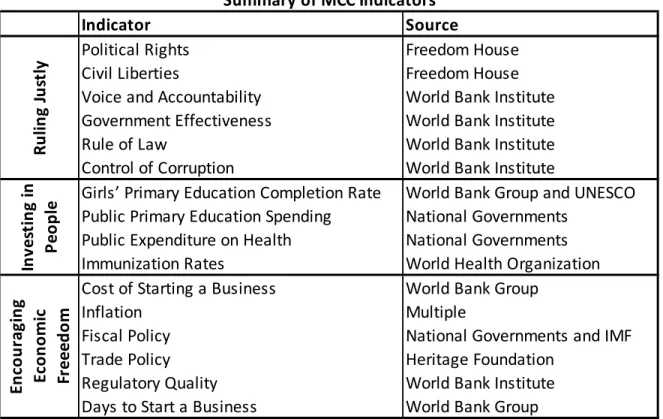
Unlike traditional mechanisms of aid allocation, which are predominately based on recipient need or donor strategic interest, MCC selects countries based on their performance on a range of third-party indicators (Table 1), grouped into three broad policy dimensions – Ruling Justly,
Investing in People, and Promoting Economic Freedom. (Johnson, 2006). Originally, there were 16 indicators in total; however, over the years new indicators have been added, bringing the current number of indicators to 20. In choosing the indicators, MCC claims to look at several elements, including linkages to policies that the government can influence within a two to three year horizon and that – theoretically or empirically – lead to economic growth and poverty reduction (MCC, 2011). The indicators originate from intergovernmental organizations and NGOs, and appear to strike a balance between conservative free-market ideals and more liberal social–development ideals (Stubbs, 2009). MCC publishes annual country “score cards”
Table 1: Summary of MCC Indicators
In order to be eligible for MCA funding, a candidate country must (1) fall within per capita income limits as identified by the World Bank’s International Development Association (IDA) for Low-Income Countries (LICs) and Lower-Middle-Income Countries (LMICs); (2) score above the median relative to other potentially eligible countries on at least half the indicators in each category; (3) score above the median on the Control of Corruption indicator; and (4) not be barred from receiving U.S. aid (MCC, 2011). All countries which meet the first and second criteria are identified as candidate countries by MCC and divided into either low-income or lower-middle-income categories. Countries which pass the minimum indicator thresholds, and
are selected as eligible countries by the MCA Board of Directors, are invited to develop and submit a proposal for an economic development program. The proposed programs can focus
Indicator Source
Political Rights Freedom House
Civil Liberties Freedom House
Voice and Accountability World Bank Institute
Government Effectiveness World Bank Institute
Rule of Law World Bank Institute
Control of Corruption World Bank Institute
Girls’ Primary Education Completion Rate World Bank Group and UNESCO Public Primary Education Spending National Governments
Public Expenditure on Health National Governments
Immunization Rates World Health Organization
Cost of Starting a Business World Bank Group
Inflation Multiple
Fiscal Policy National Governments and IMF
Trade Policy Heritage Foundation
Regulatory Quality World Bank Institute
Days to Start a Business World Bank Group
Ru lin g Ju st ly In ve st in g in P eo p le En co u ra gi n g Ec o n o mi c Fr ee ed o m
on any development need as identified by an eligible government, but must aim to reduce poverty as the ultimate goal.
There are two primary types of MCC grants:
Compact Grants: These are large, five-year grants for countries that pass MCC’s
eligibility criteria, ranging from roughly $100 - $700 million.
Threshold Programs: These are smaller grants awarded to countries that come close to
passing the criteria, ranging from $5 - $60 million. These grants are provided solely at the discretion of the MCC (MCC, 2011).
If a country that has received assistance does not meet the eligibility criteria in a given year, but has not demonstrated a policy reversal or a pattern of actions inconsistent with the eligibility criteria, MCC will ask it to demonstrate efforts toward improvement by developing and implementing a policy improvement plan to address the areas of concern (MCC, 2011). If a country does demonstrate a significant policy reversal, MCC may issue a warning, then suspend it from the program, or terminate its eligibility or aid package (MCC, 2011). MCC has
suspended assistance to six countries due to policy reversals (Tarnoff, 2011).
As of May, 2011, MCC had awarded 22 compacts (valuing roughly $7.9 billion) and 23 threshold programs (valuing roughly $500 million). In 2011, MCC announced it would allow eligible countries to submit a proposal for a second Compact Grant once they have completed the first program successfully.
allocation model, but has added a number of additional characteristics that make it distinct from more traditional foreign aid models. Some of the key distinctions include transparency in its country performance evaluation method, a greater commitment to country-ownership, and flexibility in policy reforms and program design and implementation. However, the new model has yet to be tested over time to measure its effectiveness in promoting long-term policy reforms.
III.
Past Empirical Studies
Ohler’s (2010) study looked at country performance related only to the indicator on corruption, but took a more in-depth assessment at whether the incentive to reform weakens over time and whether higher costs of compliance undermine the MCC effect. Using data through 2008, Ohler (2010) found that countries with unfavorable initial conditions were unlikely to respond to the MCC effect due to the remote chance of being compensated for their efforts. She also found that MCC was successful in improving corruption immediately after the announcement of the program, but that this effect diminished over time. She explained these findings as a result of the slow operational start of MCC and the organization’s declining budget allocations from Congress which increased the uncertainty of receiving a large enough reward in an acceptable timeframe given the candidate’s costs of eligibility compliance.
Ohler (2010) looked to literature on the EU to find lessons related to ex-post conditionality as associated with candidature for EU membership. She presents some interesting hypotheses that have relevance in the context of the MCA foreign aid model. One of the suspected effects of ex-post aid is that once the country is rewarded, policy reforms may cease or even be
reversed, as was seen in the case of various European countries (e.g. Italy, Greece, Portugal, Poland, and Slovakia), as well as with numerous recipients of traditional structural adjustment lending from the IMF and World Bank (Easterly, 2006; Ohler, 2010).
some evidence that countries may cease or even retract their reform efforts. According to Mosley et al. (2004), selectivity may provide incentives to improve policies prior to receiving aid, but recipients would still have the option to reverse reforms after having been selected by donors. This paper attempts to test this assumption, through an empirical analysis, by
measuring the effectiveness of the MCC model in influencing long-term policy reforms in recipient countries using the MCC model.
IV.
Data and Empirical Strategy
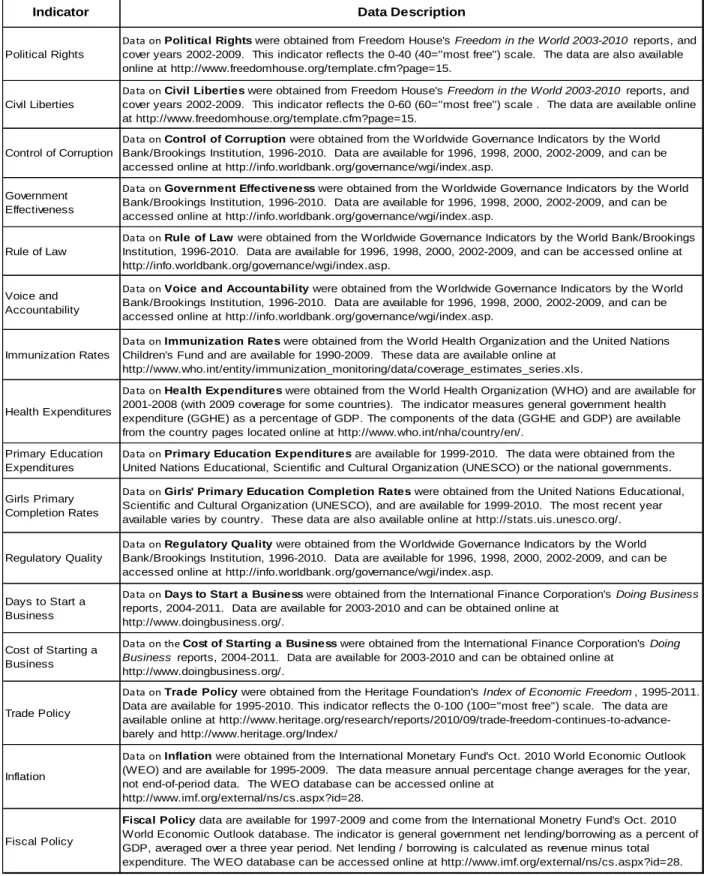
Based on the previous empirical research specific to MCC and the criticisms related to foreign aid effectiveness, my study aims to answer the question: Does country performance on policy reforms decrease after countries attain eligibility status or receive aid? Although there have been a number of changes to the eligibility criteria over the years, MCC originally used 16 indicators drawn from a number of independent sources. The indicators are broken up in to three categories, namely: Ruling Justly, Investing in People, and Promoting Economic Freedom. Table 1 provides a detailed description of the indicators and their sources. Table 2 summarizes the units used in the indicators and the direction change associated with an increase in
performance.
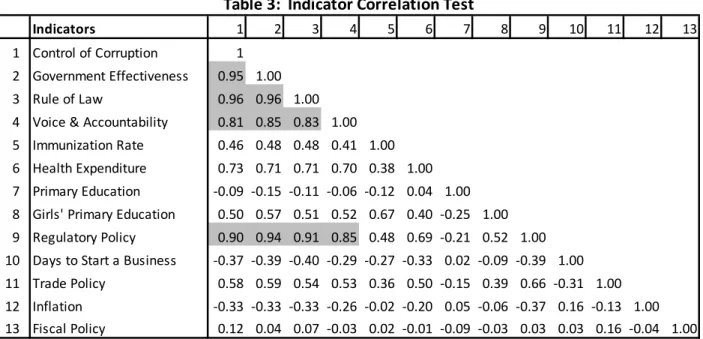
I provide a correlation test, found in Table 3, which shows all of the Ruling Justly indicators of
Control of Corruption, Government Effectiveness, Rule of Law, and Voice and Accountability are closely correlated to one another. In addition, the Promoting Economic Freedom indicator of
dimension of governance’ and the perceived ‘overall quality of governance,’ are captured in the
Ruling Justly indicators and the Regulatory Quality indicator. Although this study does not aim to measure appropriateness of the indicators, it is worth noting this high correlation, which suggests similar elements are being captured in these indicators. An example of this would be a government’s anti-corruption actions within a service sector could increase the Control of Corruption score, as well as the Government Effectiveness, Voice and Accountability, and
Regulatory Policy score. Therefore, this should not take away from my ability to measure the effect of eligibility or receiving aid on these indicators. However, it will be difficult to discern which dimensions, and therefore which policies, led to this change.
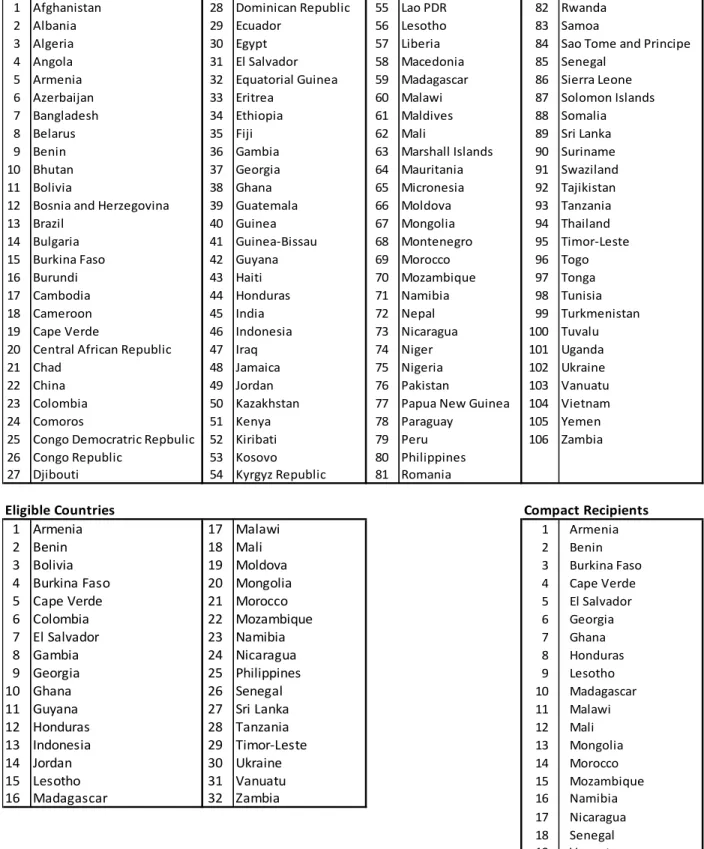
The main dataset used in my study consists of the thirteen indicators as well as country income data from the World Bank to identify country income categories1. The data set covers years 2000-2009. Table 4 provides the list of countries included in this analysis. Over this period of time, there were a total of 106 candidate countries, belonging to both the low-income and lower-middle-income categories, of which 32 were deemed eligible for funding. Of the eligible countries, 19 received MCC Compact grants.
In order to address my research question empirically, I will use the difference-in-difference (DD) method, which has become widely used in variety of areas of empirical microeconomics (Card, 2005). The impact of a policy on an outcome can be estimated by calculating a double
difference, one over time (before-after) and one across subjects (between recipients and non-recipients). This method is particularly useful with country-level analyses, as it only requires
1
aggregate data on the outcome variable (Card, 2005). Using this method, the 13 indicators listed in Table 2 are observed for all candidate countries; however some of these countries are exposed to a treatment during this period (2000-2009) consisting of either attaining eligibility status or receiving MCC funding. All other countries candidate countries represent the control group. The average gain in the control group is subtracted from the average gain in the
treatment group. This removes the biases in the post-treatment period between the treatment and control group that could be the result of permanent differences between those groups, as well as biases from comparisons over time in the treatment group that could be the result of country-specific trends. The average treatment effect can be calculated as the difference between two mean differences. Assuming the outcome is the indicator level, and suppressing any notation for the country, I can write the DD estimator as:
[(
) (
)]
Where E is the expectation, is the score of indicator j, {T,C} are the treatment and control
grants2. Lastly, I use the same DD estimator to test whether this model provides similar results to the previous empirical studies in order to ensure its overall reliability.
V.
Results and Findings
1.
Effect of Eligibility Status on Country Performance
My first estimation assumes, as is in line with the reasoning from Section II, that countries which become eligible cease to make significant continued progress on the indicators. The underlying argument is that the incentive to continue to invest in the indicators is diminished once the countries pass this first "hurdle" and are deemed eligible. Based on the MCC model, eligible countries must continue to stay above the median on at least 50% of the indicators, in addition to the control of corruption indicator, though no additional improvement is required.
To test this hypothesis, I included all candidate and non-candidate countries within the low-income and lower-middle-low-income categories in the analysis. Countries which have been deemed eligible by meeting the required eligibility criteria represent the treatment groups, separated into LICs and LMICs, and all other candidate countries represent the control. The empirical model is presented below:
(
)
Where: is the expected outcome; is 0 for control countries and 1 or
treatment countries; is the year fixed effect; is the country fixed effect;and
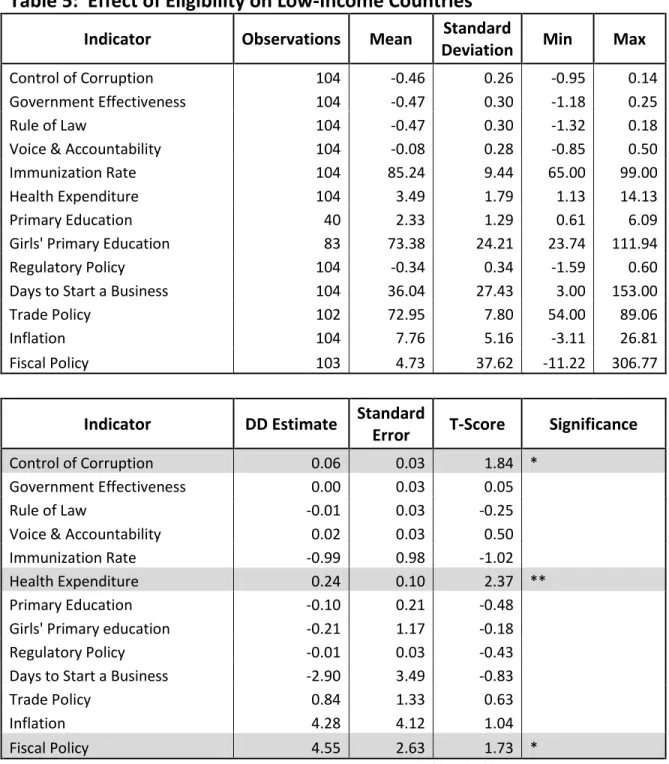
represents the error term. The results of these analyses are reported in Table 5 and Table 6.
2
The DD estimates provide evidence that MCC eligibility has a number of long-term effects related to specific governance indicators:
1. Control of Corruption: I begin by reporting my findings on the indicator relating to controlling corruption. This indicator measures the extent to which public power is exercised for private gain, as well as the dominance of the state by elites and private interests, through a number of public perception surveys (MCC, 2011). I found that countries that become eligible for MCC funding continue to make progress on the Control of Corruption indicator after they become eligible. The Control of Corruption index score has a range between -2.5 to 2.5. Among LICs, the Control of Corruption score increased by 0.06 points at a ten percent significance level. Among LMICs, the score increased by a more substantial 0.20 points at a one percent
significance level. In other words, LMICs increase their score more than three times the level of LICs after becoming eligible for MCC funding. This finding is particularly important when
considering that the mean score for the Control of Corruption indicator among LMICs is only 0.12.
indicator. These programs require significant policy reforms in a variety of areas, including tax and customs administration, public procurement, the judicial system, and related capacity-building investments in the relevant public institutions (MCC, 2011). Budgets for these MCC Threshold programs range from $12 million to over $30 million (MCC, 2011). Faced with the high political and financial costs required for effective anti-corruption programs, poorer governments may choose to invest in more concrete programs that are easier to implement and have greater pay-offs in the short-run.
2. Health Expenditures: This indicator measures the government’s commitment to investing in the health and well-being of its people by measuring the percent of GDP being allocated to public health expenditures. My findings show health expenditures among LICs are positively affected by MCC eligibility. LICs show an increase of 0.24 percent of GDP at a five percent significance level. This represents a 7 percent increase above the LIC mean for this indicator score, representing a significant advancement.
This finding of eligible LICs increasing their performance on public health expenditures is consistent with the previous empirical research, which found LICs near the eligibility threshold tended to focus on improving their performance on the social indicators in order to become eligible. My finding shows that LICs continue to increase health expenditures even after they become eligible, which cannot be easily explained by the incentive effects of the MCC program, as eligible countries only stay above the median relative to other countries in their same
order to stay above the median. In 2009, 14 of the 19 eligible LICs were all above the median on this indicator, suggesting the large majority of them are focusing heavily on health
expenditures. It is understandable that LICs would focus on health expenditures as a way to meet one of the 16 eligibility criteria as they can easily increase their performance on this indicator by simply diverting funds from other government programs into health. In general, LICs already have the policies in place and the institutional structures to absorb health funding, unlike some of the other indicators that may require the adoption of new polices and the creation of new structures, such as Control of Corruption. Additionally, it is unlikely that increasing health budgets will be met with political resistance in the country due to the high level of populist appeal and likely support from other bilateral and multilateral donors. Therefore, for poor countries, increasing health budgets continues to be an easy way to both improve indicator scores while meeting their political objectives.
3. Primary Education Expenditures: This indicator measures government primary education expenditures as a percentage of GDP. I found that expenditures on primary
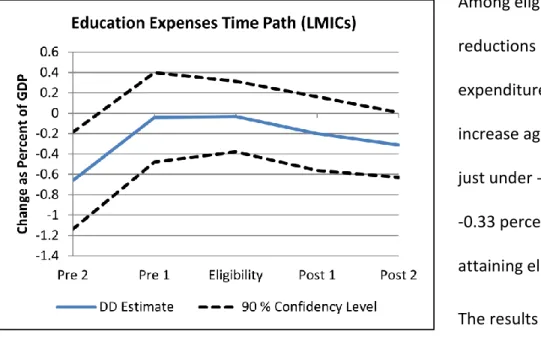
education did not significantly change among LICs; however, among LMICs the percent of GDP going towards primary education expenditures decreased by 0.27 percent after they became eligible, at a ten percent significance level.
becoming eligible for MCC funding, the annual changes in the percent of GDP being allocated for primary education expenditures was negative, going from a -0.65 percent decrease two years before becoming eligible, to roughly a -0.03 percent decrease the year before becoming eligible. Although still a negative annual change, this represents a smaller reduction in
education expenditures as a percentage of GDP in the two years prior to becoming eligible. Among eligible LMICs, reductions in education expenditures began to increase again, going from just under -0.03 percent to -0.33 percent two years after attaining eligibility status.
The results suggest, firstly, that eligible LMICs were decreasing the percentage of GDP allocated to primary education both before and after attaining eligibility status. However, when we look at trends just prior to becoming eligible, LMICs made improvement on this indicator as seen by the reduction in education expenditures as a percent of GDP significantly decreasing prior to the countries attaining eligibility status. Once the countries attained eligibility status, annual reductions in education expenditures as a percent of GDP began to increase again.
It should be noted, that of all the indicators being measured, the Primary Education
expenditures have the greatest amount of missing data, which maybe resulting in unreliable results for this analysis. However, of the data that is available, there is a clear trend of decreasing education budgets as a percent of GDP. One explanation is that GDP growth throughout this period may have had a negative impact on country performance on this indicator, if education expenditures did not increase relative to GDP growth.
A second explanation for this effect of eligibility could be that LMICs strategically put more resources into primary education prior to eligibility in order to increase their chances of passing the eligibility hurdle. Then, LMICs began investing less in this area once they were able to measure their relative performance among competing countries and determined they could reduce investments in primary education, presumably to invest in other areas. In this sense, countries can use the information related to the performance of their competition on the eligibility criteria, acquired through the annual scorecards, to make strategic decisions and improve their relative position. Instead of continuing to invest in an area which they are already over-performing on compared to their competition, they can divert these funds to programs aimed at improving their performance on other indicators.
hurdle, and this is seen at a one percent significance level. This represents a considerable improvement, as the range for this indicator among all LMICs is between 12 and 52 days.
This result shows that reaching eligibility status among LMICs has a considerable effect on decreasing the number of days required to start a business. There have been a number of anecdotal stories that show the effects of eligible country efforts to reduce this figure, usually through initiatives to streamline procedures, remove unnecessary administrative steps, and establish one-stop offices to that provide assistance to entrepreneurs in setting up their businesses (MCC, 2011). Some examples of these include Albania that reduced the average number of days to start a business from 41 in 2003 to five in 2009, and Cape Verde which decreased its average start-up time from 52 days in 2005 to an astonishing one hour in 2010 (MCC, 2011). The large improvement in this indicator among eligible LMICs, suggests these countries are able to affect this indicator in fairly short period of time, and that they are able to get resounding support on a political level. This is a significant effect of MCC eligibility when considering the long-term economic growth benefits of this indicator, and significance in reducing corruption due to restrictive administrative procedures related to starting a business (Madani, 2010).
5. Fiscal Policy: This indicator gauges the government’s commitment to prudent fiscal management and private sector growth by measuring general government net
LMICs, but among LICs there was an increase in 4.55 percent of GDP at a ten percent significance level.
6. Government Effectiveness: This indicator measures the quality of public services, the quality of the civil service and its independence from political pressures, the quality of policy formulation and implementation, and the credibility of the government’s commitment to its stated policies (MCC, 2011). The indicator is an index score ranging -2.5 to 2.5 by combining up to 14 different assessments and surveys (MCC, 2011). Eligible LMICs slightly increased their performance on the Government Effectiveness indicator by 0.09, with a significance level of ten percent. Considering the mean for LMICs is -0.07, this still represents substantial improvement.
7. Regulatory Policy: This indicator measures the ability of the government to formulate and implement sound policies and regulations that permit and promote private sector
development (MCC, 2011). The indicator is an index score ranging -2.5 to 2.5 by combining up to 14 different assessments and surveys (MCC, 2011). There was an increase of 0.10 on the
Regulatory Policy indicator at a ten percent significance level. Considering the range of scores among LMICs is between -0.66 and 0.42, this represents a substantial improvement.
As noted in Section IV, Regulatory Policy is strongly correlated to the Ruling Justly indicators of
Control of Corruption, Government Effectiveness, Rule of Law, and Voice and Accountability, as shown in Table 3, which are also measured in a similar fashion using a compilation of
perception-based surveys. Previous empirical research suggests that these indicators are only measuring two dimensions of democratic governance, i.e. ‘participatory dimension of
the dimensions of democratic governance being measured or related policies by countries that have resulted in an increased score.
To summarize, there were some distinct differences between how the LICs and LMICs responded to the MCC model after becoming eligible. LICs showed statistically significant improvement in the areas of Control of Corruption, Health Expenditures, and Fiscal Policy. LMICs also improved their scores in the area of Control of Corruption, but in addition had significant improvement with the indicators related to Government Effectiveness, Regulatory Policy, and Days to Start a Business. Both categories of countries showed a reduction in the percentage of GDP being allocated for Primary Education expenditures.
2.
Effect of Receiving Funding on Country Performance
To test this hypothesis, I included all candidate and non-candidate countries within the low-income and lower-middle-low-income categories in the analysis. Countries which have received aid (i.e. an MCC Compact) represent the treatment groups, separated into LICs and LMICs, and all other countries represent the control. The empirical model is presented below:
(
)
Where is the expected outcome; is 0 for control countries and 1 for treatment
countries; is the year fixed effect; is the country fixed effect; and represents the error
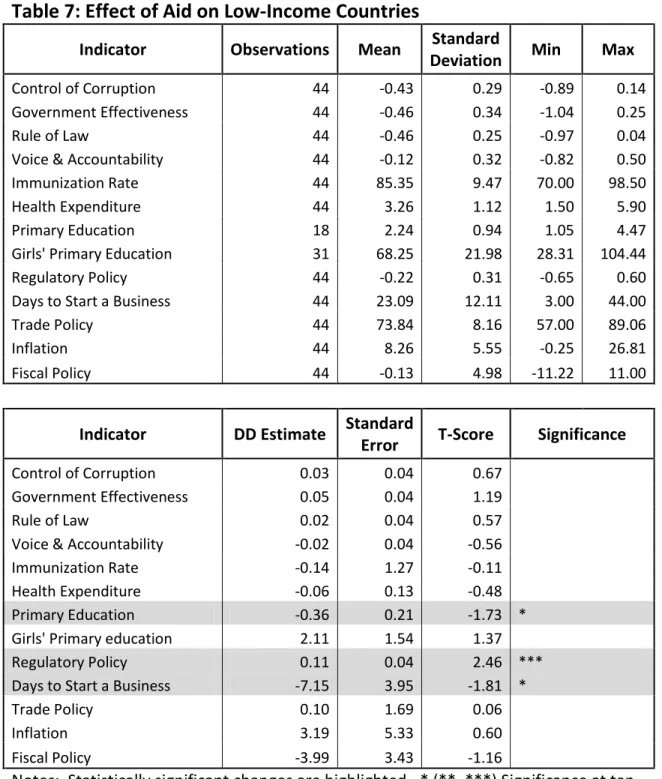
term. Table 7 and Table 8 show the results for this analysis.
1. Control of Corruption: I begin by reporting my findings on the indicator relating to controlling corruption. This indicator measures the extent to which public power is exercised for private gain, as well as the dominance of the state by elites and private interests, through a number of public perception surveys (MCC, 2011). For this indicator, there was no significant change among LICs; however, LMIC aid recipients increased their Control of Corruption score by 0.34 at a one percent significance level. This is very substantial when considering the range for this treatment group is only between -0.36 and 0.77.
These results are consistent with my findings related to eligible countries, where LICs showed substantially less improvement than LMICs on the Control of Corruption indicator. This suggests that once LICs become aid recipients, they no longer continue to make efforts in this area,
other priority areas. LMICs, on the other hand, show continued improvement in this area, which shows a distinction between how the two country groups respond to the MCC program over time. Perhaps, for LMICs, continuous investment in anti-corruption programs is more feasible given their higher income levels. This could potentially be explained by LMICs having more to gain from anti-corruption efforts by way of increased investments by private sector firms, whom may not be as interested to invest in poorer countries due to a variety of factors (e.g. poor infrastructure, weaker labor force, and political instability). LMICs may also have more political latitude to continue to invest in the more ambiguous Ruling Justly indicators, because the quality of their social services, represented in the Investing in People category, has reached a high enough level. My assumption is that once countries reach a high enough level related to government social services, such as health and education, they are more willing to invest in the more ambiguous Ruling Justly indicators.
aid. However, due to the high correlation between the Ruling Justly indictors and this indicator of Government Effectiveness, it is impossible to ascertain what specific actions by the
government lead to changes in these indicators.
3. Primary Education Expenditures: This indicator measures government primary education expenditures as a percentage of GDP. I found a similar reduction in Primary Education expenditures for both LICs and LMICs. LIC recipients decreased their spending in primary education by 0.36 percent of their GDP after receiving funding, at a significance level of ten percent. Similarly, LMIC recipients decreased their budgets by 0.45 percent of their GDP after receiving funding with a significance level of one percent.
These results further support the findings from the first analysis related to the effect of
measure the relationship between annual GDP variations and performance on Primary Education expenditures.
Another explanation for the effect of aid recipient status on primary education expenditures could be that LICs and LMICs have chosen to shift resources out of primary education to invest in areas where they needed to make greater improvement. This strategic behavior of countries is supported by the finding from my first analysis related to LMICs, which shows education expenditures as a percent of GDP increased drastically just prior to eligibility, and then began to decrease again after the countries passed the eligibility hurdle. Countries are able to gauge their relative performance on each indicator compared to their competition using the annual score cards, which may lend to this type of strategic behavior by governments in order to increase their standing among recipient countries.
4. Regulatory Policy: This indicator measures the ability of the government to formulate and implement sound policies and regulations that permit and promote private sector
development (MCC, 2011). The indicator is an index score ranging -2.5 to 2.5 by combining up to 14 different assessments and surveys (MCC, 2011). I found that LICs showed a 0.11 increase in score in this area, at a significance level of one percent. Additionally, LMICs showed a similar 0.11 percent increase, however the significance level was just over the ten percent cutoff. As noted in Section IV, Regulatory Policy is strongly correlated to the Ruling Justly indicators of
Control of Corruption, Government Effectiveness, Rule of Law, and Voice and Accountability, as shown in Table 3, which are also measured in a similar fashion using a compilation of
measuring two dimensions of democratic governance, i.e. ‘participatory dimension of
governance’ and the perceived ‘overall quality of governance,’ (Knoll, 2006). Therefore, with the Ruling Justly indicators, as well as the indicator related to Regulatory Policy, it is difficult to ascertain the dimensions of democratic governance being measured or related policies by countries that have led to improvement in this area.
5. Days to Start a Business: This indicator measures the number of calendar days it takes to comply with all procedures that are officially required for an entrepreneur to start up and formally operate an industrial or commercial business (MCC, 2011). Among aid-recipient LICs, the number of days required to start a business was reduced by 7.15 (representing an
improvement), at a ten percent significance level. I did not find a statistically significant finding for LMIC recipients related to this indicator.
recipients have included this policy reform as part of their MCC Compact activities, (e.g. Cape Verde), therefore directly linking improvement on this indicator to MCC aid. LMICs, which presumably have more flexibility in the indicators they address prior to receiving aid, may be more inclined to tackle this indicator due to their higher levels of income. Additionally, LMICs potentially have greater short-term gains from improving the business environment if there is significant private sector interest and growth in their countries. Finally, as mentioned in my first analysis, the large improvement in this indicator among eligible LMICs, suggests these countries are able to affect this indicator in fairly short period of time and gain political support for these efforts, which may not be the case for LICs due to institutional and financial
constraints related to administrative reform relative to more pressing social concerns.
To summarize, there were distinct differences between how the LICs and LMICs responded to the MCC model after receiving aid. LMICs showed continued improvement in the Ruling Justly
indicators of Control of Corruption and to a small extent Government Effectiveness. LICs
from improving on four indicators within the Ruling Justly and Promoting Economic Freedom
categories during eligibility, to only making improvement on the Control of Corruption and to a small extent Government Effectiveness. Furthermore, as noted within this analysis and
consistent with previous empirical research related to the Ruling Justly indicators, it is possible that these two indicators are measuring the same government policies due to the high
correlation between the Ruling Justly indicators.
3.
Effect of the Announcement of MCC Program on Country Performance
My final analysis is conducted to test whether my regression model will render similar results to the previous studies related to the MCC effect, as measured by the change in country
performance on the indicators before and after the announcement of MCC in late 2002. This is important as the results from this analysis show some differences in how countries perform on the indicators after they become eligible or receive aid compared to the previous studies that looking at how they performed after the announcement of MCC, irrespective of their eligibility or recipient status. The previous studies, which only looked at LICs, showed these countries focused heavily on the social indicators within the Investing in People category after the announcement of MCC as a strategy to become eligible in a short period of time. The assumption is that because a number of the social indicators are measured by government spending in health and education, immediate changes in budget allocations can allow poor countries to quickly improve performance.
LICs would have been incentivized to increase performance on the published eligibility criteria in order to become eligible for MCC funding. The empirical model is presented below:
(
)
Where is the expected outcome; is 0 for years 2000 – 2002 (i.e.
before the announcement of the MCA program), and 1 for years 2003 – 2009 (i.e. after the announcement of the MCA program); is the year fixed effect; is the country fixed effect;
and represents the error term.
My results, as presented in Table 9, capture an incentive effect across a range of indicators, but most certainly provide similar findings to the previous studies. There is a slight increase in the
Voice & Accountability score among low-income countries after the announcement of MCC, however the actual DD estimate is quite small, at .05 and ten percent significance level. For the
Investing in People indicators, Immunization Rates, Health Expenditures, and Girls’ Primary Education all show substantial improvements at a one percent significance level. National immunization rates increased by 11.1 percent, public health expenditures by .49 percent of GDP, and the percent of females completing primary education increased by 18.4 percent. These findings are consistent with the previous empirical studies. Improvement was also seen with the Trade Policy indicator, which measures a country’s openness to international trade based on average tariff rates and non-tariff barriers to trade. This score increased by 4.6 points
out of 100 at a one percent significance level. Finally, improvement was seen with the Inflation
It should also be noted that another potential reason countries tended to focus on the social indicators is because prior to the MCC announcement, accurate data may not have been collected regularly on these indicators. An example of this was seen in Madagascar where performance on Health Expenditures was increased by simply collecting data on local and regional government health budgets that had not previously been included in this figure. Similar anecdotal evidence exists for Primary Education expenditures and Girls’ Primary Education completion rates.
VI.
Discussion
from to demonstrate their commitment to economic development by passing the median on 50 percent of the indicators, in addition to the Control of Corruption indicator. This new foreign aid model has made some significant changes to how aid is allocated, and by doing so has altered the traditional donor-recipient relationship. This new relationship allows for increased autonomy in policy decisions by the recipient countries, and allows them to design and
implement their own programs in accordance with their country-specific development plans. However, little is known about the long term effectiveness in influencing country policies of a foreign aid model based on selectivity.
My study found some general trends among eligible and recipient countries, as well as
differences between LICs and LMICs, and offers insight into the incentive effects occurring in a selectivity-based foreign aid model. Firstly, the model seems to be effective in encouraging a minimal level of performance on the Control of Corruption indicator, which is the one indicator that is required by all countries to become eligible and receive funding. However, LICs tend to reduce their effort in this area after becoming eligible, and even more so after receiving aid, and instead choose to focus their efforts on more tangible indicators such as Health
Expenditures or Days to Start a Business. LMICs on the other hand, focus almost exclusively on the Control of Corruption and Government Effectiveness indicators once they receive funding. Lastly, both country income groups appear to be decreasing their overall efforts on the
model’s indicators. Below I present some recommendations to address these potential weaknesses.
My results show that although there are no major reversals in country performance related to the indicators, their progress appears to wane significantly after receiving aid to the point that statistically significant and substantial increases are only seen in the Control of Corruption
below along with recommendations to addressing them in a manner consistent with the MCC philosophy of selectivity, transparency, and country ownership.
Firstly, the model is based on countries competing amongst one another for MCC funding, and funding levels have decreased significantly from their original projections (Stubbs, 2009). The fact that only countries near the eligibility threshold are induced to improve their performance means the actual group of countries competing for the funding could potentially be quite small (Ohler, 2010). The incentive structure in place through this model is quite complex. Even though it uses medians instead of averages to theoretically pull in a larger pool of countries, eligible countries must pass on 50 percent of the indicators at one time, in addition to the
Control of Corruption indicator. This may be quite difficult for a large number of countries. Coupled with the awareness that the MCC budget is significantly smaller than originally announced in 2002, an even greater number of countries are less likely to compete as the eligibility or compliance cost of investing in the key policy areas outweighs the chances of receiving an adequate aid award in a politically feasible time period (Ohler, 2010). The
consequence of the above mentioned factors is a dynamic model where a fairly small group of top-performing countries, presently at 32 out of 106, will be able to pass on enough indictors to become eligible. This will subsequently result in a relatively low level of competition among the eligible and recipient countries to continuously improve their performance, as seen through the results in this analysis.
is that the same countries are routinely eligible for MCA funding, whereas others will never be able to pass the first hurdle of eligibility. This can be seen by MCC’s recent announcement in 2010 that it will allow second Compact Grants, the first of which is going to Cape Verde, while a number of other Compact Grants are going to countries which previously received Threshold programs. My hypothesis is this decision by MCC was made out of necessity as the organization predicted that the pool of eligible countries may be stabilizing at around the current number. This raises serious concerns related to the equitability of this model as well as its long-term justification. Organizations that select recipients who will most likely benefit from their programs based on need, will maximize the social return of the investment (Bell, 2002). Conversely, using a creaming method, such as selectivity, may lead to little or no substantial social benefit as the recipients are already likely to experience the highest outcomes in the absence of the program (Bell, 2002). For this reason, the MCC model should be refined to strengthen the incentive effects for countries where starting conditions are more unfavorable, as this will allow for the greatest social benefit from the U.S. government’s investments.
awarded to countries close to reaching eligibility status at the full discretion of the MCC Board, and could lead to allocation decisions based U.S. foreign policy interests as opposed to country performance. These two measures will increase the MCC budget by 35 percent for the
remaining estimated 75 countries in the low-income category. This will significantly increase the incentive power of the program to pull in a larger pool of countries to compete through policy improvements.
To further address the small competitive pool and equity issues, I recommend two options. The first, which would be easier from an institutional standpoint as it requires less of MCC’s
resources, would be to allocate funding on a regional basis, e.g. Latin America, Africa, Eastern Europe, and Asia. This will create an added inducement for countries with unfavorable starting conditions to strive to catch up with their neighboring countries, as the likelihood of being rewarded for their efforts will increase due to the smaller number of competing countries with arguably similar constraints to growth. The second option would be to design eligibility
thresholds relative to each country’s performance, i.e. measuring composite improvements of scores in absolute terms over a period of time (e.g. 2-3 years). Those that show the greatest overall improvement, measured by an aggregate score, would be eligible for funding. This would create a highly equitable model that would entice all countries, regardless of their initial standing, to compete for the funds.
support this as shown with the high correlation between them. More importantly, my findings suggest LICs are not focusing on the democratic governance indicators, perhaps because they have more pressing needs, or because these indicators are too ambiguous and potentially represent a risky investment by poorer governments. Therefore, I recommend that MCC attempt to find more actionable governance indicators, geared towards LICs, which would allow them to see how a specific investment of their limited resources would result in an improved standing.
I conclude by stressing that the MCC model, which uses competitive selectivity and promotes the principles of transparency, country-ownership, and flexibility, offers promise over the traditional ex-post conditionality model. My study suggests that the model is effective at inducing continued policy improvements among eligible countries and to a lesser extent recipient countries. Refinements to the model should be made in order to raise the
1.
References:
Ashenfelter, Orley and David Card. “Using the Longitudinal Structure of Earnings to Estimate the Effect of Training Programs.” The Review of Economics and Statistics 67 No. 4 (1985): 648-660.
Bell, Stephen, and Larry Orrb. “Screening (and creaming?) applicants to job training programs” Labour Economics. Vol. 9 No. 2 (2002): 279-301.
Blavoukos, Spyros and George Pagoulatos. “The Limits of EMU Conditionality: Fiscal Adjustment in Southern Europe.” Journal of Public Policy 28 No.2 (2008):229-253.
Bourguignon, Francois and Mark Sundberg. “Aid Effectiveness – Opening the Black Box.” American Economics Review 97 No. 2 (2007): 316-321.
Burnside C, Dollar D. Aid, Policies and Growth: Revisiting the Evidence. World Bank Policy
Research Working Paper No.3251. Washington D.C.: The World Bank 2004.
Busby, Joshua J.W. “Bono Made Jesse Helms Cry: Jubilee 2000, Debt Relief, and Moral Action in International Politics.” International Studies Quarterly 51 No. 2 (2007): 247-75.
Card, David and Henry S. Farber. “Introduction: Festschrift Articles Honoring Orley Ashenfelter.” Industrial & Labor Relations Review 58 No. 3 (2005): Article 1.Available at: http://digitalcommons.ilr.cornell.edu/ilrreview/vol58/iss3/1.
Collier, Paul. The Bottom Billion. New York: Oxford University Press, 2007.
Dalgaard CJ, Hansen H. “On Aid, Growth and Good Policies.” Journal of Development Studies 37 No. (2001): 17–41.
Dalgaard CJ and others. “On the empirics of foreign aid and growth.” Economic Journal 114 No. 6 (2004): 191–216.
Dollar, D. “The increasing selectivity of foreign aid, 1984-2003.” World Development 34 No. 12 (2006): 20-34.
Johnson, Doug & Tristan Zajonc. “Can Foreign Aid Create an Incentive for Good Governance? Evidence from the Millennium Challenge Corporation” Kennedy School of Government, Working Paper Series (2006). Available at: http://ssrn.com/abstract=896293.
Easterly, W. “Aid, Policies, and Growth: Comment.” The American Economic Review 94 No. 3 (2004): 774.
Easterly, William W. “Can foreign aid buy growth?” The Journal of Economic Perspectives 17 No. 3 (2003): 23-48.
Easterly, William. The Cartel of Good Intentions: Bureaucracy versus Markets in Foreign Aid. Working Paper No. 4. Washington D.C.: Center for Global Development, 2002.
Easterly, William. The White Man’s Burden: Why the West’s Efforts to Aid the Rest Have Done So Much Ill and So Little Good. New York: Penguin, 2006.
Easterly, William. “Was Development Assistance a Mistake?” American Economic Review 97 No. 2 (2007): 328-332.
Easterly, William, and others. “New data, new doubts: a comment on Burnside and Dollar’s ‘‘Aid, policies and growth.” American Economic Review 94 No. 3 (2004): 781–784.
Fleck, R. K. “Changing aid regimes? US foreign aid from the cold war to the war on terror.” Journal of Development Economics 91 No. 2 (2010): 185.
Hook, Kent. “Ideas and Change in U.S. Foreign Aid: Inventing the Millennium Challenge Corporation.” Foreign Policy Analysis 4 (2008): 147–167.
Islam N. 2002. Regime Changes, Economic Policies and the Effects of Aid on Growth. Paper presented at the conference ‘‘Exchange Rates, Economic Integration and the International Economy’’, 2002, Ryerson University, Canada.
Knoll, Martin and Petra Zloczysti. “The Good Governance Indicators of the Millennium
Challenge Account How Many Dimensions Are Really Being Measured?” German Institute for
Economic Research, August 2006.
Lensink R, White H. “Are there negative returns to aid?” Journal of Development Studies 37 No. 6 (2008): 42–65.
Madani, Dorsati and Marth Licetti. “Business Regulation, Reform, and Corruption.” Prem Notes, Economic Policy. New York: World Bank, 2010.
McGillivray M. “Aid Effectiveness and Selectivity: Integrating Multiple Objectives in Aid Allocations.” DAC Journal 4 No. (2003): 23–36.
McGillivray, Mark. “Controversies Over the Impact of Development Aid: It Works; It Doesn’t; It Can, But That Depends”, Journal of International Development 18 No. 7 (2006): 1031-1050.
Millennium Challenge Corporation (MCC). Congressional Budget Justification Fiscal Year 2012. Washington D.C.: MCC, 2011. Available at: http://www.mcc.gov/documents/reports/mcc-fy2012-cbj.pdf.
Mosley, Paul, John Hudson and Arjan Verschoor. “Aid, Poverty Reduction, and the ‘New Conditionality’.” The Economic Journal, 114 (2004).
Ohler, Hannes, Peter Nunnenkamp and Axel Dreher. “Does Conditionality Work? A Test for an Innovative US Aid Scheme.” Kiel Institute for the World Economy, Kiel Working Paper No. 1630. (2010).
Radelet, Steven C. Challenging foreign aid: A policymaker's guide to the millennium challenge account. Washington, DC: Center for Global Development, 2003.
Radelet, Steven C. “A Note on the MCC Selection Process for 2005.” Washington D.C.: Center for Global Development, 2004.
Radelet, Steven C. “Primer on foreign aid.” Washington D.C.: Center for Global Development, 2006.
Roodman D. The Anarchy of Numbers: Aid, Development and Cross-country Empirics. Working Paper No. 32. Washington, DC: Centre for Global Development, 2003.
Stubbs, Rebecca. “The Millennium Challenge Account: Influencing Governance in Developing Countries through Performance-Based Foreign Aid.” Vanderbilt University Law School, 2009.
Svensson, Jakob. “Who must pay bribes and how much? Evidence from a cross section of firms.” Quarterly Journal of Economics, 118 (2003): 207–230.
Tarnoff, Curt. Millennium Challenge Corporation. Washington D.C.: Congressional Research Institute, 2011.
Tendler, Judith. Inside Foreign Aid. Baltimore: Johns Hopkins University Press, 1975.
Verschoor, Arjan and Adriaan Kalwij. “Aid, Social Policies, and Pro-Poor Growth.” Journal of International Development 18, (2006): 519–532
Table 1: Indicator Detailed Descriptions
Indicator Data Description
Political Rights
Data on Political Rights were obtained from Freedom House's Freedom in the World 2003-2010 reports, and cover years 2002-2009. This indicator reflects the 0-40 (40="most free") scale. The data are also available online at http://www.freedomhouse.org/template.cfm?page=15.
Civil Liberties
Data on Civil Liberties were obtained from Freedom House's Freedom in the World 2003-2010 reports, and cover years 2002-2009. This indicator reflects the 0-60 (60="most free") scale . The data are available online at http://www.freedomhouse.org/template.cfm?page=15.
Control of Corruption
Data on Control of Corruption were obtained from the Worldwide Governance Indicators by the World Bank/Brookings Institution, 1996-2010. Data are available for 1996, 1998, 2000, 2002-2009, and can be accessed online at http://info.worldbank.org/governance/wgi/index.asp.
Government Effectiveness
Data on Government Effectiveness were obtained from the Worldwide Governance Indicators by the World Bank/Brookings Institution, 1996-2010. Data are available for 1996, 1998, 2000, 2002-2009, and can be accessed online at http://info.worldbank.org/governance/wgi/index.asp.
Rule of Law
Data on Rule of Law were obtained from the Worldwide Governance Indicators by the World Bank/Brookings Institution, 1996-2010. Data are available for 1996, 1998, 2000, 2002-2009, and can be accessed online at http://info.worldbank.org/governance/wgi/index.asp.
Voice and Accountability
Data on Voice and Accountability were obtained from the Worldwide Governance Indicators by the World Bank/Brookings Institution, 1996-2010. Data are available for 1996, 1998, 2000, 2002-2009, and can be accessed online at http://info.worldbank.org/governance/wgi/index.asp.
Immunization Rates
Data on Immunization Rates were obtained from the World Health Organization and the United Nations Children's Fund and are available for 1990-2009. These data are available online at
http://www.who.int/entity/immunization_monitoring/data/coverage_estimates_series.xls.
Health Expenditures
Data on Health Expenditures were obtained from the World Health Organization (WHO) and are available for 2001-2008 (with 2009 coverage for some countries). The indicator measures general government health expenditure (GGHE) as a percentage of GDP. The components of the data (GGHE and GDP) are available from the country pages located online at http://www.who.int/nha/country/en/.
Primary Education Expenditures
Data on Primary Education Expenditures are available for 1999-2010. The data were obtained from the United Nations Educational, Scientific and Cultural Organization (UNESCO) or the national governments.
Girls Primary Completion Rates
Data on Girls' Primary Education Completion Rates were obtained from the United Nations Educational, Scientific and Cultural Organization (UNESCO), and are available for 1999-2010. The most recent year available varies by country. These data are also available online at http://stats.uis.unesco.org/.
Regulatory Quality
Data on Regulatory Quality were obtained from the Worldwide Governance Indicators by the World Bank/Brookings Institution, 1996-2010. Data are available for 1996, 1998, 2000, 2002-2009, and can be accessed online at http://info.worldbank.org/governance/wgi/index.asp.
Days to Start a Business
Data on Days to Start a Business were obtained from the International Finance Corporation's Doing Business reports, 2004-2011. Data are available for 2003-2010 and can be obtained online at
http://www.doingbusiness.org/.
Cost of Starting a Business
Data on the Cost of Starting a Business were obtained from the International Finance Corporation's Doing Business reports, 2004-2011. Data are available for 2003-2010 and can be obtained online at
http://www.doingbusiness.org/.
Trade Policy
Data on Trade Policy were obtained from the Heritage Foundation's Index of Economic Freedom, 1995-2011. Data are available for 1995-2010. This indicator reflects the 0-100 (100="most free") scale. The data are available online at http://www.heritage.org/research/reports/2010/09/trade-freedom-continues-to-advance-barely and http://www.heritage.org/Index/
Inflation
Data on Inflation were obtained from the International Monetary Fund's Oct. 2010 World Economic Outlook (WEO) and are available for 1995-2009. The data measure annual percentage change averages for the year, not end-of-period data. The WEO database can be accessed online at
http://www.imf.org/external/ns/cs.aspx?id=28.
Fiscal Policy
TABLE 2: Summary of MCC Indicators
Indicator Unit Source
Political Rights (-) Point Scale (1-7) Freedom House
Civil Liberties (-) Point Scale (1-7) Freedom House
Voice and Accountability (+) Index (-2.5 - 2.5) World Bank Institute
Government Effectiveness (+) Index (-2.5 - 2.5) World Bank Institute
Rule of Law (+) Index (-2.5 - 2.5) World Bank Institute
Control of Corruption (+) Index (-2.5 - 2.5) World Bank Institute
Girls’ Primary Education Completion Rate (+) Percentage World Bank Group and UNESCO Public Primary Education Spending (%GDP) (+) Percentage National Governments
Public Expenditure on Health (% GDP) (+) Percentage National Governments
Immunization Rate for DPT3 and Measles (+) Percentage World Health Organization
Cost of Starting a Business (% GDP per capita) (-) Percentage World Bank Group
1-Year Consumer Price Inflation (-) Percentage Multiple
Fiscal Policy (+) Percentage National Governments and IMF
Trade Policy (+) Percentage Heritage Foundation
Regulatory Quality (+) Index (-2.5 - 2.5) World Bank Institute
Days to Start a Business (-) Days World Bank Group
Ru lin g Ju st ly In ve st in g in P eo p le En co u ra gi n g Ec o n o mi c Fr ee ed o m
Notes: Signs in parentheses indicate the direction of change that is associated with an improvement. Indicators highlighted in grey were not included in this analysis due to lack of data.
Indicators 1 2 3 4 5 6 7 8 9 10 11 12 13
1 Control of Corruption 1 2 Government Effectiveness 0.95 1.00
3 Rule of Law 0.96 0.96 1.00
4 Voice & Accountability 0.81 0.85 0.83 1.00 5 Immunization Rate 0.46 0.48 0.48 0.41 1.00 6 Health Expenditure 0.73 0.71 0.71 0.70 0.38 1.00 7 Primary Education -0.09 -0.15 -0.11 -0.06 -0.12 0.04 1.00 8 Girls' Primary Education 0.50 0.57 0.51 0.52 0.67 0.40 -0.25 1.00 9 Regulatory Policy 0.90 0.94 0.91 0.85 0.48 0.69 -0.21 0.52 1.00 10 Days to Start a Business -0.37 -0.39 -0.40 -0.29 -0.27 -0.33 0.02 -0.09 -0.39 1.00 11 Trade Policy 0.58 0.59 0.54 0.53 0.36 0.50 -0.15 0.39 0.66 -0.31 1.00 12 Inflation -0.33 -0.33 -0.33 -0.26 -0.02 -0.20 0.05 -0.06 -0.37 0.16 -0.13 1.00 13 Fiscal Policy 0.12 0.04 0.07 -0.03 0.02 -0.01 -0.09 -0.03 0.03 0.03 0.16 -0.04 1.00
Table 3: Indicator Correlation Test