ABSTRACT ...2
INTRODUCTION ...3
BACKGROUND ...4
ENERGY ACCESS IN SUB-SAHARAN AFRICA ... 4
VULNERABILITY AND THE CAUSES OF DEFORESTATION ... 6
EFFORTS TO PREVENT OR REVERSE DEFORESTATION ... 9
SPATIAL PATTERNS OF ACCESS ...12
THE STUDY AREA ... 14
MALAWI CONTEXT ...14
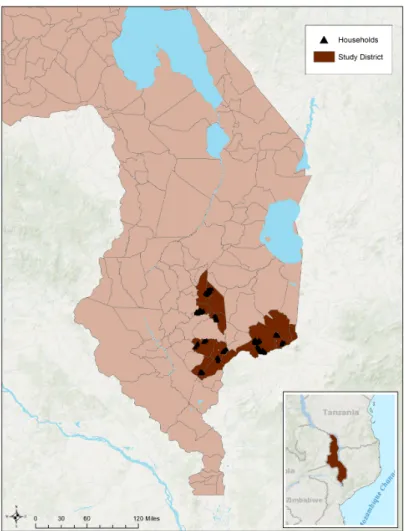
FIGURE 1.MAP OF STUDY DISTRICTS IN SOUTHERN MALAWI ...14
SOUTHERN MALAWI AND TROPICAL CYCLONE IDAI ...15
FIGURES 2A.B.CLIMATE VULNERABILITY OF SOUTHERN MALAWI ...16
METHODOLOGY ... 16
DATA COLLECTION...16
DATA ANALYSIS ...17
RESULTS ... 19
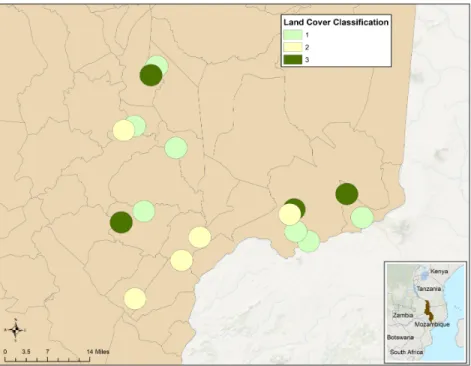
FIGURE 3.LAND USE LAND COVER CHANGE CLASSIFICATIONS MAP ...20
FIGURE 4A.B.REFORESTATION EFFORTS AS A PERCENTAGE OF TOTAL HOUSEHOLDS IN EACH VILLAGE CLUSTER AND B.CLUSTERING OF REFORESTATION EFFORTS AT THE HOUSEHOLD LEVEL ...21
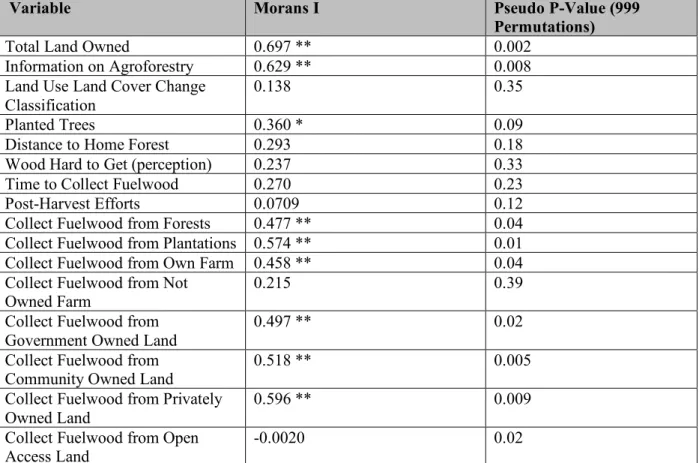
TABLE 2.SPATIAL CLUSTERING RESULTS USING MORANS I VALUE OF LOCAL CLUSTERING ...22
FIGURE 5.UNIVARIATE CLUSTERING WITH KERNAL WEIGHTS ...23
FIGURE 6.BIVARIATE CLUSTERING WITH KERNAL WEIGHTS ...23
DISCUSSION ... 24
CLUSTERING OF INDICATORS OF ACCESS ...24
DIFFERENCES IN LAND USE LAND COVER CHANGE CLASSIFICATIONS ...26
INFLUENCE OF AGROFORESTRY PROMOTION ...27
CASE STUDY OF NAKHOLU ...28
CONCLUSIONS ... 29
APPENDIX... 31
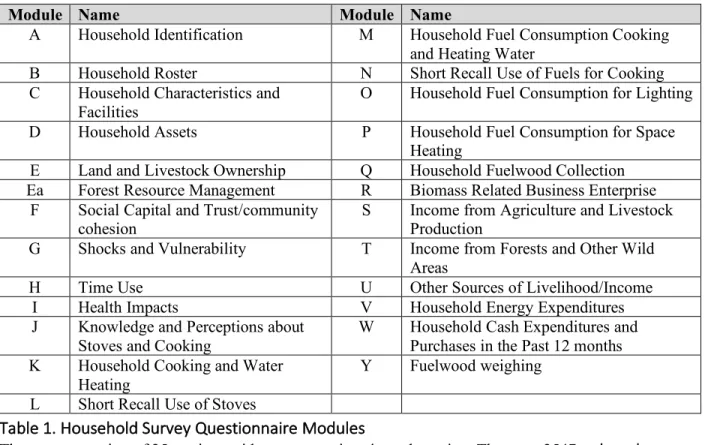
TABLE 1.HOUSEHOLD SURVEY QUESTIONNAIRE MODULES ...31
TABLE 2.WORDING OF RELEVANT QUESTIONS ...32
TABLE 3.VIFANALYSIS ...33
TABLE 5.CORRELATION MATRIX OF SIGNIFICANT VARIABLES ...33
TABLE 6.DESCRIPTIVE STATISTICS OF VARIABLES OF INTEREST ...35
FIGURE 1:DIFFERENCES IN THE CONNECTIVITY OF WEIGHTS ...36
FIGURE 2.REASONS TREES WERE PLANTED...36
Abstract
Investigations into energy access in Sub-Saharan Africa often focus on modern energy
transitions and electrification projects. However, these studies fail to consider the household
level differences in access to energy sources and lack of opportunity to transition to alternative
modern fuels. This study uses household-level data to explore household level reforestation
efforts as a strategy to improve access to energy sources and improve environmental resilience
on a community level. Specifically: Are reforestation efforts in Southern Malawi clustered in
space, and do the surrounding land use land cover change classifications or household
characteristics influence these efforts? The study, are conducted in southern Malawi with
ultra-poor households that receive social cash transfer payments. Therefore, the focus of this study is
on the most vulnerable, lowest income households in the community. It is expected that
households with limited surrounding forest cover, and those who have received information on
agroforestry or sustainable practices would be most likely to participate in reforestation efforts in
the form of tree planting. There is observable spatial clustering of village clusters that have been
provided information on agroforestry or sustainable practices and household-level tree planting
efforts in village clusters, but the two are not found to be spatially correlated. We find that the
total land owned by individual households is strongly correlated with tree planting efforts,
especially in areas where wood is not primarily collected from plantations. Contrary to the
expected result, reforestation efforts are not found to be linked to a current lack of access to
energy sources, but are linked to land ownership. This study concludes that participation in
un-aided reforestation efforts in southern Malawi may not be a mechanism for households to reduce
ability to plant trees. This paper suggests that promotion efforts should consider other factors that
are associated with the decision to reforest to be most effective in promoting sustainable practice.
Introduction
Biomass is the primary source of fuel for people living in rural areas in southern Malawi.
This creates a strong link between the livelihood of rural people in Malawi and the availability of
biomass suitable for household energy within the surrounding environment. As the population of
Malawi grows rapidly, this dependence has increased (World Bank, 2018). At the same time,
Malawi has experienced increasingly severe droughts as the globe continues to warm, and this
has led to decreased crop productivity and associated food shortages (USAID, 2016).
Furthermore, the Southern region of Malawi is being deforested at accelerating rates,
with agricultural production, charcoal production, and fuel consumption as drivers of
deforestation and forest degradation (Jagger et al, 2016; Ngwira, et al. 2019). As the population
depends more on a depleting supply of biomass fuel, efforts to reforest Malawi and the
communities that are impacted most are increasingly necessary. Unfortunately, many
reforestation efforts prove futile in impact, and a greater understanding of the mechanisms that
drive reforestation efforts will be important for policy makers moving forward (Mauambeta,
2010).
What is the influence of energy access (as determined by location, distance and
household characteristics) on fuelwood use and forest management efforts in 16 village clusters
of Southern Malawi? The spatial component of energy access to fuel resources will be the focus
resource extraction in an attempt to understand the spatial patterns of forest degradation (Miteva,
Et al. 2017). These studies focus on proximity and spatial characteristics to evaluate community
level differences in in access to markets. This study will apply a similar methodology in terms of
access to forest resources and the impact on
This paper contributes to this understanding from the alternative view of how resource
extraction and reforestation efforts are impacted by geographic context. The geographic context
is evaluated in terms of the time and distance to a fuelwood source (from survey data), and the
land cover land use classification (from satellite data). As Malawi faces extreme population
growth and decreasing access to energy as a result of deforestation, studies like this will help
policy makers implement effective intervention strategies (Jagger & Kittner, 2017).
Background
Energy Access in Sub-Saharan Africa
Access to reliable energy sources has become a focus of international development
agencies as energy poverty is often linked with health and income challenges. The potential for
economic growth that comes with increased access to energy has made this issue a fundamental
link in meeting the Millennium Development Goals (Srivastava et al, 2012; Brew-Hammond,
2010; Gujba et al, 2012; Sokona et al, 2012). Sub-Saharan Africa has one of the lowest
electrification rates in the world with only 42% of the population having access to electricity in
2016, (World Bank Group, 2018) and 80% of the population relying on traditional biomass fuels
Research shows that this use of biomass for meeting daily energy needs contributes
significantly to the prevalence of health threatening household air pollution (WHO, 2014).
Furthermore, Sub-Saharan Africa is largely considered one of the most vulnerable regions to
global climate change due to the low resilience of rural communities as droughts and floods
increase in severity and frequency. A low-carbon energy transition is strongly encouraged for the
vulnerable region as the world moves towards renewable sources (Meckonnen et al, 2012). Due
to the clear benefits of modern and renewable energy use, the majority of studies on energy
access focus on the transition from “traditional” fuel sources (biomass, dung, crop residues) to
“modern” fuels (LPG, biogas, electricity).
The energy transition is often viewed in terms of an energy ladder, with traditional fuel
sources at the bottom of the ladder and renewable energy and electricity at the top of the ladder
(Agbemabiese, 2012). However, transition to modern fuels is often more complicated than the
ladder model might suggest, as many households combine different fuel types to meet energy
needs (Brew-Hammond, 2010; Jagger et al, 2016). While it would be ideal to skip over the lower
rungs of the ladder to the most sustainable and reliable forms of energy, there are critical
challenges preventing rapid electrification in the region. These challenges include gaps in
financial resources and unreliable electricity flow due to low generation capacities (Balachandra,
2011). Furthermore, the current generation capacity of many nations is reliant on renewable
sources, like hydropower, that vary widely depending on the season. Hydropower generation
capacity is also threatened by increased unpredictability due to climate change (Gujba, 2012).
The need for energy policies to incorporate several energy resource and technology
options is of great importance to increase access (Brew-Hammond, 2010; Balachandra, 2011).
supplies at community level is an attractive option, as it yields positive results both at the level of
environmental protection and income generation,” (Brew-Hammond, 2010). This study hopes to
explore community wide reforestation efforts as a method of improving energy access and
boosting the capacity of a community to adapt or mitigate the effects of climate change.
Vulnerability and the Causes of Deforestation
Vulnerability and adaptability are guiding themes in the literature on resource utilization
and reforestation efforts in Sub-Saharan Africa and developing nations across the globe. The
question of vulnerability is especially relevant to this study because “…while global warming is
changing the world, the distributional effects and risks associated with those changes follow the
contours of social power and inequality,” (Faye & Ribot 2017). The high levels of poverty and
the resulting low adaptive capacity of the population in southern Malawi and much of
Sub-Saharan Africa makes this region particularly vulnerable to climate effects.
The ability of a population to adapt to changes in the environment is increasingly
important, but this ability requires a level of planning for the future that is currently not feasible
in Malawi where people occasionally have to sacrifice sustainable and long-term livelihood to
fulfill short-term needs (Hartter & Boston, 2007). This desire to “consume in a world of scarce
resources” is outlined in a classic piece of literature called “The Fuelwood Crisis and the
Environment” that started conversations about the “fuelwood crisis in Africa” (Pearson &
Stevens, 1989). While the distinction of environmental ‘crisis’ was premature, the theme of
deforestation as a result of the growing global energy demand and the lack of sustainable land
There is not a consensus on the mechanism that causes deforestation in areas of the world
that depend highly on wood resources for meeting energy needs. Some papers insist that the
extraction of wood resources for fuel is a leading cause of forest degradation (Bailis et al 2015,
Jagger & Perez-Heydrich 2016, Schulte-Bisping et al 1999) while some claim that the
deforestation is caused by agricultural land conversion (Hyde & Seve 1993, Pullanikkatil et al
2016, Zulu 2010) and others approach the question as still unanswered (Webb & Dhakal, 2011).
The question of responsibility plays a role in the recommendations to policy makers to
improve the environment and resulting resilience of nearby populations. For example, those who
focus on the importance of fuelwood collection on deforestation rates propose the
implementation of reforestation efforts, improved cookstove programs, or fuel substitution and
diversification as short- and long-term techniques to improve the resiliency of communities
(Jagger & Perez-Heydrich 2016). However, Pullanikkatil argues that the main driver of
deforestation is the demand for agricultural land as the population grows (Pullanikkatil et al
2016). Accordingly, reforestation efforts would not prove effective in preventing deforestation if
these reforestation efforts are done in a mini plantation or agroforestry style that would increase
the demand for agricultural land and decrease the need for energy efficiency (Heltberg et al,
2000).
Similarly, Hyde and Seve warn that enabling smallholder community members to plant
trees via reforestation initiatives could lead to a decrease in demand for market fuelwood, which
would result in an increase in the price and corresponding value of this wood (Hyde & Seve
1993). The increased value of trees for fuelwood could exceed the value of agricultural land,
which would result in households planting trees on the highest value land which is closer to the
lands into the fringe of the indigenous forest. Hyde and Seve conclude that “shifts in the general
location of trees and forests may alter the locus of watershed management problems,” and lead to
greater erosion as the tree cover is removed where the forest once stood (Hyde & Seve 1993).
The cause of high deforestation rates requires more investigation to provide well
informed recommendations to policy makers on how to best implement sustainability programs
in the future. It is possible that reforestation efforts will require proper management to see
environmental benefits. The survey data from Southern Malawi provides insight into this debate
with data on the amount of fuelwood stored for energy usage and the land type from which
fuelwood is retrieved. It is worth noting that 96.6% of interviewed households used collected
wood as an energy source for cooking and heating water within a year of the interview, while
only 10% used purchased fuelwood in the same timeline. Due to the widely referenced
preference for free resources when available, the market demand for fuelwood is assumed have
minimal impact on the studied communities. However, purchased fuelwood may be explored as
a potential response to lack of available nearby fuel wood.
The survey results found that 84% of respondents who collect fuelwood reported that
their method of collection was to gather deadwood from the forest; a practice that would not
contribute to high deforestation rates. These results are supported by numerous studies that the
majority of fuelwood collectors prefer dead and dry wood over live trees, because the dead wood
is both lighter to carry and easier to keep aflame (Preston et al 2017, Zulu 2010). The fact that
dead, dry wood is lighter to carry is important considering 96% of respondents to the 2017
household survey reported carrying fuelwood back to their households by headload. While this
suggests that deforestation is not caused directly from fuelwood collection, reforestation efforts
Efforts to Prevent or Reverse Deforestation
Forest coverage in Malawi has decreased from 34.4% in 2010 to 33.3% in 2015, a 1%
decline in total forest coverage (World Bank, 2018). Furthermore, the Miombo woodlands of
which Malawi is apart deforest at between 0.2 – 1.7 % per year (IPCC 2014). A popular
suggestion for counteracting this decline is to implement reforestation efforts in the area to
provide households with a sustainable supply of fuelwood. However, most studies agree that the
success of reforestation efforts at a large scale will require outside parties (be that the
government or non-governmental agencies) to provide smallholders with the necessary seedlings
(Hyde & Seve 1993).
However, all case studies do not find this recommendation to be necessary, as in the
Chemoga watershed in Ethiopia which has experienced an increase in forest cover over the past
few years without the help of an outside party. This unaided reforestation effort was attributed to
replanting efforts in an attempt to make up for overall wood scarcity in the area (Bewket 2003).
Inspired from these findings, this study will explore the potential for unaided reforestation efforts
to improve access to energy sources as a result of general fuelwood scarcity.
Access to forest resources is influenced strongly by the availability of plantations or
agroforestry. Village woodlots or plantations are found to decrease the probability of fuel wood
collection from natural forest, but this trend is not valid if the village woodlot is close to the
forest area (Kohlin & Parks 2001). This may be in part due to the villagers view of the woodlot
as a collective managerial action more than a technique in preserving the forest, and the
proximity of the two sources will not lead to behavioral changes from the community (Kohlin &
Planting trees and participating in reforestation efforts requires a certain level of land
ownership, and can create inequalities in fuelwood access between those who own land and
those who do not. Webb & Dhakal explore this correlation between land ownership and
vulnerability by evaluating tree planting behavior on agricultural land in Nepal. The conclusion
of the study is that the household characteristics do not influence the participation in planting
efforts on agricultural land if the local forests have an abundant supply of wood because of the
decreased need for private supply when the public supply is plentiful (Webb & Dhakal 2011).
Therefore, the supply of public fuel wood has been found to influence the behavior of local
community members.
Numerous papers explore the correlation between reductions in fuelwood accessibility
and the substitution of lower quality fuels (Brouwer et al 1996, Heltberg et al 2000, Jagger &
Perez-Heydrich 2016, Preston et al 2017, Zulu 2010). The fuel ladder moves from dung and crop
residues to fuelwood to charcoal the so called “modern” fuels of LPG and electricity (Preston et
al 2007, Zulu 2010). The inferior fuel types of dung and crop residues are often substituted for
fuel wood in times of scarcity, but they come with disadvantages like the time and care spent
when cooking with these low-calorie content fuels (Brouwer et al, 1996). While the mixing in of
inferior fuel types during times of scarcity is well recorded, a potential policy misconception is
that the modern fuel types like LPG and electricity will replace the biomass fuel types as a
solution to deforestation and environmental degradation in the future.
In practice the “modern” energy transition is not yet economically feasible for the
majority of households in Southern Malawi or rural Sub-Saharan Africa (Preston et al 2017).
Accordingly, Zulu argues that the running policy of the Department of Energy Affairs to wait for
disjointed energy policy,” (Zulu 2010). Furthermore, Zulu goes on to describe the expectation of
the Malawian government to decrease the use of charcoal (for its significant environmental
impact) by implementing a charcoal ban as both “unrealistic and untenable” (Zulu 2010). This is
due to the strong preference of communities to mix fuel types and substitute out scarce resources.
Finally, on the national level, the traditional way to protect natural resources is via
state-ownership and the establishment of nationally protected areas. However, during the field work
for the 2017 survey, multiple trips were taken to national forests or preserved areas and
Malawians were observed collecting fuelwood in the open, undisturbed by the presence of
researchers. According to a study by Abbot and Mace in 1999 in a protected area of Lake
Malawi, the law enforcement of the protected area had little effect on the collection of fuel wood
from within the park boundaries (Abbot & Mace 1999). They concluded that this was due to both
the lack of consistent patrolling, and the sheer size of the protected area. The number of days per
month that the area is patrolled is approximately 6.6, with an average encounter with local
fuelwood collectors at 1 per patrol (Abbot & Mace 1999). Furthermore, the punishments for
being caught collecting fuelwood in the protected area was relatively small and ineffective.
The leniency in the law enforcement may be attributed to the dependency of rural
communities on this forest, and the increasing focus on charcoal as a major cause of
deforestation unlike small scale fuelwood collection (Abbot & Mace 1999). The majority of
fuelwood collectors prefer dry, dead wood that is lighter to carry and easier to light. On the
contrary, charcoal producers prefer using live trees because the moisture in the wood is vital for
the charcoal production process, which results in deforestation rates 4 – 12 times higher than that
Spatial Patterns of Access
Fuel usage and fuel wood collection behavior has been modeled as a function of spatial
proximity (He et al 2009, Jagger & Perez-Heydrich 2016, Kohlin & Parks 2001). Specifically,
the spatial patterns of fuelwood collection have been evaluated to model environmental
interactions and enable the design of effective conservation strategies (He et al 2009), and
efficient intervention methodology, like the implementation of village woodlots to reduce forest
degradation at various distances from the community (Kohlin & Parks 2001). Distance is often
used as a measure of the accessibility of fuel resources, but some literature has explored
household level factors that influence the ability of a household to access resources, and found
that labor constraints and wealth play larger roles in determining access than distance. (Brouwer
et al 1997). This finding will be considered when determining the household level access to
fuelwood in the overall study.
The proximity of a household to a given market has been found to directly influence the
likelihood that the household participates in selling fuel wood or charcoal (Miteva et al 2017).
Daniela Miteva and her team at Ohio State University studied the spatial patterns of market
participation and resource extraction in Northern Uganda and found significant correlation
between proximity to the market or forest and the utilization of either. Specifically, the study
found that households that did not participate in the market (collected their own resources) were
often found at the furthest distances to the market and closest to the forest, while the households
that relied solely on the market for resources were found closest to the market itself. Finally, the
households that sold the biomass materials at the market were often found at intermediate
pattern model to find correlations between reforestation efforts and access to nearby forests using
The Study Area
Malawi Context
Malawi is a small country in southern Africa
(see Figure 1) with a dense population of
18.6 million people in a little under 46,000
square miles (USAID, 2018). Malawi has
one of the lowest gross domestic products
per capita at $1,084 (in purchasing power
parity), and is experiencing accelerating
deforestation and resulting environmental
degradation (Hansen et al, 2013). The study
area is in a region of the world that only
contributes a small portion to the worlds
CO2 emissions, but is at risk to be
significantly affected by the resulting change
in the global climate as droughts and floods
negatively impact crop yields (Bandyopadhyay et al, 2011; Srivastava et al, 2012; Wellard et al,
2012). Furthermore, Malawi has an extremely low rate of electrification at 1% in the rural areas
(study areas) 46% in the urban regions, and 10.8% access rate determined by overall connections
(USAID, 2018). Furthermore, the generation capacity of Malawi consists of nearly 88%
hydroelectric power that varies seasonally as droughts bring the lake levels down.
Figure 1. Map of Study Districts in Southern Malawi
The study districts are highlighted in dark red, and the
Southern Malawi and Tropical Cyclone Idai
Three districts in Southern Malawi were chosen to conduct the interviews for this project.
Southern Malawi experiences higher deforestation rates than the Northern part of the country
(Jagger & Perez-Heydrich, 2016), and is at higher risk to adverse climate effects (see Figure 2A).
Climate change threatens to cause stronger and more frequent extreme weather events in the
future. This study will explore reforestation efforts as a form of increasing energy access while
decreasing the environmental degradation and vulnerability caused by high deforestation rates.
While writing this paper in March 2019, a deadly cyclone hit the eastern coast of Africa
left behind catastrophic damage in the southern areas of the country. Cyclone Idai was one of the
worst tropical cyclones to hit Africa and was the third deadliest tropical cylone on record.
Reports warn that this storm might be indicative of the increase in dangerous weather events due
to climate forcing (John, 2019). Such storms post a dangerous threat to the vulnerable and
impoverished rural populations in Southern Malawi and Mozambique (see Figure 2B). The risk
of increased climate variability, low rates of electrification, and high deforestation rates make
Figures 2A. B. Climate Vulnerability of Southern Malawi
These maps were generated using data from (a) The Regional Centre for Mapping of Development Resources (RCMRD) developed with Malawi Department of Disaster Management Affairs (DoMDA) developed for SERVIR a USAID-NASA project and (b) Netherlands Red Cross. The vulnerability index is a determined by combining measures of exposure, sensitivity, and adaptive capacity for Malawi. The flood data is a measure of affected people per district developed from Sentinel satellite imagery (from March 7th to March 14th) and high-resolution settlement layer grids.
Methodology
Data Collection
This project collected data in the summer of 2017 using a survey which was the first of a
three-year study funded by the National Science Foundation (NSF) to examine the changes in
Southern Africa’s coupled human, terrestrial and atmospheric systems. The survey was
conducted in three distinct districts in Southern Malawi: Mulanje, Thyolo, and Chiradzulu. The
complete a total of 900 household surveys. The households were chosen based on their
distinction as a social cash transfer program (SCTP) recipient. The SCTP targets ultra-poor and
labor constrained households to provide a cash payment in an attempt to improve livelihoods and
reduce inequality (Garcia & Moore, 2012).
The survey collects data on the poorest and most vulnerable households of each
community. The districts chosen for this survey were picked as 2 treatment and 1 control
regions, as the SCTP program is present in only 2 of the districts, and improved cookstoves
(Chitetezo Mbaula) have been provided to those treatment districts as well. The survey will be
evaluating the adoption rates of these improved cookstoves, but this part of the survey will not be
used for this study. The survey takes between 1-3 hours per household and asks various
questions about the daily lives and fuel use of respondents (see Table 1 in appendix for module
descriptions).
Data Analysis
The variables of interest are isolated from the main dataset, and the households are
summarized into the 16 interviewed village clusters. The mean center of all the data points in
each village cluster is used as an approximation for the middle of the village cluster. This is
necessary, because there is no precise geographic boundary for the village cluster administration
level. A 3 km buffer is created to measure the forest cover and deforestation rates of the area
surrounding the village cluster. This buffer distance is chosen because greater than 70% of
respondents reported a fuelwood collection distance within or equal to 3 km, and every
interviewed household is located within a 3 km buffer of the mean center of the respective
the space that the interview results represent. Malawi has a high population density, and the
variation in unrepresented village clusters will not be summarized into interviewed clusters with
Theisen polygons. The deforestation rates are determined by the change in percentage of forest
classified land from the Sentinel satellite within each buffer from 2000 to 2013. The percent
forested is determined from the percentage of forest classified land in 2013 alone. The land
classified as forest was ensured to not include the bright green tea plantations that are common in
the Mulanje and Thyolo regions by visual comparison to the provided dataset.
The household level data is then summarized into each village cluster using the averages
of the variables of interest (see table 6 in appendix). The yes/no questions are then indicative of
the percentage of yes’ (value of 1) compared to the percentages of no’s (value of 0). New fields
are created to indicate the household’s response on where they most frequently collect fuelwood
(type and ownership of the land). These new fields are able to take a categorical variable and
create a yes or no binary that indicated which descriptor was the primary type or ownership of
the land fuelwood is collected from. Each of these values of interest are placed into a correlation
matrix using excels correlation data analysis add in to see general trends in the data (see Table 4
in appendix). Time and distance (in km) are collected for each question regarding proximity, but
only the time variable will be used in this study for simplicity. These variables have been cleaned
for extraneous values and have a strong correlation (> 0.99 in the correlation matrix). Finally, the
difference between the future expected wealth step and the current perceived wealth step was
calculated as an indicator of positive outlook for the future.
A variance inflation factor of the variables of interest is calculated to reduce
multicollinearity of the dataset (see Table 3 in appendix). The new binary fields generated from
one of the descriptors. Therefore, the study only runs regressions on one of each of these
categorical variables at a time. The linear regressions were conducted in R using an ordinary
least squares linear regression model, and the classic spatial regressions were conducted using
GeoDa software. Spatial clustering analyses are conducted using uniform Kernal weights. A
global clustering analysis in SatScan was used to highlight the nearby village clusters that had
high and low percentages of reforestation efforts (see Figure 4B). The global clustering was
modelled using a Poisson distribution without a buffer limit. Finally, Moran’s I values from the
kernel weighted clustering analyses in GeoDa are used to measure general clustering behavior of
the variables (see Figure 1 in appendix for description of weights). This clustering is used to
guide the regression variables.
Results
The land use land cover change classifications are broken down into three categories.
These categories describe areas with varying rates of deforestation and current forest cover. The
classifications are not found to be clustered in space, but are used as descriptors to distinguish
Figure 3. Land Use Land Cover Change Classifications Map
This map indicates the land use land cover change classification (1-3) determined from the deforestation and forest cover percent for 3-kilometer buffers from each village cluster center. Category 1 is defined as low forest cover (< 7%) and low deforestation (< 22%), while category 2 has high deforestation (>22%) and low forest cover (< 7%). Finally, category 3 represents high forest cover (> 7%) and low
deforestation (< 22%).
Reforestation efforts in this paper are measured primarily using self-reported data on tree
planting. The survey also collected data on post-harvest management and measures to encourage
re-growth, but the response rates for this variable were low at 8.3% compared to 26.2% that
reported planting trees in the past 5 years. Furthermore, the post-harvest efforts were distributed
randomly in space with no observed spatial correlation (Moran’s I: 0.0709). This is why tree
planting efforts are the focus of this paper, as the primary form of sustainable reforesting efforts.
A local clustering analysis was run on tree planting observations at the village cluster level using
Kernal weights (see Figure 1 in appendix). The local clustering of tree planting behavior is
household level tree planting (see Figure 4B) in SatScan, and there are multiple clusters of high
and low tree planting reports on the household level.
Figure 4A. B. Reforestation Efforts as a Percentage of Total Households in each Village Cluster and B. Clustering of Reforestation Efforts at the Household Level
The main focus of the data analysis was on the impacts of various land cover types and energy access indicators on the participation of a household in reforestation efforts as measured by tree planting within 5 years of the interview. These figures show the raw values (a) and clustering analysis (b) of tree planting at the village cluster level for the 16 village clusters interviewed in southern Malawi. The clusters were generating using a Poisson model in SatScan clustering software.
Moran’s I values are used as an indication of clustering over local space. A Moran’s I value of 1
would represent perfect clustering, and -1 would represent perfect dispersion. The local
clustering of several variables is indicated in Table 2. The significance of this clustering value is
Variable Morans I Pseudo P-Value (999 Permutations)
Total Land Owned 0.697 ** 0.002
Information on Agroforestry 0.629 ** 0.008
Land Use Land Cover Change Classification
0.138 0.35
Planted Trees 0.360 * 0.09
Distance to Home Forest 0.293 0.18
Wood Hard to Get (perception) 0.237 0.33
Time to Collect Fuelwood 0.270 0.23
Post-Harvest Efforts 0.0709 0.12
Collect Fuelwood from Forests 0.477 ** 0.04
Collect Fuelwood from Plantations 0.574 ** 0.01
Collect Fuelwood from Own Farm 0.458 ** 0.04
Collect Fuelwood from Not Owned Farm
0.215 0.39
Collect Fuelwood from Government Owned Land
0.497 ** 0.02
Collect Fuelwood from
Community Owned Land 0.518 ** 0.005
Collect Fuelwood from Privately Owned Land
0.596 ** 0.009
Collect Fuelwood from Open Access Land
-0.0020 0.02
Table 2. Spatial Clustering results using Morans I value of Local Clustering
The spatial clustering of several village cluster level variables is conducted and a Moran’s I result suggests the strength of this spatial clustering. These are calculated using uniform Kernal Weights in Geoda. Two stars indicate a significant trend of local clustering. One star indicates a variable of interest with an observable trend that is not statistically significant over 999 permutations.
The Moran’s I values can be represented through a clustering map as shown in Figures 5
and 6. Figure 5 represents the local clustering of 3 variables with significant Moran’s I
correlation from Table 2. Figure 6 uses a bivariate local clustering analysis to show the
correlation between two variables as a form of clustered space. These clusters are generated by
calculating the average of the neighbors of the dependent variable and comparing this to the
relative value of the independent variable (written in order of independent to dependent in the
caption of Figure 6). Figure 6A compares total land owned and lagged trees planted (Moran’s I
and lagged fuelwood primarily collected from plantations or woodlots (Moran’s I 0.553 with a
p-value of 0.007).
Figure 5. Univariate Clustering with Kernal Weights
(a) Households that primarily collect fuelwood from private land (b) Information received on agroforestry and (c) Total land owned. The dark red values show areas with High-High clustering (high value
surrounded by high values), and the dark blue represent Low-Low clustering (low values surrounded by other low values).
Figure 6. Bivariate clustering with Kernal Weights
(a) Total land owned by households lagged with households that planted trees (Moran’s I 0.533 with a p-value of 0.008), and (b) Fuelwood collected from private land compared to Fuelwood Collected from Plantations (Moran’s I 0.553 with a p-value of 0.007). The clustering shows dark red (High-High clustering), dark blue (Low-Low clustering), and light blue (Low-High
clustering).
C B
A
Discussion
This study used several techniques to explore the factors that influence reforestation
efforts in Southern Malawi. The results indicate several variables are spatially clustered, and
correlated over space. However, the differences in household characteristics over different land
cover land use change classifications is left unclear from the data. This will be explored further
below. Furthermore, there is distinct clustering of the spread of information on agroforestry as
reported by households. This trend does not correlate with the clusters of tree planting activity as
would be expected. The factors that do spatially correlate with tree planting activity are explored
in an attempt to understand the discrepancy between the expected impact of agroforestry
promotion and the observed trends. Finally, fuelwood is largely reported as being difficult to
collect with 85% of participants agreeing that fuelwood is difficult to obtain. There is one district
that stands out with only 68% of the participating households reporting that fuelwood is difficult
to obtain. This cluster will be further explored to see if this perception has an observable impact
on reforestation efforts.
Clustering of Indicators of Access
Clustering of tree planting behavior is observed (see Figure 4B), but there are no
observed clustering of post-harvest care efforts (Moran’s I of 0.0709 in Table 2). This may be a
result of the extremely low number of households that reported participating in post-harvest care
(~10% of total households). The most significant variable related to reforestation efforts is found
to be a positive relationship to total land owned for both the linear model at the household level,
Figure 6A). Finally, the total land owned by a household is negatively correlated with the
perception of wood being difficult to collect (p < 0.02). This might suggest that with more land
owned, a household has more capacity to plant trees and collect from a nearby location. Tree
planting activity requires land to plant on, and may not be a feasible option to improve energy
access for all.
Finally, the location from which a given household collects wood is strongly correlated
with the ownership of the land as shown by the bivariate clustering in Figure 6B. Village clusters
that largely collect fuelwood from plantations are clustered in the same areas as households that
largely collect fuelwood from private land (see Figure 6B). Village clusters that collect most
often from the forest is strongly negatively spatially correlated with collection from privately
owned land (Moran’s I of -0.503 and P-Value of 0.02). Reforestation efforts are not found to
significantly correlate with any type of land from which fuelwood is collected. It is a surprise
that tree planting is not associated with households collecting fuelwood from their own farm or
negatively correlated with collection from forests.
The reason a household planted trees was asked if a household responded yes to planting
trees in the past 5 years (see Figure 2. in appendix). These responses show that fruit was the
primary overall reason cited for planting trees (34.7 %), with fuel following with 31.1 % of the
total reasons. However, 55.9 % of respondents cited fruit as the first reason for planting the trees
and only 25.4 % cited fuel first. This suggests that tree planting is not primarily used to increase
access to fuel wood. A question is asked on the survey about total planted forest, but this
question refers to the acres of woodlot owned by the household not efforts to reforest (see table 2
Differences in Land Use Land Cover Change Classifications
Land cover land use change classifications are predicted to have distinct differences in
means for characteristic variables like distance to home forest (5 minute difference) or
perception of future improvement (12.5 % difference). However, the categories are a simplified
model of the land types, and are not found to be significantly clustered in space on a village
cluster level (Table 2). Therefore, the impact of land classifications on household level
characteristics will be primarily be evaluated using ordinary least square regressions and t-tests
of the household response data. For example, the perceived future improvement variable was
highest for land classification 1 (low deforestation and low forest cover) and lowest for land
classification 3 (low deforestation and high forest cover). A T test was run on these two
household level responses and the difference in means was determined to be close to statistically
significant (p ~ 0.06). This was unexpected as high forest cover was hypothesized to be an
indicator for future resilience and energy access. However, this result is merely descriptive in
nature, because this trend might be impacted by how low or high the current wealth status of
individual households is evaluated. The current wealth perception is in fact highest for land
cover 3 (1.24) and lowest for land cover 1 (1.18). The difference in means of the current wealth
perception is not statistically significant (p ~ 0.14).
The difference in future improvement might be due to a better perception of current
standing in the community in the high forest cover environment. Furthermore, a difference in
means was determined for the change in time spent collecting fuelwood over the past 5 years.
Land cover classification 3 had the perception of the most change, and category 1 had the
perception of the least change (p ~ 0.07). The observable differences in perception of fuelwood
deforestation land cover classification remained between the other two. This should be further
explored, but it is possible that changes in high forest cover areas are noticed more readily than
large changes in areas with low forest cover. Whether these differences may be explained by
responses to scarcity will be explored further below.
Influence of Agroforestry Promotion
There is a significant positive linear relationship between reforestation efforts in the form
of planting trees and receiving information on agroforestry at the household level (p < 0.05).
However, at the village cluster level, the spatial regression shows an inverse relationship
between reforestation efforts by planting trees and receiving information on agroforestry (see
Figure 5B). This suggests that while households were more likely to respond that they had
planted trees in the past four years if they had received information about agroforestry and
sustainable forest practices, this trend does not remain present at a village cluster scale. This may
be due to the way agroforestry information is parsed out, which is in a very clustered and
spatially specific manner. Furthermore, the tree planting behavior on a village cluster basis was
spatially concentrated independent of the agroforestry information. This might suggest that the
information is not the reason communities are participating in reforestation efforts, as these
Case Study of Nakholu
The variable for perception of wood collection difficulty (wood hard to get) is quite high
across all households with an average of 85% responding yes. However, there is one village
cluster, Nakholu, that reports a difficult time collecting wood in only 68% of households. Other
factors were explored in a case study of this village cluster to see the characteristics that might
have contributed to this large difference in perception.
The number of households that responded that they planted trees in the last 5 years was
twice as high as the total average (50% vs. 26.2% respectively). Total land ownership is also
slightly higher in terms of average acreage at 1.57 acres vs. 1.21 for the entire study. 84% of
these households collect fuelwood from private land, with 44% coming from plantations and
32% from forests. This village cluster may be indicative that with tree planting efforts, there is a
lower perception of difficulty to obtain fuelwood and potentially greater access to energy
resources. Conclusions will not be drawn based on a single village cluster, but Nakholu provides
insight into the cluster level differences that might be influenced by the household level
Conclusions
This study has explored reforestation efforts in southern Malawi as a form of improving
energy access and reducing vulnerability to climate change in rural communities. The analysis
used survey results from the summer of 2017 from social class transfer households in 16 village
clusters. Furthermore, the land use land cover change of the village clusters was used to classify
the clusters into 3 types of land cover land cover change categories. This classification was used
to describe differences in the way communities interacted with their environment, and it was
hypothesized that less access to forest resources due to deforestation rates would promote
reforestation efforts in the form of tree planting activity. No significant trend was found in the
differences between land cover categories, but there were other household level characteristics
that appeared to influence the participation in reforestation efforts. The strongest correlation was
a result of total land owned, especially when looking at households that collected from private
land. Furthermore, it was expected that information on agroforestry might influence households
to plant trees, but this trend was not observed in the study districts. In fact, the areas which had
more households report being given information on agroforestry reported lower levels of tree
planting. This may be a result of the type of land from which fuelwood is collected in these
areas, primarily from forests. This study concludes that more research needs to be done into the
factors that influence reforestation efforts to create more effective reforestation initiatives. As
discussed in this paper, reforestation is a unique way to increase access to energy sources and
decrease the vulnerability of already sensitive regions.
The biggest limitation of this study is the determination of “reforestation efforts” as
defined by households that participate in tree planting. However, responses indicate that fuel is
reforest or practice sustainable fuelwood collection may be indicated by post-harvest care, but
this variable received low response rates overall for the interviewed districts. It is suggested that
reforestation efforts may be a result of ability and not necessity, in which case the most
vulnerable and labor constrained households in each community (SCTP households) is not the
best sample for determining why households participate in reforestation efforts. This study could
therefore be improved with a random selection of households, and more detailed questions about
the meaning reforestation.
This study hopes to continue work on reforestation efforts and energy access by
developing an indicator for energy access that includes access to forest resources. Especially
because areas with easy access to free forest resources are less likely to undergo a modern energy
transition without economic motivation. I hope to include land ownership, energy alternatives,
perception of access, physical distance, LULCC, and household level demographics in the
energy access model. Furthermore, GPS tracks have been taken in this study area, and these will
be used as a measure of access and distance to forest resources (including but not limited to
fuelwood). These tracks will be used to validate current assumptions on distance to forests, and
popularity of collecting lower quality fuels or crop residues instead of wood fuel. Finally, this
study hopes to expand on the exploration of the effects of providing information on agroforestry
and sustainable practices with case studies of actual reforestation information efforts to enable
Appendix
Module Name Module Name
A Household Identification M Household Fuel Consumption Cooking
and Heating Water
B Household Roster N Short Recall Use of Fuels for Cooking
C Household Characteristics and
Facilities
O Household Fuel Consumption for Lighting
D Household Assets P Household Fuel Consumption for Space
Heating
E Land and Livestock Ownership Q Household Fuelwood Collection
Ea Forest Resource Management R Biomass Related Business Enterprise
F Social Capital and Trust/community cohesion
S Income from Agriculture and Livestock Production
G Shocks and Vulnerability T Income from Forests and Other Wild
Areas
H Time Use U Other Sources of Livelihood/Income
I Health Impacts V Household Energy Expenditures
J Knowledge and Perceptions about
Stoves and Cooking
W Household Cash Expenditures and
Purchases in the Past 12 months
K Household Cooking and Water
Heating
Y Fuelwood weighing
L Short Recall Use of Stoves
Table 1. Household Survey Questionnaire Modules
The survey consists of 25 sections with many questions in each section. There are 2547 resImagine a stairway with 6 steps – on the bottom step (step 1), we have the poorest people in the community; on the highest step we have the
ponses over a wide array of question types. The above chart gives a better understanding of the types of questions asked in the survey and the information that is collected.
Description Question Answer Choices / type
Total Land Owned Total land owned (including
land rented out)? [Sum of Agricultural Land, Owned Natural Forest, and Owned Plantation Land]
Acres
Planted Forest Total planted forest/woodlot
owned (acres)
Acres Current and Future Wealth Step Imagine a stairway with 6 steps
– on the bottom step (step 1), we have the poorest people in the community; on the highest step we have the richest people. On which step would you say you are on now?
1=Poorest, 2=Almost poorest, 3=Middle, closer to poor, 4=Middle, closer to rich, 5=Almost richest, 6=Richest
Information on Agroforestry Has any member of the
household received information
on agroforestry or tree planting in the last 12 months?
Planted Trees In the past 5 years has your
household planted trees?
No=0: Yes=1 Reason trees were planted If yes, what were your reasons
for planting trees?
1=Fruit, 2=Fodder, 3=Fuel, 4=Ornamental, 5=Biofuels (i.e. ethanol),
6=Fencing/construction, 99=Other, specify
Distance to Home Forest How far is it from your
household to the edge of the nearest natural forest/woodland that you have access to and can use? (In distance)
Kilometers
Wood Hard to Get (perception) Read the following statement and ask respondent whether he or she agrees (yes), disagrees (no) or has no opinion. (Firewood is hard to obtain)
No=0, Yes=1, No Opinion=2 (No opinion eliminated from analysis)
Time to Collect Fuelwood How long does it take you to
walk from your dwelling to where you usually go to collect the fuelwood (one-way)?
Minutes
Post-Harvest Efforts When you collect fuelwood, do
you take measures to encourage regrowth or post-harvest management?
No=0: Yes=1
Time Collecting Fuelwood Change in Last 5 years
Does your household spend more or less time collecting firewood than you did 5 years ago?
1=More, 2=About the same, 3=Less
Collect Fuelwood from Land Type
Where do you most frequently go to collect the fuelwood?
1=Natural forest/woodland, 2=Plantation/woodlot , 3=Trees on farms (own farm), 4=Trees on farms (not own farm) , 99=Others (Specify) Collect Fuelwood from Land
Ownership
What is the ownership status of the forest/woodlot/farm where you most frequently go do collect fuelwood?
1=Government/state, 2=Community owned , 3=Private, 4=Open access , 99=Other (Specify)
Table 2. Wording of Relevant Questions
This table provides the actual wording of the questions used in this study. The variable descriptions are used throughout the paper, and these questions are how those variables were collected.
treesplant 1.039134926
totalland 1.04163877
infoagrofo 1.018119918
woodhardto 1.006753378
timefw 1.028491056
fwlandowns 1.017980659
pharvestac 1.008378867
lulcc 1.015565393
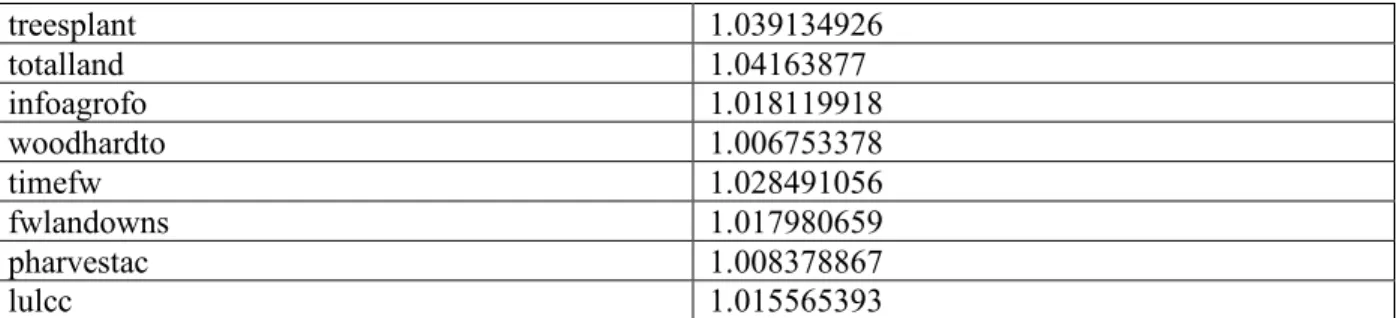
Table 3. VIF Analysis
The VIF analysis provides an indication of the multicollinearity of the variables that are used in the regressions. The above chart shows values around 1, which are accepted as low co-dependence. The variables with VIF result above 1.5 were eliminated, because when they were added to a multivariate regression, the multicollinearity was above the acceptable limit of 30.
Total Land
Owned
% that Plant
Trees Information on Agroforestry Wood Hard to get Kilometers to Collect Fuelwood Collected from Plantation
% that Planted
Trees
0.8308 ** 1
Agroforest
Info
-0.0325 0.1508 1
Wood hard to
get
-0.4949 * -0.6057* 0.0357 1
Km to Collect
fw
-0.0396 -0.1178 -0.07623 0.2153 1
Plantation 0.00815 -0.0158 -0.5943* -0.2680 0.2533 1
Private 0.1045 0.2121 -0.5061* -0.3411 -0.02949 0.8514 **
Table 5. Correlation Matrix of Significant Variables
Variable of
Interest
Mulanje Thyolo Chiradzulu Total
Total Land Owned
1.202 acres 0.785 acres 1.653 acres 1.212 acres
Information on Agroforestry
21% yes 19.6% yes 30.4% yes 23.7% yes
Land Use Land Cover Change Classification
Planted Trees 30.3% yes 24.6% yes 23.7% yes 28.2% yes
Distance to Home Forest
52.2 minutes 53.3 minutes 38.7 minutes 48.1 minutes
Wood Hard to Get (perception)
81.6% agree 86.0% agree 82.6% agree 83.4% agree
Time to Collect Fuelwood
45.3 minutes 46.8 minutes 33.8 minutes 42.0 minutes
Post-Harvest Efforts
8.67% yes 8.97% yes 7.35% yes 8.33% yes
Collect Fuelwood from Forests
51% 37.5% 60.8% 49.8%
Collect Fuelwood from Plantations
26.6% 34.9% 13.4% 21.0%
Collect Fuelwood from Own Farm
Collect Fuelwood from Not Owned Farm
5.67% 8.63% 7.69% 7.34%
Collect Fuelwood from Government Owned Land
51.0% 37.5% 60.8% 49.8%
Collect Fuelwood from Community Owned Land
26.7% 34.9% 13.3% 21.0%
Collect Fuelwood from Privately Owned Land
7.0% 8.97% 16.0% 10.7%
Collect Fuelwood from Open Access Land
5.67% 8.63% 7.69% 7.33%
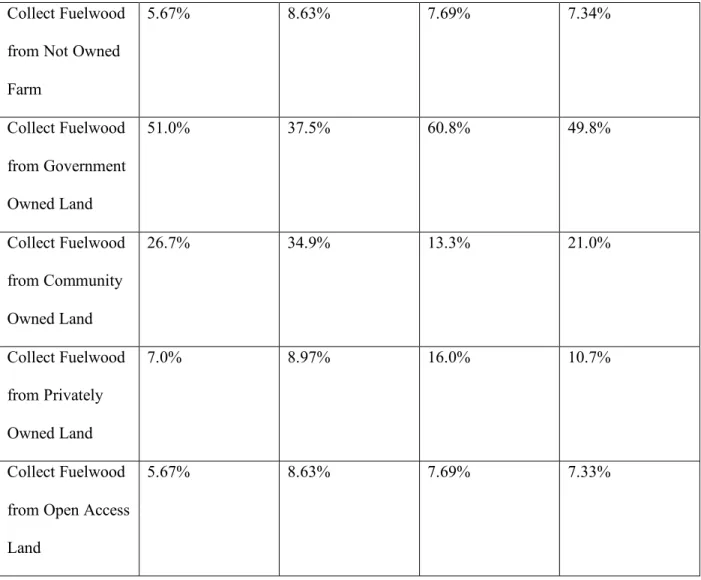
Table 6. Descriptive Statistics of Variables of Interest
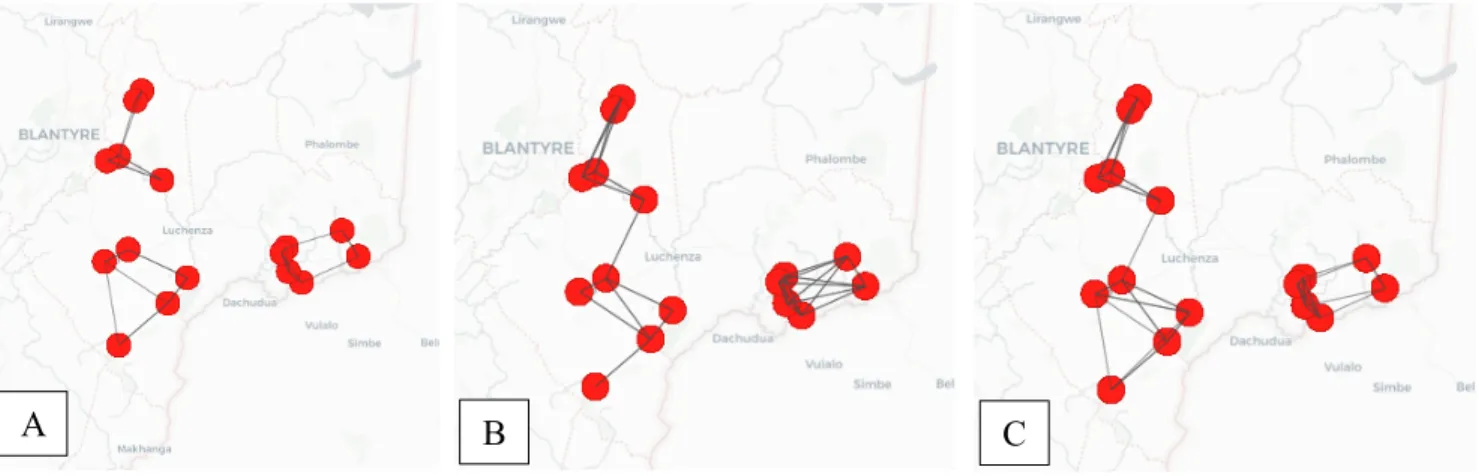
Figure 1: Differences in the Connectivity of Weights
The connectivity of the village clusters as measured by different weights (a) 2 K- Nearest Neighbors Weight (b) 20 km Distance Weight calculated with arc distance (c) Uniform Adaptive Kernel with 1 Diagonal weight and the maximum K-Nearest Neighbors as the band width. The uniform adaptive kernel is used throughout the paper.
Reason Percentage of 236 Total ‘First
Reason’ Responses
Percentage of 380 Total
Reasons
Fruit 55.9 % 34.7 %
Fuel 25.4 % 31.1 %
Fencing 10.6 % 21.8 %
Biofuel (i.e. ethanol) 3.81 % 3.68 %
Other 2.97 % 5.79 %
Fodder 0.847 % 0.789 %
Ornament 0.423 % 2.10 %
Figure 2. Reasons Trees were Planted
Responses for the question regarding the reason for planting trees. The percentage of ‘first reason’ is the first response to the question, and the percentage of total reasons includes the second reason (if) cited.
Works Cited
Abbot, J. I. (1996). Rural Subsistence and Protected Areas : Community Use of the miombo
woodlands of Lake Malawi National Park. (February).
Abbot, J. I. O., & Mace, R. (1999). Managing protected woodlands: Fuelwood collection and law
enforcement in Lake Malawi National Park. Conservation Biology, 13(2), 418–421.
Agbemabiese, L., Nkomo, J., & Sokona, Y. (2012). Enabling innovations in energy access: An
African perspective. Energy Policy, 47(SUPPL.1), 38–47.
Bailis, R., Drigo, R., Ghilardi, A., & Masera, O. (2015). The carbon footprint of traditional
woodfuels. Nature Climate Change, 5(3), 266–272.
Balachandra, P. (2011). Modern energy access to all in rural India: An integrated implementation
strategy. Energy Policy, 39(12), 7803–7814.
Bewket, W. (2003). Household Level Tree Planting and its Importance for Environmental
Management in the North-Western Highlands of Ethiopia: A Case Study in the Chemoga
Watershed, Blue Nile Basin. Land Degredation and Development, 14, 377–388.
Brew-Hammond, A. (2010). Energy access in Africa: Challenges ahead. Energy Policy, 38(5),
2291–2301.
Brouwer, I. D., Hoorweg, J. C., & Van Liere, M. (1997). When Households Run Out of Fuel:
Responses of Rural Households to Decreasing Fuelwood Availability, Ntcheu District,
Brouwer, I. D., Wijnhoven, T. M. A., Burema, J., & Hoorweg, J. C. (1996). Household fuel use
and food consumption: Relationship and seasonal effects in Central Malawi. Ecology of
Food and Nutrition, 35(3), 179–193.
Fall, L. (2005). Energy Access: Illusion or Reality for the Poor? Energy & Environment, 16(5),
743–761.
Faye, P., & Ribot, J. (2017). Causes for adaptation: Access to forests, markets and representation
in Eastern Senegal. Sustainability (Switzerland), 9(2), 1–20.
Garcia, M., & Moore, C. (2012). The Rise of Cash Transfer Programs in Sub-Saharan Africa.
Gujba, H., Thorne, S., Mulugetta, Y., Rai, K., & Sokona, Y. (2012). Financing low carbon
energy access in Africa. Energy Policy, 47(SUPPL.1), 71–78.
Hartter, J., & Boston, K. (2007). An integrated approach to modeling resource utilization for
rural communities in developing countries. Journal of Environmental Management, 85(1),
78–92.
He, G., Chen, X., Beaer, S., Colunga, M., Mertig, A., An, L., … Liu, J. (2009). Spatial and
temporal patterns of fuelwood collection in Wolong Nature Reserve: Implications for panda
conservation. Landscape and Urban Planning, 92(1), 1–9.
Heltberg, R., Arndt, T. C., & Sekhar, N. U. (2000). Fuelwood Consumption and Forest
Degradation: A Household Model for Domestic Energy Substitution in Rural India. Land
Hyde, W. F., & Seve, J. E. (1993). The economic role of wood products in tropical deforestation:
the severe example of Malawi. Forest Ecology and Management, 57(1–4), 283–300.
Iiyama, M., Neufeldt, H., Dobie, P., Njenga, M., Ndegwa, G., & Jamnadass, R. (2014). The
potential of agroforestry in the provision of sustainable woodfuel in sub-Saharan Africa.
Current Opinion in Environmental Sustainability, 6(1), 138–147.
IPCC. (2014). Climate Change 2014: Synthesis Report. In Climate Change 2014: Synthesis.
Jagger, P., & Kittner, N. (2017). Deforestation and biomass fuel dynamics in Uganda. Biomass
and Bioenergy, 105, 1–9. https://doi.org/10.1016/j.biombioe.2017.06.005
Jagger, P., & Perez-Heydrich, C. (2016). Land use and household energy dynamics in Malawi.
Environmental Research Letters, 11(12).
James Cook, R. (1992). Wheat root health management and environmental concern. Canadian
Journal of Plant Pathology, 14(1), 76–85.
Karna, Y. K., Hussin, Y. A., Gilani, H., Bronsveld, M. C., Murthy, M. S. R., Qamer, F. M., …
Baniya, C. B. (2015). Integration of WorldView-2 and airborne LiDAR data for tree species
level carbon stock mapping in Kayar Khola watershed, Nepal. International Journal of
Applied Earth Observation and Geoinformation, 38, 280–291.
Karna, Y. K., Hussin, Y. A., Gilani, H., Bronsveld, M. C., Murthy, M. S. R., Qamer, F. M., …
Baniya, C. B. (2015). Integration of WorldView-2 and airborne LiDAR data for tree species
level carbon stock mapping in Kayar Khola watershed, Nepal. International Journal of
Kohlin, G., & Parks, P. J. (2006). Spatial Variability and Disincentives to Harvest: Deforestation
and Fuelwood Collection in South Asia. Land Economics, 77(2), 206.
Lund, J. F., Rutt, R. L., & Ribot, J. (2018). Trends in research on forestry decentralization
policies. Current Opinion in Environmental Sustainability, 32, 17–22.
Mauambeta, D., D, C., R, M., & S, G. (2010). Status of forests and tree management in Malawi.
Researchgate, (September 2010).
Miteva, D. A., Kramer, R. A., Brown, Z. S., & Smith, M. D. (2017). Spatial patterns of market
participation and resource extraction: Fuelwood collection in Northern Uganda. American
Journal of Agricultural Economics, 99(4), 1008–1026.
Pearson, P. J. G., & Stevens, P. (1989). The Fuelwood Crisis and the Environment. Energy
Policy, 17(2), 132.
Preston, K., Pypker, T. G., & Orr, B. (2017). Women and fuelwood in Lupeta, Tanzania:
Constraints to alternative fuels and fuelwood management strategies. Journal of Sustainable
Forestry, 36(6), 555–567.
Pullanikkatil, D., Palamuleni, L., & Ruhiiga, T. (2016). Assessment of land use change in
Likangala River catchment, Malawi: A remote sensing and DPSIR approach. Applied
Geography, 71, 9–23.
Rahut, D. B., Behera, B., & Ali, A. (2016). Patterns and determinants of household use of fuels
Sokona, Y., Mulugetta, Y., & Gujba, H. (2012). Widening energy access in Africa: Towards
energy transition. Energy Policy, 47(SUPPL.1), 3–10.
Specht, T. D., & Rosendahl, B. R. (1989). Architecture of the Lake Malawi Rift, East Africa.
Journal of African Earth Sciences, 8(2–4), 355–382.
Srivastava, L., Goswami, A., Diljun, G. M., & Chaudhury, S. (2012). Energy access: Revelations
from energy consumption patterns in rural India. Energy Policy, 47(SUPPL.1), 11–20.
Toole, R. (2015). The Energy Ladder : A Valid Model for Household Fuel Transitions in
Sub-Saharan Africa ? A thesis submitted by Rebecca Toole in partial fulfillment of the
requirements for the degree of Master of Science in Urban and Environmental Policy and
Planning and. (August).
USAID. Malawi Climate Change Fact Sheet. (2016, September). Retrieved November 28, 2018.
Webb, E. L., & Dhakal, A. (2011). Patterns and drivers of fuelwood collection and tree planting
in a Middle Hill watershed of Nepal. Biomass and Bioenergy, 35(1), 121–132.
Webb, E. L., & Dhakal, A. (2011). Patterns and drivers of fuelwood collection and tree planting
in a Middle Hill watershed of Nepal. Biomass and Bioenergy, 35(1), 121–132.
Woldeamlak, B. (2005). Bio-fuel Consumption , Household Level Tree Planting and Its
Implications For Environmental Management In The Northwestern Highlands Of Ethiopia.
388(April), 377–388.
Zulu, L. C. (2010). The forbidden fuel: Charcoal, urban woodfuel demand and supply dynamics,
community forest management and woodfuel policy in Malawi. Energy Policy, 38(7),