UNC Honor Pledge: We certify that no unauthorized assistance has been received or given during the completion of this work
Orange County Rape Crisis Center
Community Education Evaluation Plan
4th & 5th Grade Safe Touch Outcome Evaluation and
7th Grade Start Strong Process Evaluation
Capstone Team:
Sarah Cooper Deena Fulton
Maryka Lier Ada Nwadugbo Trang Tran
Preceptor:
Laurie Graham, MSW
Faculty Advisors:
ii
Abstract
Background: According to a 2011 nationally representative survey of adults, 18.3% of women and 1.4% of men in the US reported being raped at some time in their lives. Attitudes and beliefs such as racism, sexism, and homophobia are the most pervasive and frequent forms of sexual violence (SV), and may be precursors of sexual harassment, sexual assault, and rape. These attitudes and beliefs are often expressed during adolescence through bullying, and there is emerging evidence of a link between bullying
prevention and SV perpetration prevention. The Orange County Rape Crisis Center (OCRCC) conducts school-based SV prevention programs that aim to prevent bullying and sexual bullying among young adolescents. Evaluations of school-based interventions specifically focusing on SV perpetration prevention are rare, and OCRCC had not previously conducted systematic evaluations of their SV perpetration prevention programs. Our Capstone team conducted process and outcome evaluations of three of OCRCC’s curricula, which aim to prevent bullying, cyberbullying, and sexual harassment in order to prevent SV perpetration.
Methods: Our Capstone team created an evaluation plan for an outcome evaluation of the fourth and fifth grade components of OCRCC’s Safe Touch (ST) program and a process evaluation of the seventh grade component of OCRCC’s Start Strong (SS) program. We developed and implemented two questionnaires for the ST outcome evaluation, one for fourth graders and one for fifth graders, and collected the data using a pre-test post-test evaluation design with a comparison group. To collect data for the Start Strong (SS) process evaluation, we developed and implemented the following tools: a Facilitator Knowledge and Self-Efficacy Questionnaire, a Facilitator Satisfaction Questionnaire, Facilitator Activity Logs, an
Observation Checklist, and a Student Satisfaction Questionnaire. We also developed a Key Informant Interview Guide for OCRCC staff to implement in the future. Finally, the team created two reports with executive summaries and a stakeholder presentation for both evaluations.
Results: For fourth grade, students who had the Safe Touch program had improved knowledge about respectful internet use and positive beliefs about reporting cyberbullying. For fifth grade, students who had the Safe Touch program had improved knowledge about sexual bullying and positive beliefs about being an active bystander. However, we were not able to conclude that the Safe Touch program improved students’ self-efficacy and intention to engage in certain behaviors, such as reporting or intervening in a bullying situation.
iii
Acknowledgements
The Capstone team would like to thank our preceptor at the Orange County Rape Crisis Center, Laurie Graham, MSW, for providing guidance, skills, and organizational expertise throughout the Capstone project, as well as the Rape Prevention Education Coordinator, Rachel Valentine, and the Education and Finance Coordinator, Alexis Kralic, for their feedback, guidance and collaboration. It was truly a pleasure to work with and learn from them.
We would also like to thank our faculty advisors, Drs. Jo Anne Earp and Shelley Golden for their invaluable support and expert advice throughout the development of our deliverables. The editing process helped refine our deliverables into products of which we are truly proud. We are grateful to have had such invested advisors throughout the learning experience.
We would like to acknowledge the staff and teachers at the Orange County and Chapel Hill-Carrboro City elementary and middle schools for their cooperation throughout this Capstone experience. Additionally, we would like to thank the UNC Gillings School of Global Public Health, Health Behavior Department for making this Capstone experience possible.
iv
Acronyms & Public Health Terms
CHCCS Chapel Hill Carrboro City Schools
OCS Orange County Schools
OCRCC Orange County Rape Crisis Center
CE Community Education
PTSD Post-traumatic Stress Disorder
RPEC Rape Prevention Education Coordinator
SS Start Strong
ST Safe Touch
v
Table of Contents
Abstract ... ii
Acknowledgements ... iii
Acronyms & Public Health Terms ... iv
Introduction ... 1
About OCRCC ... 1
Capstone Project Description ... 1
Deliverables ... 2
Background ... 4
Prevalence and Health Impacts of Sexual Violence ... 4
Sexual Violence Risk Factors ... 5
Sexual Violence Prevention Conceptual Framework ... 6
Evaluation of Sexual Violence Prevention Programs in School-Based Settings ... 7
Our Approach ... 8
Methods ... 8
Safe Touch: 4th & 5th Grade Outcome Evaluation Methods ... 9
Safe Touch Data Collection... 9
Safe Touch Data Management and Analysis ... 10
Start Strong: 7th Grade Process Evaluation Methods ... 11
Start Strong Data Collection ... 11
Start Strong Data Management and Analysis ... 12
Methods for Reporting on the Evaluation ... 13
Dissemination of Findings ... 13
Results ... 14
Discussion ... 15
Implications for OCRCC ... 15
Project Limitations ... 16
Recommended Next Steps ... 17
Considerations for Sustainability ... 18
vi
Conclusion ... 18
References ... 20
Appendix A: Deliverable Tables ... I
Table A1. Deliverable 1: Evaluation Plan for Safe Touch & Start Strong ... I Table A2. Deliverable II: Process Evaluation Tool for 7th Grade Start Strong... II Table A3. Deliverable III: Student Questionnaires for Safe Touch Outcome Evaluation ... III Table A4. Deliverable IV: 7th Grade Start Strong Evaluation Report & Presentation ... IV Table A5. Deliverable V: 4th & 5th Grade Safe Touch Evaluation Report & Presentation ... V
Appendix B: Safe Touch Evaluation ... VII
Table B1. Number of Respondents for 4th Grade Safe Touch Outcome Evaluation ... VII Table B2. Number of Respondents for 5th Grade Safe Touch Outcome Evaluation ... VII Table B3. 4th Grade Safe Touch Indicators and Results... VIII Table B4. 5th Grade Safe Touch Indicators and Results... IX
Appendix C: Start Strong Process Evaluation ... XI
1
Introduction
The following document is the summary report for the 2013-2014 Orange County Rape Crisis Center (OCRCC) Capstone project. The purpose of the Capstone summary report is to communicate the Capstone Team’s project and process; this document will serve as the official record of our Capstone experience. The Capstone is a yearlong service-learning experience that builds on the skills that we have gained throughout our coursework. The project takes place during the final two semesters of the Master of Public Health program in the Department of Health Behavior at UNC Gillings School of Global Public Health.
About OCRCC
The OCRCC is a non-profit agency located in Chapel Hill, North Carolina. OCRCC has been serving Chapel Hill, Carrboro, Hillsborough and surrounding communities since 1974 (OCRCC, 2013a). Their mission is to stop sexual violence and its impact through support, education, and advocacy
(OCRCC, 2013a). The services OCRCC provide include support groups, a 24-hour crisis helpline, therapy referrals, and community education (CE) programs. The goals of the CE programs are to raise awareness about and prevent sexual violence. Through their CE programs, offered in various local organizations and schools, OCRCC teaches children and adults how to prevent violence through recognition of warning signs of violence, resources to seek if one experiences sexual violence, how to become an active bystander, and ways to avoid becoming a bully (OCRCC, 2013b).
Capstone Project Description
Two of the CE programs that our Capstone team worked on are OCRCC’s 4th and 5th grade Safe
Touch (ST) program and the 7th grade Start Strong (SS) program. Both are school-based programs aimed
2
and bullying. The 7th grade SS is a four-day program that addresses the differences between sexual harassment and flirting, challenges genders stereotypes, and teaches more about active bystander intervention. This was the first year that the SS program would also train volunteer facilitators to implement the program in the classrooms. These programs are implemented in elementary and middle schools in the suburban Chapel Hill Carrboro City Schools (CHCCS) and Orange County Schools (OCS), respectively.
In order to build organizational capacity to conduct evaluations on the CE programs, OCRCC sought out a Capstone team to create an evaluation plan and conduct an outcome evaluation on the 4th and
5th grade Safe Touch program and a process evaluation on the 7th grade Start Strong program. The main
goals of this Capstone project were to 1) measure short-term outcomes of the ST curriculum for 4th and 5th
grades; 2) measure the extent to which the 7th grade SS program was implemented as intended; and 3)
provide recommendations for future curricula revisions and program evaluations. The OCRCC plans to use our findings to demonstrate the value of ST and SS to current and potential funders and other stakeholders, as well as to identify areas for improvement and use the tools for future evaluations.
Deliverables
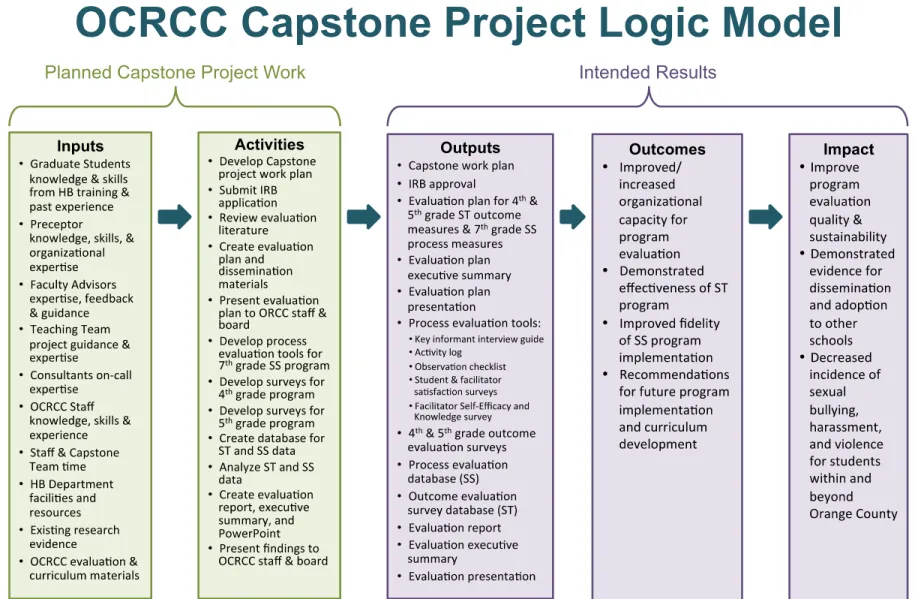
Over the course of the academic year, our Capstone team completed five deliverables: 1) an evaluation plan; 2) six process evaluation tools that assessed the 7th grade SS program implementation,
including the volunteer facilitator training implemented by OCRCC; 3) two student questionnaires for the 4th and 5th grade ST program outcomes; 4) an evaluation report of the 7th grade SS program; and 5) an
evaluation report for the 4th and 5th grade ST program. The Capstone Logic Model (Figure 1) provides a
3
4
The Capstone project culminated with two separate evaluation reports, one for the SS process evaluation and another for the ST outcome evaluation, as indicated in the Outputs column. Both
evaluation reports summarized our findings and recommendations that we then presented to the OCRCC board and staff. Through providing OCRCC a means to accurately document SS program implementation and measure the impact of the ST 4th and 5th grade curricula, the outcome of our work includes: improved
SS program fidelity and demonstrated effectiveness of ST program. The anticipated long-term impact of our work includes decreased incidence of sexual bullying, harassment, and violence for students within and beyond Orange County.
This summary report will provide the background on sexual violence perpetration and
victimization in the United States (US), including protective and risk factors that contribute to the public health problem, followed by a detailed explanation of the deliverables that we completed. The summary report will culminate with key findings from the Capstone experience, the impact of our work, and recommendations for sustaining evaluation of OCRCC CE programs in coming years.
Background
Prevalence and Health Impacts of Sexual Violence
Sexual violence (SV) is defined by the Centers for Disease Control and Prevention (CDC) as: “…any sexual act that is perpetrated against someone’s will. SV encompasses a range of offenses, including a completed nonconsensual sex act (i.e., rape), an attempted nonconsensual sex act, abusive sexual contact (i.e., unwanted touching), and non-contact sexual abuse (e.g., threatened sexual violence, exhibitionism, verbal sexual harassment)” (2009a).
5
(Truman & Planty, 2012). These figures do not account for underreporting, and are likely lower than the true prevalence rates.
Sexual violence can lead to significant adverse health outcomes. Immediately after the incident, 31.5% of women and 16.1% of men who were raped reported a resulting physical injury (CDC, 2012b). Moreover, victims report an increase in aggression, lack of trust, substance abuse, increased number and intensity of health complaints, post-traumatic stress disorder (PTSD), and suicidal ideation and attempts, as well as decreased self-esteem (Conoscenti & McNally, 2006; Schafran, 1996). In the mid-1990s, 3.8 million American women were diagnosed with rape-related PTSD, and 13% of all rape victims had attempted suicide (Schafran, 1996).
Sexual Violence Risk Factors
Individuals are at high risk of SV victimization during childhood and adolescence. In a 2011 survey of high school students, 11.8% of girls and 4.5% of boys reported that they had been forced to have sexual intercourse at some point in their lives (CDC, 2012a). Moreover, among adult rape victims, 12.3% of females and 27.8% of males were first raped before the age of 11, and 29.9% of females were first raped between the ages of 11-17 (Black et al., 2011). According to the federal Children’s Bureau, there were 61,149 officially substantiated reports of sexual abuse of minors in 2011 (U.S. Department of Health and Human Services, 2012). These statistics are especially concerning because childhood rape victimization may be a predisposing factor to future SV victimization and perpetration (CDC, 2009b). Several additional characteristics distinguish some people as more at risk for perpetrating SV. Males commit 99% of sexual assaults toward both females and other males (Barone, Wolgemuth, & Linder, 2007). In the first rape experience of females and males, 75% and 83.5% of perpetrators,
6
Sexual Violence Prevention Conceptual Framework
Organizations that work to prevent sexual violence conceptualize risk factors as a pyramid, in which attitudes and beliefs such as racism, sexism, and homophobia form the base; verbal expression through sexual harassment builds off of this base; and physical expressions, assault and homicide are at the pinnacle of sexual violence (Calgary Communities Against Sexual Abuse [CCASA], 2013). Together, these levels form the “Pyramid of Violence” model. The base levels are the most pervasive and frequent forms of SV, and at the top are the most infrequent; each level supports and can lead to the one above it (CCASA, 2013). In discussing when to intervene on these different levels, the CDC (2004) defines interventions as either taking place before violence occurs or after violence has already occurred (rather than primary, secondary, and tertiary prevention).
7
emerging evidence of an empirical link, bullying prevention that incorporates SV perpetration prevention could have an impact on both public health outcomes while still being palatable to early adolescent audiences.
Evaluation of Sexual Violence Prevention Programs in School-Based Settings
Interventions conducted in school settings are advantageous due to the ability to reach nearly all children, compared to interventions conducted in clinical settings (Topping & Barron, 2009). Research has demonstrated that sexual abuse prevention programs in schools have been effective in increasing knowledge and skills with regard to identifying inappropriate sexual conduct (Hazzard, Webb, Kleemeier, Angert, & Pohl, 1991; Hébert, Lavoie, Piché, & Poitras, 2001; MacIntyre & Carr, 1999; Tutty, 1997). An evaluation of a sexual abuse prevention program, called Who Do You Tell, found that providing children with more exposure to the intervention by making presentations longer and including interactive
components to the intervention such as role-playing, videos, and games would have a stronger impact on children, and lead to larger intervention effects such as gains in knowledge and/or skill (Tutty, 1997).
8
few SV prevention interventions, focused on the link between bullying, sexual harassment, and SV perpetration, have been evaluated (Espelage et al., 2013). Although several studies have been published about the conceptual link between bullying and SV, the implications for SV prevention outcomes have not yet been systematically demonstrated (Fredland, 2008; Lin, Raymond, Catallozzi, Ryan, & Rickert, 2007). Thus, it is important to evaluate school-based SV perpetration prevention programs that are based upon this conceptual link and Pyramid of Violence model.
Our Approach
Program evaluation is the only systematic method of determining the extent to which prevention programs have been carried out as originally intended and whether program outcome objectives have been achieved. Therefore, our Capstone team conducted systematic process and outcome evaluations of three curricula that target bullying, cyberbullying, and sexual harassment in relation to SV within a school-based, SV primary prevention program. Through these evaluations, OCRCC hopes to demonstrate that the precursors to SV perpetration can effectively be reduced in the school setting, leading to long-term reductions in sexual bullying, harassment, and violence.
Methods
9
programs and shared what they hoped to learn from the Capstone team’s work. They also shared materials from both programs with the team, including curricula, PowerPoint presentations used during class sessions, scripts for program facilitators, and past SS outcome evaluations. These meetings gave us the chance to meet various stakeholders, learn about other areas of OCRCC’s work, and orient the
stakeholders to the work we were doing with the organization. We worked closely with our preceptor and the CE coordinators to develop a feasible and sustainable evaluation plan for the three curricula. In November 2013, we presented our evaluation plan at an OCRCC staff meeting and Board of Directors meeting. During the project, progress updates were made through in-person meetings and weekly emails with the CE team, faculty advisors, and Capstone teaching team.
Safe Touch: 4
th& 5
thGrade Outcome Evaluation Methods
Although Safe Touch (ST) has been in schools for nearly 30 years, program impact on students has never been fully evaluated. In meetings with our preceptor and the ST education coordinator, our Capstone team helped develop a logic model for ST. To inform future revisions to ST curricula as well as program dissemination and adaptation to other communities, OCRCC enlisted our Capstone team to evaluate the short term outcomes of the ST program’s 4th and 5th grade curricula.
Safe Touch Data Collection
ST outcome evaluation data were collected via two different questionnaires, one for 4th graders
and one for 5th graders. With guidance from evaluation and questionnaire design experts, as well as our
coursework in questionnaire design, we developed evaluation tools to assess students’ knowledge, beliefs, self-efficacy, and behavioral intentions related to the ST program. The ST education coordinator gave input and reviewed outcome evaluation tools to ensure the questionnaires aligned with ST curriculum content. A small pilot test (n=6) was conducted among 4th and 5th graders to determine clarity and
10
administered questionnaires to students, and we strived to reduce administration burden by providing participating school personnel with user-friendly instructions. Questionnaire responses were anonymous.
We partnered with OCRCC to develop a strong yet feasible evaluation design to gather credible evidence of effectiveness that accommodated time and access constraints in a real-world setting. Collaboration prompted us to develop skills on how to clearly translate jargon, ideas and expectations with our community partners as we adapted evaluation research methods in order to lessen burden to our stakeholders. Doing so greatly benefited this interdisciplinary effort and opened up channels for
communication when technical issues arose for either party, or at the school-level. We used a pre-test post-test evaluation design with a comparison group, which gave the most useful information for
determining that any changes that occurred were a result of the ST program. Based on the ST presentation schedule and school feasibility, OCRCC assigned schools to intervention or comparison group. The comparison group received a delayed intervention following data collection. A total of 31 classrooms at two intervention and two comparison schools participated.
Safe Touch Data Management and Analysis
Data from both 4th and 5th grade questionnaires were managed in the same way. Data were
collected in December 2013 and February 2014, respectively. For both time periods, paper questionnaires were distributed to participating schools in folders, one for each classroom. OCRCC coordinated data collection with school personnel and returned completed questionnaires to us. We created electronic versions of the questionnaires in SurveyMonkey, along with corresponding codebooks, and were responsible for all data entry.
11
were analyzed with two-sample t-tests, while categorical binary dependent variables were analyzed through chi-square tests of independence. See Table B1 and Table B2 of Appendix B for total number of respondents surveyed.
Start Strong: 7
thGrade Process Evaluation Methods
In the fall of 2013, the Start Strong (SS) program transitioned to being implemented by several trained volunteer facilitators. In order to inform future training and program development, OCRCC enlisted our Capstone team to evaluate the implementation of the facilitator training and delivery of the SS program.
Start Strong Data Collection
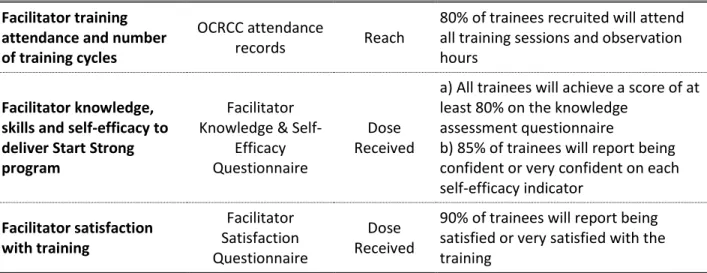
Data were collected for the Start Strong process evaluation using the tools (Table 1) developed by the Capstone Team in two stages. First, we evaluated the 11-day training of SS program trainees with the Facilitator Knowledge and Self-Efficacy Questionnaire and the Facilitator Satisfaction Questionnaire, which were designed based on the SS training curriculum and in collaboration with the Rape Prevention Education Coordinator (RPEC).
Table 1. Start Strong Process Tools Created by the Capstone Team for Deliverable 2
Process Tool Administration Process Constructs Assessed
(Process Evaluation Measure)
Facilitator Knowledge and Self-Efficacy Questionnaire
Facilitators anonymously completed the questionnaire via SurveyMonkey at the end of the 11 training sessions. The RPEC reviewed the responses to the items measuring knowledge and scored each of them as satisfactory (2), partially satisfactory (1), or unsatisfactory (0).
Facilitator knowledge, skills, and self-efficacy to deliver SS program (Dose Received)
Facilitator Satisfaction Questionnaire:
Facilitators anonymously completed the survey via SurveyMonkey at the end of the 11 training sessions.
Facilitator satisfaction with training (Dose Received)
Facilitator Activity Logs
Facilitators completed daily activity logs after delivery of each curriculum session in each classroom.
Implementation of intended number of program
components (Dose Delivered) Facilitating factors and barriers to delivery of program
components (Fidelity)
Observation Checklist
OCRCC staff observed each facilitator and utilized the checklist to assess the extent to which curriculum was delivered as intended according to protocol.
12
We then evaluated the facilitators’ delivery of the SS program using the Facilitator Activity Logs, Observation Checklists, and Student Satisfaction Questionnaires, which were based on the content covered by the curriculum and the RPEC’s identification of core components. Finally, our Capstone team developed a Key Informant Interview Guide based on OCRCC’s interest in evaluating school context and barriers and facilitators to implementing SS in schools.
Start Strong Data Management and Analysis
The trainees completed the Facilitator Knowledge and Self-Efficacy Questionnaire and the Facilitator Satisfaction Questionnaire directly in SurveyMonkey. The Facilitator Activity Logs, Observation Checklists, and the Student Satisfaction Questionnaires were all completed on paper. Our Capstone team created electronic versions of each tool in SurveyMonkey. We entered responses from the Facilitator Activity Logs and Observation Checklist, and an OCRCC intern entered the anonymous Student Satisfaction Questionnaires. Upon completion of this process, we exported all data from SurveyMonkey into Excel for analysis.
Our Capstone team used mixed methods to analyze the SS evaluation tools. Descriptive statistics such as frequency counts and means summarized quantitative information. In order to analyze the extent to which the objectives were met, we compared these descriptive statistics with various objectives set in the evaluation planning stage. These objectives included minimum passing scores on Facilitator
Knowledge and Self-efficacy Questionnaires. To view total number of respondents by evaluation tool, data sources, and predetermined objectives, please see Appendix C.
Student Satisfaction Questionnaire
Satisfaction questions were added to OCRCC’s existing post-test outcome questionnaire. Facilitators
administered the survey to students on the last day of program delivery.
Extent to which participants are receptive to and/or use materials (Dose Received)
Key Informant Interview Guide
The guide was not implemented as part of the Capstone project; a practicum student or OCRCC staff member or volunteer will conduct interviews with school guidance counselors and teachers at a future date.
13
Analysis and interpretation of qualitative data helped to explain what gaps existed in program implementation. We reviewed open-ended responses from the Facilitator Satisfaction Questionnaires, Facilitator Activity Logs, Observation Checklists, and Student Satisfaction Questionnaires in Excel to identify common themes about the facilitator training sessions and the implementation of the SS program. We maintained regular contact with the RPEC and our preceptor as we interpreted and drew conclusions from the results.
Methods for Reporting on the Evaluation
Our Capstone project culminated at the end of the school year with the development of two final evaluation reports, one for Safe Touch (ST) and one for Start Strong (SS). Clarity of the evaluation results was of great importance to our Capstone team, in order to ensure that the evaluation results would be accessible to a wide audience and thus usable by OCRCC. Each report had two lead writers, and a third Capstone team member was involved in both to oversee the language and formatting of both. Translating our field’s jargon proved to be a difficult skill to develop, but our faculty advisors offered sound advice and review through the process. In addition, we met with OCRCC staff and discussed the language of the findings, as well as the visual representations, to find the best method of reporting on the evaluation.
Dissemination of Findings
14
Results
Key results of our Capstone project include increased organizational capacity at OCRCC to conduct program evaluation, demonstrated effectiveness of the ST program, improved fidelity of Start Strong (SS) program implementation, and recommendations for future program implementation and curriculum development. We collaborated with OCRCC to effectively implement a process and outcome evaluation for the 2013-2014 school year, orienting staff members, school personnel, and stakeholders, including the Board of Directors, to the development of program evaluation. Our evaluation plan has detailed methods on how to conduct both process and outcome procedures. For future years, the evaluation plan is a resource from which OCRCC can adapt to form evaluation procedures for other grades of ST and SS or other programs offered at OCRCC. Furthermore, the evaluation tools we created will be usable in future iterations of ST and SS evaluation.
Through conducting an outcome evaluation of Safe Touch’s 4th and 5th grade curriculum, we were
able to measure short-term outcomes and provide OCRCC with recommendations for future curricula. For 4th grade, students who had the Safe Touch program had improved knowledge about respectful internet
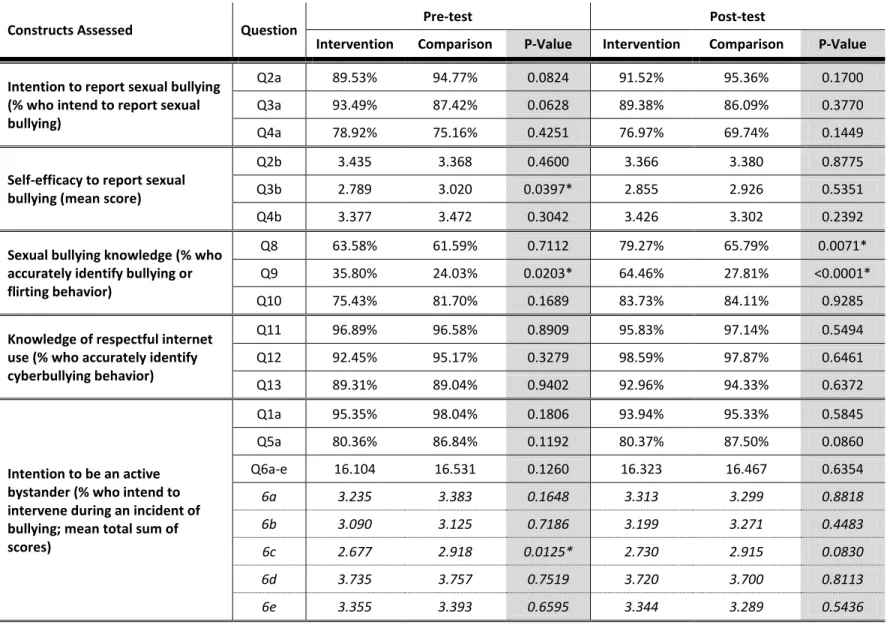
use and positive beliefs about reporting cyberbullying. For 5th grade, students who had the Safe Touch
program had improved knowledge about sexual bullying and positive beliefs about being an active bystander. However, the program may not be having as much of an impact on their self-efficacy and intention to engage in certain behaviors, such as reporting and intervening in a bullying situation, especially in different contexts (e.g. among friends or strangers). The 4th and 5th grade final outcome
evaluation report includes recommendations for incorporating theoretically-based strategies during ST curriculum revision, updating evaluation tools, and introducing process evaluation measures. Additional results for Safe Touch are available in Tables B3 and B4 of Appendix B.
The process evaluation of the 7th grade Start Strong curriculum enabled us to evaluate the
15
knowledge of curriculum content and class management techniques. Trainees were highly satisfied with the instructor and training materials. However, the facilitator training did not provide trainees with enough time to practice the skills they learned and build trainees’ confidence in their time and class management skills. With regard to implementing the SS curriculum, facilitators struggled to complete all curriculum components intended for the first three 45-minute sessions. However, all of the SS program components were completed by the fourth (final) session in 92% of classrooms. During our data collection period, the OCRCC staff observed two of the five volunteers who completed training and began facilitating in the classroom. Due to variation in observer ratings and the limited number of volunteers that were observed, results from the observer checklist were not able to be summarized until the remaining three facilitators are observed, and staff have had the opportunity to discuss consistency in ratings. Overall, students were satisfied with the program activities and with the facilitators. The Process Evaluation report provides recommendations for improving facilitator training in certain areas,
restructuring the schedule of the SS class sessions, and adapting process evaluation tools for other community education programs.
Discussion
Implications for OCRCC
The 2013-2014 school year was the first time systematic evaluation was conducted with OCRCC’s Safe Touch (SS) and Start Strong (SS) programs. Our evaluation results have a number of implications for the content of ST and SS curricula, as well as SS facilitator trainings. For ST, a greater emphasis on increasing students’ self-efficacy and behavioral intention surrounding ST program goals, such as intervening on or reporting an act of cyberbullying and sexual bullying, might be considered for the next iteration of ST. Based on our Capstone team’s final evaluation report, theory-based strategies could be incorporated to form skills practice components to the program. Our findings support the
16
as well as the need for more skills practice to impact students’ self-efficacy and intention. OCRCC may consider adding process evaluation elements to future ST evaluation components to collect additional insights on other anti-bullying campaigns occurring in schools and school climate factors that contribute to students’ self-efficacy and intention to act on certain behaviors.
Furthermore, SS process evaluation has provided useful information on how to enhance facilitator training and program implementation. Future SS facilitator trainings should spend additional time
allowing trainees to practice the skills they learned in order to build their self-efficacy to effectively manage class time and teach all of the curriculum content. OCRCC should also consider revising the schedule of SS program components to reflect the actual amount of time it takes facilitators to deliver them. This will improve cohesiveness of each session, reduce time facilitators must spend reviewing components from previous sessions, and increase facilitators’ confidence in their ability to deliver
program components in the allotted time. As more facilitators are trained to deliver SS, process evaluation tools will help the RPEC determine the fidelity of SS program implementation across schools.
Evaluation results from the 2013-2014 school year demonstrate OCRCC’s recognition of evaluation as a valuable process for assessing programmatic impact and implementation. This year’s results may be used to supplement funding requests for ST and SS. Eventually, this data will support efforts to disseminate ST and SS to other communities, as there would be records of efficacy for ST and recommendations for SS implementation. The completed evaluation bolsters OCRCC’s capacity to conduct evaluation, as the organization now has an adaptable evaluation plan and evaluation tools.
Project Limitations
There were limitations to the Capstone project and several strategies would have helped strengthen the work and the evaluation results. Both the 4th and 5th grade ST questionnaires could have
17
and aggregated by classroom. The ability to link pre and post-test data at the individual level would greatly strengthen the ability to draw conclusions regarding intervention effects.
For the SS process evaluation, facilitator training could have been improved if we had been able to give tailored versions of the Facilitator Satisfaction Questionnaire to trainees after each training session, rather than one questionnaire at the end of the training period. These satisfaction questionnaires also would have been more useful if we had been able to intentionally plan for them to complement exit interviews conducted by the SS education coordinator. Additionally, in order to protect respondent anonymity, we did not ask SS trainees to identify themselves when completing the Facilitator Knowledge and Self-Efficacy Questionnaire, the Facilitator Satisfaction Questionnaire, or the Facilitator Activity Logs. Due to this anonymity we could not identify which trainees needed further training, nor connect trainee’s knowledge and self-efficacy scores to their performance in classes. And finally, time constraints involved in the Capstone project created limitations in the amount of data that we collected.
Recommended Next Steps
We acknowledge that OCRCC, with its extensive programmatic efforts and limited resources, may face challenges in conducting large-scale systematic evaluations of their programs in the future. The final evaluation reports have written next steps for incorporating recommendations to strengthen both Safe Touch (ST) and Start Strong (SS). It is our hope that OCRCC continues to evaluate ST and SS. Conducting evaluation on a smaller scale may reduce burden on staff and volunteers while still gaining important data for future programmatic efforts. The ST evaluation may occur with fewer classrooms, for instance. Process evaluation elements can be incorporated as a part of regular program activities and serve as another means to monitor the inputs and outputs of OCRCC’s programs. In moving forward, we recommend OCRCC assess their capacity to incorporate recommendations from the 2013-2014
18
Considerations for Sustainability
Given the time and resource intensive nature of evaluation, sustainability efforts must focus on building organization capacity for program evaluation. The evaluation plan provides a framework for future evaluation, as the design and schedule may be adapted according to the needs of OCRCC. They may also broaden the scope of ST and SS program evaluation by adapting the evaluation design and tools and creating a process evaluation for ST and outcome evaluation for SS. Evaluation tools include relevant instructions and administrative protocols that can be updated for every program cycle. The Capstone team’s deliverables will be valuable to OCRCC in capacities beyond the limitations of a one-year project.
Impacts on Team
The Capstone experience has had a significant impact on the student team professionally. Time and resource constraints challenged us to adapt the rigorous, scientific standards of our training to the feasibility of evaluation with school-based programs. The responsibilities of leading an evaluation plan, creating tools and user-friendly administrative protocols, inputting and analyzing data, and producing comprehensive reports on the evaluation findings, allowed the student team to grow professionally beyond what we learned in the classroom. Our deliverables had clear purpose and contributed to Safe Touch and Start Strong programs. OCRCC provided a rich learning environment, with established in-school programs and stakeholder relationships, which became crucial to our professional experience as we collaborated to reach a common goal. Most of all, OCRCC’s mission and dedication to sexual violence prevention fortified our passion for public health and collaboration across professional fields.
Conclusion
19
development of our evaluation plan and tools, we hoped to strengthen OCRCC’s capacity to evaluate their programs as the organization continues to demonstrate the efficacy of ST and fidelity of SS
implementation. Continued efforts for evaluation will support the agency’s goal of disseminating their programs to other communities. From this work, we hope to see a decreased incidence of sexual bullying, harassment, and violence for students within and beyond Orange County. Through this intensive,
20
References
Barone, R., Wolgemuth, J., & Linder, C. (2007). Preventing sexual assault through engaging college men. Journal of College Student Development, 48(5), 585-594. doi:10.1353/csd.2007.0045
Basile, K. C., Espelage, D. L., Rivers, I., McMahon, P. M., & Simon, T. R. (2009). The theoretical and empirical links between bullying behavior and male sexual violence perpetration. Aggression and Violent Behavior, 14(5), 336-347.
doi:http://dx.doi.org.libproxy.lib.unc.edu/10.1016/j.avb.2009.06.001
Black, M. C., Basile, K. C., Breiding, M. J., Smith, S. G., Walters, M. L., Merrick, M. T., . . . Stevens, M. R. (2011). The national intimate partner and sexual violence survey (NISVS): 2010 summary report. (). Atlanta, Georgia: CDC.
Calgary Communities Against Sexual Abuse [CCASA]. (2013). VIOLENCE PYRAMID. Retrieved from http://ccasayourworld.com/get_the_facts/violence_pyramid/
Centers for Disease Control and Prevention. (2004). Sexual violence prevention: Beginning the dialogue. (Report). Atlanta, Georgia: Centers for Disease Control and Prevention.
Centers for Disease Control and Prevention. (2008). Sexual violence: Facts at a glance. (Data Sheet). Atlanta, Georgia: Centers for Disease Control and Prevention.
Centers for Disease Control and Prevention. (2009a). Sexual violence: Definitions. Retrieved from http://www.cdc.gov/violenceprevention/sexualviolence/definitions.html
Centers for Disease Control and Prevention. (2009b). Sexual violence: Risk and protective factors. Retrieved from http://www.cdc.gov/violenceprevention/sexualviolence/riskprotectivefactors.html Centers for Disease Control and Prevention. (2012a). 1991-2011 high school youth risk behavior survey
data. Retrieved from http://apps.nccd.cdc.gov/youthonline
Centers for Disease Control and Prevention. (2012b). Sexual violence: Facts at a glance. ( No. Data Sheet). Atlanta, Georgia: Centers for Disease Control and Prevention.
Connolly, J., Pepler, D., Craig, W., & Taradash, A. (2000). Dating experiences of bullies in early adolescence. Child Maltreatment, 5(4), 299-310. Retrieved from
http://cmx.sagepub.com/content/5/4/299.abstract
Conoscenti, L. M., & McNally, R. J. (2006). Health complaints in acknowledged and unacknowledged rape victims. Journal of Anxiety Disorders, 20(3), 372-379.
doi:http://dx.doi.org.libproxy.lib.unc.edu/10.1016/j.janxdis.2005.03.001
21
Espelage, D. L., & Holt, M. K. (2007). Dating violence & sexual harassment across the bully-victim continuum among middle and high school students. Journal of Youth and Adolescence, 36(6), 799-811. doi:10.1007/s10964-006-9109-7
Espelage, D. L., Low, S., Polanin, J. R., & Brown, E. C. (2013). The impact of a middle school program to reduce aggression, victimization, and sexual violence. Journal of Adolescent Health, 53(2), 180-186. doi:http://dx.doi.org.libproxy.lib.unc.edu/10.1016/j.jadohealth.2013.02.021
Finkelhor, D. (2009). The prevention of childhood sexual abuse. The Future of Children, 19(2), 169-194. Fredland, N. M. (2008). Sexual bullying: Addressing the gap between bullying and dating violence.
Advances in Nursing Science, 31(2), 95–105. doi:10.1097/01.ANS.0000319560.76384.8a
Greenberg, M. T. (2004). Current and future challenges in school-based prevention: The researcher perspective. Prevention Science, 5(1), 5-13.
Greenberg, M. T., Weissberg, R. P., O'Brien, M. U., Zins, J. E., Fredericks, L., Resnik, H., & Elias, M. J. (2003). Enhancing school-based prevention and youth development through coordinated social, emotional, and academic learning. American Psychologist, 58(6-7), 466-474. doi:10.1037/0003-066X.58.6-7.466
Hazzard, A., Webb, C., Kleemeier, C., Angert, L., & Pohl, J. (1991). Child sexual abuse prevention: Evaluation and one-year follow-up. Child Abuse & Neglect, 15(1–2), 123-138.
doi:http://dx.doi.org/10.1016/0145-2134(91)90097-W
Hébert, M., Lavoie, F., Piché, C., & Poitras, M. (2001). Proximate effects of a child sexual abuse prevention program in elementary school children. Child Abuse & Neglect, 25(4), 505-522. doi:http://dx.doi.org/10.1016/S0145-2134(01)00223-X
Lin, A. J., Raymond, M., Catallozzi, M., Ryan, O., & Rickert, V. I. (2007). Relationship violence in adolescence. Adolescent Medicine: State of the Art Reviews, 18(3), 530-43.
MacIntyre, D., & Carr, A. (1999). Evaluation of the effectiveness of the stay safe primary prevention programme for child sexual abuse. Child Abuse & Neglect, 23(12), 1307-1325.
doi:http://dx.doi.org/10.1016/S0145-2134(99)00092-7
Morrison, S., Hardison, J., Mathew, A., & O'Neil, J. (2004). An evidence-based review of sexual assault preventive intervention programs [technical report]. Unpublished manuscript.
Orange County Rape Crisis Center (2013a). About. Retrieved from http://ocrcc.org/about/ Orange County Rape Crisis Center (2013b). Community education. Retrieved from http://ocrcc.org/services/programs/
Pellegrini, A. D. (2001). A longitudinal study of heterosexual relationships, aggression, and sexual harassment during the transition from primary school through middle school. Journal of Applied Developmental Psychology, 22(2), 119-133.
22
Pepler, D. J., Craig, W. M., Connolly, J. A., Yuile, A., McMaster, L., & Jiang, D. (2006). A
developmental perspective on bullying. Aggressive Behavior, 32(4), 376-384. doi:10.1002/ab.20136 Schafran, L. H. (1996). Rape is a major public health issue. American Journal of Public Health, 86(1),
15-17. doi:10.2105/AJPH.86.1.15
Topping, K. J., & Barron, I. G. (2009). School-based child sexual abuse prevention programs: A review of effectiveness. Review of Educational Research, 79(1), 431-463. Retrieved from
http://www.jstor.org/stable/40071171
Truman, J. L., & Planty, M. (2012). Criminal victimization, 2011. (bulletin No. NCJ 239437). Rockville, MD: Justice Statistics Clearinghouse/NCJRS.
Tutty, L. M. (1997). Child sexual abuse prevention programs: Evaluating who do you tell. Child Abuse & Neglect, 21(9), 869-881. doi:http://dx.doi.org.libproxy.lib.unc.edu/10.1016/S0145-2134(97)00048-3
U.S. Department of Health and Human Services. (2012). Child maltreatment 2011[report]. Retrieved from http://www.acf.hhs.gov/sites/default/files/cb/cm11.pdf
Vreeman, R. C., & Carroll, A. E. (2007). A systematic review of school-based interventions to prevent bullying. Archives of Pediatrics & Adolescent Medicine, 161(1), 78-88.
doi:10.1001/archpedi.161.1.78
Ybarra, M. L., Espelage, D. L., & Mitchell, K. J. (2007). The co-occurrence of internet harassment and unwanted sexual solicitation victimization and perpetration: Associations with psychosocial indicators. Journal of Adolescent Health, 41(6, Supplement), S31-S41.
I
Appendix A: Deliverable Tables
Table A1. Deliverable 1: Evaluation Plan for Safe Touch & Start Strong
Deliverable I: Evaluation Plan
Format: 23-page Word document; 10-minute PowerPoint presentation; 1-page executive summary
Purpose: To outline specific tasks for conducting outcome evaluation of Safe Touch 4th and 5th grade program and process evaluation of Start Strong 7th grade
program Intended
Audience(s):
OCRCC Community Education (CE) Team and the OCRCC Board of Directors
Activities: Reviewed current CE evaluation plan, Safe Touch curriculum and Start Strong curriculum
Developed logic models for Safe Touch and Start Strong logic models Clarified evaluation focus with feedback collected from CE team Identified potential evaluation designs and their strengths and
weaknesses
Collected feedback from evaluation experts on potential evaluation designs
Collected feedback from CE team on the feasibility of implementing the evaluation design in Safe Touch schools
Developed draft of evaluation plan
Collected feedback from evaluation experts on evaluation plan Final evaluation plan reviewed and approved by CE team Created PowerPoint presentation and 1-page executive summary Disseminated the evaluation plan to OCRCC in October 2013
Disseminated PowerPoint presentation and 1-page executive summary to OCRCC Board members and staff in November 2013
Recommendations: OCRCC should continue to adapt the evaluation plan for Safe Touch outcome evaluation and Start Strong process evaluation every school year.
OCRCC should begin to develop process evaluation procedures for Safe Touch and outcome evaluation procedures for Start Strong, based on the evaluation plan’s framework.
II
Table A2. Deliverable II: Process Evaluation Tool for 7
thGrade Start Strong
Deliverable II: Mixed Methods Process Evaluation Tools
Format: a. Three-page Facilitator Satisfaction Survey with 22 Likert scale items and five open-ended questions
b. Three-page Facilitator Training Assessment with 17 Likert scale items and ten open-ended questions
c. Four two-page Activity Logs with a checklist for each activity in the lesson and six open-end questions
d. Two-page Facilitator Observation Checklist with 16 Likert scale items, five lesson-specific Likert scale items, and space for notes
e. Two-page Student Satisfaction Survey with 12 Likert scale items, two open-ended questions, and three categorical questions.
f. 4-page Key Informant Interview Guide with 24 questions.
Purpose: To assess the extent to which the 7th grade component of Start Strong is
being implemented as designed, including satisfaction with and facilitators and barriers to facilitator training; facilitator knowledge and self-efficacy to deliver the curriculum; program fidelity and dose delivered during
implementation; student satisfaction with program delivery; and context in which the program is being implemented
Intended Audience(s):
Rape prevention education program coordinator (RPEC) and volunteer program facilitators
Activities: Reviewed sexual violence primary prevention literature to understand core components of the program
Researched applicable process evaluation instruments
Collected core components of facilitator training and 7th grade Start
Strong curriculum from RPEC
Created Facilitator Satisfaction Survey
Collected feedback on survey from evaluation expert Created Facilitator Training Assessment
Collected feedback on assessment from RPEC Created Activity Logs
Collected feedback on activity logs from RPEC Created Facilitator Observation Checklist
Collected feedback on observation checklist from RPEC Created Student Satisfaction Survey
Collected feedback on survey from evaluation expert Created Key Informant Interview Guide
Collected feedback from qualitative research expert
Disseminated tools a-e to OCRCC to be used by the RPEC and the volunteer program facilitators starting in November 2013
Disseminated interview guide to OCRCC to be used in the future Recommendations: RPEC should provide a modified facilitator satisfaction survey to the
volunteers after each training session so that feedback can be used in real time throughout the training.
III
as to be able to assist those volunteers who are still struggling with the training material.
SS volunteers should be encouraged to give honest and thorough feedback when filling out the facilitator satisfaction survey and the activity logs in order to help make the program as efficacious as possible.
All OCRCC staff that conducts the facilitator observations should review the instructions to make sure there is consistency between the observers at each facilitator observation.
RPEC should review activity logs, observation checklists, and student satisfaction surveys as they are completed in order to identify strengths and weaknesses in program implementation or curriculum in real time. RPEC should share information collected in the process tools with all
pertinent staff or volunteers as a way to troubleshoot problem areas and reinforce strengths.
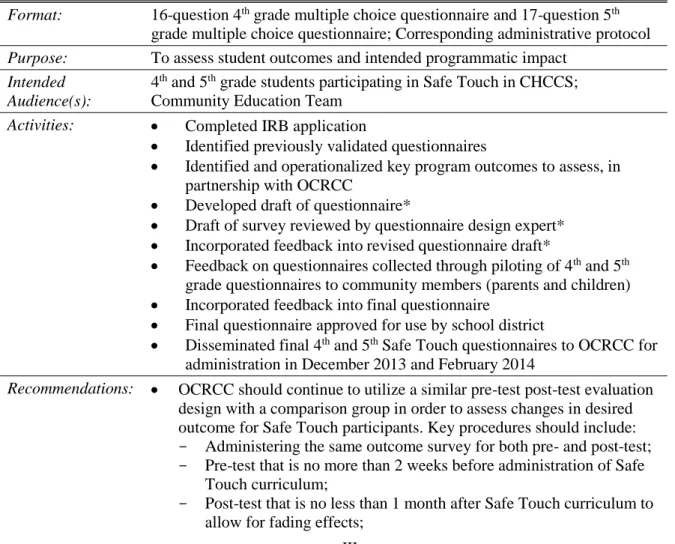
Table A3. Deliverable III: Student Questionnaires for Safe Touch Outcome Evaluation
Deliverable III: Quantitative Questionnaires for 4th and 5th Grade Safe Touch Program
Format: 16-question 4th grade multiple choice questionnaire and 17-question 5th
grade multiple choice questionnaire; Corresponding administrative protocol Purpose: To assess student outcomes and intended programmatic impact
Intended Audience(s):
4th and 5th grade students participating in Safe Touch in CHCCS;
Community Education Team Activities: Completed IRB application
Identified previously validated questionnaires
Identified and operationalized key program outcomes to assess, in partnership with OCRCC
Developed draft of questionnaire*
Draft of survey reviewed by questionnaire design expert* Incorporated feedback into revised questionnaire draft*
Feedback on questionnaires collected through piloting of 4th and 5th
grade questionnaires to community members (parents and children) Incorporated feedback into final questionnaire
Final questionnaire approved for use by school district
Disseminated final 4th and 5th Safe Touch questionnaires to OCRCC for
administration in December 2013 and February 2014
Recommendations: OCRCC should continue to utilize a similar pre-test post-test evaluation design with a comparison group in order to assess changes in desired outcome for Safe Touch participants. Key procedures should include: - Administering the same outcome survey for both pre- and post-test; - Pre-test that is no more than 2 weeks before administration of Safe
Touch curriculum;
IV
- A smaller sample size is recommended in order to maintain feasibility and sustainability
OCRCC should consult with school district and key school-specific personnel to ensure the feasibility of and support for evaluation activities.
OCRCC should update the questionnaire administration protocols based on changes to the evaluation design and effective administration
practices within the school (e.g. read questionnaire out loud to students). OCRCC staff should prepare envelopes with labels and questionnaires
for participating schools.
OCRCC staff/volunteers and school personnel who administer
questionnaires to students should spend time becoming familiar with the appropriate administration protocol.
If changes are made to Safe Touch curriculum, revision of the questionnaires should be completed by OCRCC staff or other questionnaire development consultant.
Table A4. Deliverable IV: 7
thGrade Start Strong Evaluation Report & Presentation
Deliverable IV: 7th Grade Start Strong Evaluation Report and Presentation
Format: Electronic databases (Excel and SurveyMonkey), 20-page Word document comprehensive report, 1-page executive summary report, 15-minute PowerPoint presentation
Purpose: To summarize the completed process evaluation and data gathered for OCRCC and community stakeholders; provide OCRCC with
recommendations for how to enhance their sexual violence prevention strategies, and inform school personnel about strategies for sexual violence prevention
Intended Audience(s):
OCRCC staff, Board of Directors, and community stakeholders
Activities: Created electronic databases for managing SS process evaluation tools Tested electronic databases by entering in data and producing sample
Excel spreadsheets for analysis
Reviewed data entry protocol’s specific instructions Entered in data from 8 Observation Checklists Entered in data from 71 Activity Logs
Conducted descriptive statistics on data collected from 8 Facilitator Knowledge and Self-Efficacy Questionnaires
Conducted descriptive statistics on data collected from 8 Facilitator Satisfaction Questionnaires
Conducted descriptive statistics on data collected from 375 Student Satisfaction Questionnaires
V
Conducted descriptive statistics on data collected from Activity Logs Drafted final evaluation report with key findings
Final evaluation report draft reviewed by evaluation experts
Produced PowerPoint presentation summarizing final evaluation report Disseminated final evaluation report and executive summary to OCRCC
staff and Board of Director members, and other community stakeholders
Presented final evaluation PowerPoint presentation to OCRCC staff and Board of Directors in April 2014
Recommendations: SS coordinator should consider using evaluation results to inform 7th
grade SS curriculum revision.
SS coordinator should consider using evaluation results to inform facilitator training curriculum revision.
SS coordinator should consider making Facilitator Knowledge and Self-Efficacy Questionnaire identifiable by respondents.
SS coordinator should consider updating self-efficacy process
objectives outlined in evaluation plan based on the number of volunteer facilitators recruited each year.
Table A5. Deliverable V: 4
th& 5
thGrade Safe Touch Evaluation Report & Presentation
Deliverable V: 4th & 5th Grade Safe Touch Evaluation Report and Presentation
Format: Electronic databases (Excel and SurveyMonkey), 20-page Word document comprehensive report, 1-page executive summary report, 15-minute PowerPoint presentation
Purpose: To summarize the completed outcome evaluation project and data gathered for OCRCC and community stakeholders; provide OCRCC with
recommendations for how to enhance their sexual violence prevention strategies, and inform school personnel about strategies for sexual violence prevention
Intended Audience(s):
OCRCC staff, Board of Directors, and community stakeholders
Activities: Created electronic databases for managing data from ST evaluation tools Tested electronic databases by entering in data and producing sample
Excel spreadsheets for importation into SAS
Developed 4th and 5th grade codebooks for ST questionnaires
Reviewed data entry protocol’s specific instructions
Entered in pretest data from 301 4th grade respondents and 330 5th grade
respondents
Wrote preliminary data analysis plans
Cleaned and imported pre-test Excel spreadsheet into SAS 9.3 Produced baseline descriptive statistics for demographics Produced Cronbach’s alpha for series of questions
Entered in posttest data from 297 4th grade respondents and 319 5th grade
respondents
VI Finalized data analysis plans
Conducted bivariate analyses of ST evaluation data for differences between groups at pretest and posttest
Reviewed and interpreted findings
Drafted final evaluation report with key findings
Final evaluation report draft reviewed by evaluation experts
Produced PowerPoint presentation summarizing final evaluation report Disseminated final evaluation report and executive summary to OCRCC
staff and Board of Director members, and other community stakeholders Presented final evaluation PowerPoint presentation to OCRCC staff and
Board of Directors in April 2014
Recommendations: ST coordinator should consider using evaluation results to inform curriculum revision for content areas in need of strengthening. ST coordinator should use evaluation results to further clarify
curriculum goals and intended outcomes in the logic model. OCRCC should increase its ability to assess changes in knowledge,
VII
Appendix B: Safe Touch Evaluation
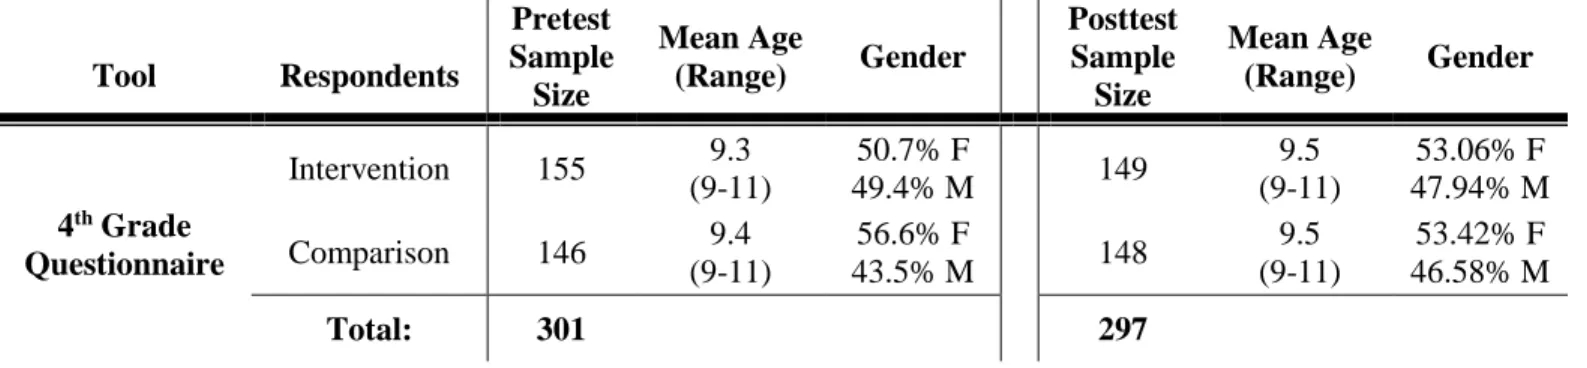
Table B1. Number of Respondents for 4
thGrade Safe Touch Outcome Evaluation
Tool Respondents
Pretest Sample Size
Mean Age
(Range) Gender
Posttest Sample Size
Mean Age
(Range) Gender
4th Grade
Questionnaire
Intervention 155 9.3 (9-11)
50.7% F
49.4% M 149
9.5 (9-11)
53.06% F 47.94% M
Comparison 146 9.4
(9-11)
56.6% F
43.5% M 148
9.5 (9-11)
53.42% F 46.58% M
Total: 301 297
Table B2. Number of Respondents for 5
thGrade Safe Touch Outcome Evaluation
Tool Respondents
Pretest Sample Size
Mean Age
(Range) Gender
Posttest Sample Size
Mean Age
(Range) Gender
5th Grade
Questionnaire
Intervention 176 10.2 (9-12)
47.7% F
51.7% M 166
10.5 (9-12)
50.60% F 48.19% M
Comparison 154 10.3
(9-12)
40.9% F
59.1% M 153
10.5 (10-12)
37.91% F 61.44% M
VIII
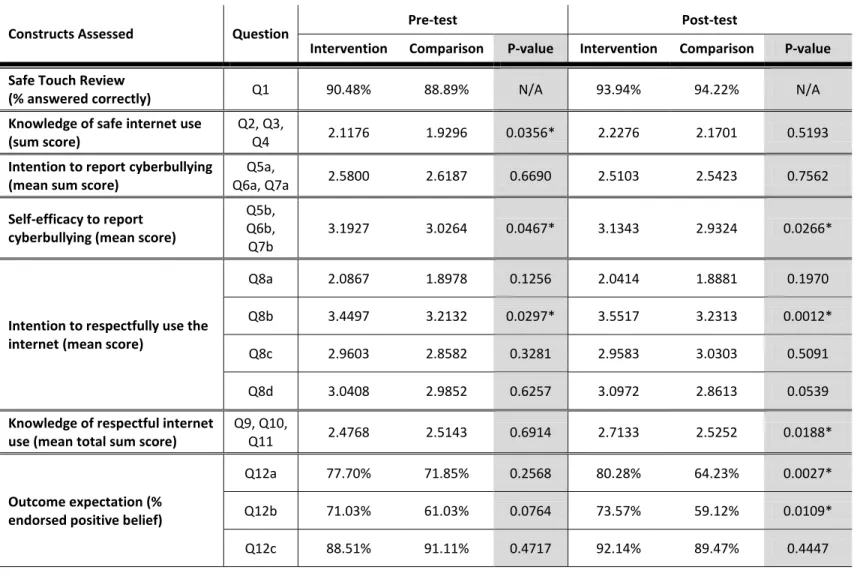
Table B3. 4
thGrade Safe Touch Indicators and Results
Constructs Assessed Question Pre-test Post-test
Intervention Comparison P-value Intervention Comparison P-value
Safe Touch Review
(% answered correctly) Q1 90.48% 88.89% N/A 93.94% 94.22% N/A
Knowledge of safe internet use (sum score)
Q2, Q3,
Q4 2.1176 1.9296 0.0356* 2.2276 2.1701 0.5193
Intention to report cyberbullying (mean sum score)
Q5a,
Q6a, Q7a 2.5800 2.6187 0.6690 2.5103 2.5423 0.7562
Self-efficacy to report cyberbullying (mean score)
Q5b, Q6b, Q7b
3.1927 3.0264 0.0467* 3.1343 2.9324 0.0266*
Intention to respectfully use the internet (mean score)
Q8a 2.0867 1.8978 0.1256 2.0414 1.8881 0.1970 Q8b 3.4497 3.2132 0.0297* 3.5517 3.2313 0.0012* Q8c 2.9603 2.8582 0.3281 2.9583 3.0303 0.5091 Q8d 3.0408 2.9852 0.6257 3.0972 2.8613 0.0539
Knowledge of respectful internet use (mean total sum score)
Q9, Q10,
Q11 2.4768 2.5143 0.6914 2.7133 2.5252 0.0188*
Outcome expectation (% endorsed positive belief)
IX
Table B4. 5
thGrade Safe Touch Indicators and Results
Constructs Assessed Question Pre-test Post-test
Intervention Comparison P-Value Intervention Comparison P-Value
Intention to report sexual bullying (% who intend to report sexual bullying)
Q2a 89.53% 94.77% 0.0824 91.52% 95.36% 0.1700 Q3a 93.49% 87.42% 0.0628 89.38% 86.09% 0.3770 Q4a 78.92% 75.16% 0.4251 76.97% 69.74% 0.1449
Self-efficacy to report sexual bullying (mean score)
Q2b 3.435 3.368 0.4600 3.366 3.380 0.8775 Q3b 2.789 3.020 0.0397* 2.855 2.926 0.5351 Q4b 3.377 3.472 0.3042 3.426 3.302 0.2392
Sexual bullying knowledge (% who accurately identify bullying or flirting behavior)
Q8 63.58% 61.59% 0.7112 79.27% 65.79% 0.0071* Q9 35.80% 24.03% 0.0203* 64.46% 27.81% <0.0001* Q10 75.43% 81.70% 0.1689 83.73% 84.11% 0.9285
Knowledge of respectful internet use (% who accurately identify cyberbullying behavior)
Q11 96.89% 96.58% 0.8909 95.83% 97.14% 0.5494 Q12 92.45% 95.17% 0.3279 98.59% 97.87% 0.6461 Q13 89.31% 89.04% 0.9402 92.96% 94.33% 0.6372
Intention to be an active bystander (% who intend to intervene during an incident of bullying; mean total sum of scores)
Q1a 95.35% 98.04% 0.1806 93.94% 95.33% 0.5845 Q5a 80.36% 86.84% 0.1192 80.37% 87.50% 0.0860 Q6a-e 16.104 16.531 0.1260 16.323 16.467 0.6354
6a 3.235 3.383 0.1648 3.313 3.299 0.8818
6b 3.090 3.125 0.7186 3.199 3.271 0.4483
6c 2.677 2.918 0.0125* 2.730 2.915 0.0830
6d 3.735 3.757 0.7519 3.720 3.700 0.8113
X
Self-efficacy to be an active bystander (mean score)
Q1b 3.124 3.188 0.4855 3.147 3.230 0.3883 Q5b 3.189 3.243 0.6008 3.070 3.320 0.0218*
Behavioral belief about being an active bystander (mean score)
XI
Appendix C: Start Strong Process Evaluation
Table C1. Number of Respondents for Start Strong Process Evaluation
Tool Respondents
Number of Respondents
Facilitator Knowledge &
Self-Efficacy Questionnaire SS Facilitators 8
Facilitator Satisfaction
Questionnaire SS Facilitators 8
Facilitator Activity Logs SS Facilitators 71
Observation Checklist OCRCC Staff 8 (4 sessions x
2 Facilitators)
Student Satisfaction
Questionnaire 7
th grade students 375
Key Informant Interview Guide School guidance counselors &
XII
Table C2. Process Evaluation Indicators and Data Sources
Construct Measured Data Sources /
Evaluation Tools
Process Evaluation
Measure
Process Objective
EQ: To what extent is the facilitator training being carried out in way in which it was intended?
Facilitator training attendance and number of training cycles
OCRCC attendance
records Reach
80% of trainees recruited will attend all training sessions and observation hours
Facilitator knowledge, skills and self-efficacy to deliver Start Strong program
Facilitator Knowledge &
Self-Efficacy Questionnaire
Dose Received
a) All trainees will achieve a score of at least 80% on the knowledge
assessment questionnaire
b) 85% of trainees will report being confident or very confident on each self-efficacy indicator Facilitator satisfaction with training Facilitator Satisfaction Questionnaire Dose Received
90% of trainees will report being satisfied or very satisfied with the training
EQ: To what extent is the Start Strong 7th grade program carried out in the way in which it was
intended?
Implementation of intended number of program components
Activity Logs Dose
Delivered
95% of program components are delivered by every facilitator
Facilitating factors and barriers to delivery of program components
Activity Logs Fidelity
All facilitators will identify facilitating factors and barriers to delivering all components of program as intended
Quality of the
implementation of the intervention
Observation
Checklist Fidelity
90% of volunteers will have
implemented the program curriculum as intended
Extent to which students are receptive to and/or use materials
Student Satisfaction Questionnaire
Dose Received
85% of students will report being somewhat or very satisfied with program activities.
EQ: In what ways does the school context affect the implementation of the activities of the program?
School staff’s experience with the program
Key informant
interviews Context