Managing Risk and Promoting Success:
How Microfinance Lenders Can Better Utilize Borrower
Insights for Collateral Strategy
Mohammed Hedadji
An honors thesis submitted to the faculty of the
Kenan Flagler Business School at the
University of North Carolina at Chapel Hill
Chapel Hill
2017
I.! ABSTRACT
Mohammed Hedadji
The Impact of Collateral Structure on Microfinance Lending (Under the direction of Dr. Olga Hawn)
At its conception, microfinance was a lending mechanism designed to alleviate poverty by providing group-structured lending to those who could not otherwise receive financing. As it has spread into new markets, microfinance lending has grown and changed significantly — especially as the model was adopted in the United States. While its goal is still to fund and empower entrepreneurial ventures by lending to the poor, the payment and collateral structure of microfinance in the U.S. is drastically different from the original microfinance model established by the Grameen Bank in Bangladesh.
The most notable difference, the lack of social collateral, has contributed to higher default rates (and thus, higher operating costs) and slower growth among microfinance institutions in the U.S., relative to much of the world. Higher default rates are important because they have pushed U.S. micro-lenders to find new ways to mitigate the risk of these loans, including the use of individual lending models and/or physical collateral. Prior literature has discussed the various forms of collateral available to microlenders, their potential uses in the U.S., and the impact of each on operating costs and margins. But there has been little research conducted surrounding lender meetings/interactions as a potential form of collateral. Furthermore, little research has been done to quantify the effectiveness and importance of these forms of collateral from the borrower’s
To address these gaps, I conducted research with borrowers from two microlending institutions: The North Carolina Rural Center and The Women’s
Microfinance Initiative of Uganda. I selected these two lenders to compare and contrast
different loan features and collateral tools in a domestic and international setting.
Additionally, the two samples represented one struggling microlender (NC Rural Center) and one successful high-growth lending institution (WMI-Uganda). My findings
suggested that more frequent lender meetings/interactions can potentially help reduce late/missed loan payments. Additionally, my findings indicated that incremental
I.! TABLE OF CONTENTS
I. ABSTRACT ... ii
II. INTRODUCTION ... 1
A. Research Question ... 1
B. My Interest in Microfinance ... 1
III. OVERVIEW OF MICROFINANCE ... 3
A. Microfinance Definition ... 3
B. History of Microfinance ... 3
C. Microfinance in the United States ... 4
D. NC Rural Center ... 9
IV. LITERATURE REVIEW ... 11
A. Group vs. Individual Lending Structure ... 11
B. Social Collateral in the United States ... 14
C. Other Risk-Mitigating Tools ... 18
D. Applying These Tools in the U.S. ... 21
E. Conclusion ... 22
V. RESEARCH METHODOLOGY... 23
A. Data Selection ... 24
B. Data Analysis ... 30
C. Limitations ... 37
VI. RESULTS ... 39
B. Multiple Regression Calculations ... 43
C. Single Regression Calculations ... 45
D. Qualitative Results ... 48
VII. DISCUSSION ... 52
A. Key Findings ... 52
B. Key Takeaways ... 53
VIII. RECOMMENDATIONS ... 56
A. Increasing Lender Meetings/Interactions ... 56
B. Home/Property Collateral ... 57
C. Business/Professional Development Courses: ... 57
D. Continuing Borrower Studies ... 57
E. Caveat: Operating Costs ... 58
IX. CONCLUSION ... 59
LIST OF TABLES
LIST OF FIGURES
II.! INTRODUCTION
Microfinance is a popular lending solution for low-income and developing
regions of the world. This lending solution has grown considerably since its inception and is projected to continue to grow at an average of 19.3% until 2019 (Hug, C., 2014). However, microfinance institutions (MFIs) vary significantly with with respect to success and lending strategy across different regions. As a relatively young lending solution, microfinance has not yet been studied as thoroughly as older lending functions. Most studies focus on the performance or impact of microfinance within a country, region, or specific MFI, with the existence of some notable global comparative studies. Limited customer-focused research has been conducted within the space.
A.!Research Question
This study seeks to answer the question of how MFI lending strategies — specifically implemented loan features and collateral structures — impact borrowers’ perception and motivation to repay. Borrower surveys were conducted on groups from the United States (The NC Rural Center) and Uganda (Women’s Microfinance Initiative) to assess the importance of various forms of collateral from the customer’s perspective and to draw correlations between loan features, borrower perception, and repayment.
Survey results were analyzed quantitatively and qualitatively and used to form conclusions and provide recommendations to The NC Rural Center and U.S. MFIs in general on improving lending strategy and loan repayments.
B.!My Interest in Microfinance
and across the world, I dove further into the subject. My passion for microfinance was developed after reading Muhammad Yunus’s Banker to the Poor (1999). Yunus discusses his experiences with poverty and inequality in his home country of Bangladesh. He implemented a micro-lending program, called the Grameen Foundation, which stimulated entrepreneurship and promoted growth in impoverished areas by providing loans for small-scale ventures such as farming and weaving (Yunus, 1999). As a result, even the most underprivileged Bangladeshis were given the opportunity to escape poverty — a seemingly impossible feat before the establishment of this program. Since Yunus established the Grameen Foundation, the use of microfinance lending has grown exponentially, successfully alleviating poverty across the globe.
But upon further research, I was surprised to learn that microfinance lending has not found the same success in the United States. Understanding that a number of
III.! OVERVIEW OF MICROFINANCE
In this section, I will define microfinance and provide a brief overview of its history. I will also discuss the current situation within the U.S. and the relationship between default rates, interest rates, and collateral structures for micro-lending solutions. Lastly, I will spotlight the NC Rural Center and how its current situation relates to larger microfinance trends in the U.S.
A.!Microfinance Definition
Microfinance is defined as “formal and informal institutions offering
financial services to the poor” (Brau & Woller, 2004). The original microfinance model aimed to provide small (micro) loans with low interest rates to the poorest individuals to help establish and develop their entrepreneurial ventures. Microfinance models since have adapted their practices slightly, but still aspire to extend financial inclusion to groups that were previously thought of as un-lendable (Yunus, 1999).
B.!History of Microfinance
In the 1970s, Muhammad Yunus — who is widely considered the father of
modern day microfinance — experimented with group-based micro-lending. Recognizing the impact of social push, especially in Bangladesh, Yunus implemented loans that effectively established social, rather than physical collateral. The Grameen model established small groups (5 to 7 members) consisting of mostly female non-family members. These loan groups established an internal monitoring system, holding each other accountable for repaying loans. In Yunus’s model, a single member missing a payment meant repercussions for the entire group. With two forms of collateral —social collateral and the promise of future loans — pushing borrowers to repay, the Grameen model proved extremely successful, especially in areas with similar social constructs. Yunus’s microfinance model spread across the world, with slight changes, bringing with it financial inclusion for tens of millions of impoverished borrowers (Yunus, 1999). Hundreds of thousands of microfinance lending institutions exist around the world today.
C.!Microfinance in the United States
Microfinance lending models have varied in their effectiveness and success throughout different global markets. Microfinance was adopted in earnest within the United States in the late 1980s and early 1990s (Lieberman, Mudd, & Goodeve, 2012), but has failed to find the same success as many of its international counterparts. An estimated 367 MFIs existed in the U.S. as of 2012, which represents ~18% growth in the past decade, which is below the international average (Lieberman et al., 2012). A number of key factors, including default rates, interest rates, and the use of certain forms of collateral have contributed to this limited growth in recent decades. In this section, I will
and the decisions-making strategy of MFIs. Default Rates:
As Yunus (1999) highlights, microfinance differentiates itself from other lending models because of its ability to maintain impressively low default rates, while lending to the the otherwise unbankable. Because low-income borrowers typically lack the assets to back their loans (otherwise called collateral, which will be discusses later), minimizing loan defaults is especially imperative to the success of micro-lenders. Yunus’s model, and many of those that followed internationally, thrived because of the ability to prevent loan default. Some microfinance institutions, such as the Grameen Bank and The Women’s Microfinance Initiative of Uganda have boasted repayment rates as high as 98% in the past (Nietert, 2016). This level of risk-mitigation has accelerated the growth of
microfinance in these regions, promoting the success of the microfinance institutions that are established.
While some microfinance institutions have succeeded to sustain high repayment rates, the story has largely followed a different tune with respect to default rates in the U.S. On average, U.S. microloans have a 9.1% default rate, which is far higher than the averages in areas such as South Asia, where average default rates were 3.03%
(Lieberman et al., 2012). This phenomenon has further increased the risk of lending to the poor and limited the success of microfinance lending in the U.S. Especially
associated with repayment collection — drive up already-high operating costs for U.S. microlenders and make it more difficult to do business (Chakrabarty, & Bass, 2013). Interest Rates:
Interest rates also play a pivotal role in influencing the decision-making processes of MFIs, both from an operational standpoint and with respect to affordability for
borrowers. Microfinance institutions, and really all lending institutions, lean on interest to fund the back-end costs of lending and to establish profitability. Interest rates are driven by a number of factors, including default rate and available collateral, that ultimately determine a lender’s profit margin and overall success. Rosenberg et al. (2013) determined the key drivers of microfinance interest rates to be as follows:
!"#$%$&#'()#$(%) = ./0(12$%)#3"4'562$"&$) + .88(9:)"'9:&&)
−'(<:==)#$%)='>#)"?3"4) + (%'@%:A3#'B)%43")
' ' ''
'
In short, each of these factors creates upward (or downward) pressure on interest rates. This formula serves as a simplified equation, boiling down how each of these key factors drives interest rates. Beyond interest rates, these factors also have an impact on the decisions that lenders make and the loan features and collateral structures that they ultimately include. Operating expenses, loan losses (or default risk), and profit margins drive interest rates up, while collateral standing — a given borrower’s available collateral (whether tangible or intangible) — drives interest rates down. Although, often times, profit margins are dictated by interest rates rather than the other way around.
(Chakrabarty, & Bass, 2013). Additionally, as mentioned before, higher default rates also create upward pressure on interest rates. Lastly, the lack of available collateral, namely social collateral, also impacts both interest rates and lending strategy. Collateral will be further explained in the following section. These factors have driven interest rates to an extent, but their impact has been felt more profoundly by the MFIs in the form of lower profit margins. This, understandably, has contributed significantly to the slower growth of MFIs in the U.S.
Despite the upward pressure that exists on MFI interest rates in the U.S., there has been little evidence to suggest that U.S. microfinance rates are significantly higher than the world average. While exact interest rate averages are hard to pinpoint, largely because of the long-standing issue of transparency in the U.S., Lieberman et al. (2012), estimated that average interest rates in the U.S. were 10.8%. According to Kneiding and Rosenberg (2008), the international average for microfinance interest rates is 35%, which is
significantly higher than the predicted U.S. average. Kneiding and Rosenberg cite a number of outliers, such as Uzbekistan who charge rates around 80% as potential drivers of high international averages. Still, however, there is little evidence to suggest that U.S. interest rates are higher than the national average.
A study by Rosenberg et al. (2009) concluded that microfinance interest rates are not too high in the U.S. High microfinance interest rates have been tied to higher default rates in other regions, due to the bottom-line impact they have on entrepreneurial success for borrowers. Interestingly, interest rates do not seem to be the primary determinant for the higher on-average loan defaults in the U.S.
loan defaults. This phenomenon drove me to focus my study on collateral structures and their profound impact on repayment and overall MFI success.
Collateral Structures:
As mentioned, collateral plays an imperative role to the repayment of loans and the overall success of a MFI. In short, collateral serves two purposes for a lender:
1.! To influence borrowers to repay loans
2.! To recuperate some/all of the losses in the case of default.
For a number of reasons, the first purpose will be the focus of this thesis. Firstly, since microfinance loans target poor borrowers, collateral rarely serves as ample
coverage for the loan in the case of default. With limited physical collateral available, lenders turn to other forms of collateral — both tangible and intangible — to reduce risk. The establishment of collateral structures such as group lending (and social collateral) largely aims to reduce loan default (1), rather than recuperate losses (2).
Additionally, the recuperation of losses is a largely reactive function of collateral, which is more difficult to change, relative to the circumstance. Conversely, promoting loan repayment is an active use of collateral, and has a greater impact on default rates overall.
When structuring loans, MFIs are faced with a number of options (and
Loan Feature Decision Making:
Another important caveat to note with respect to operating costs and their role as a key driver of interest rates is their residual impact on the decision-making process for lenders. With existing pressure on interest rate margins, lenders must tailor the
extensiveness of their loan features to match the availability of operational funding. For example, Chakrabarty and Bass (2013) mention that some lenders forego offering
services such as personal/professional development programs in order to reduce operating costs. These limitations increase the importance of implementing only the most impactful and effective loan features. This notion motivates part of this study, as I seek to
recommend the most effective loan features to the NC Rural Center.
D.!NC Rural Center
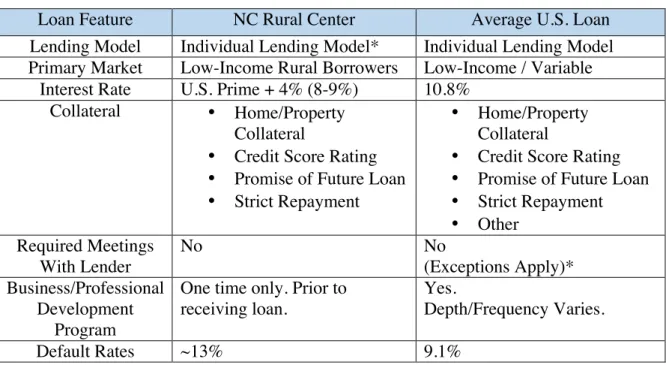
Table 1: Loan Services & Features, NC Rural Center vs. US
Loan Feature NC Rural Center Average U.S. Loan
Lending Model Individual Lending Model* Individual Lending Model Primary Market Low-Income Rural Borrowers Low-Income / Variable
Interest Rate U.S. Prime + 4% (8-9%) 10.8% Collateral •! Home/Property
Collateral
•! Credit Score Rating
•! Promise of Future Loan
•! Strict Repayment
•! Home/Property Collateral
•! Credit Score Rating
•! Promise of Future Loan
•! Strict Repayment
•! Other Required Meetings
With Lender
No No
(Exceptions Apply)* Business/Professional
Development Program
One time only. Prior to receiving loan.
Yes.
Depth/Frequency Varies.
Default Rates ~13% 9.1%
*In the past, the NC Rural Center has experimented with the use of a group lending structure. After a highly successful first round, strategic default and increasing administrative expenses plagued the effectiveness of successive rounds of lending. Ultimately, the NC Rural Center returned to an individual lending model after three rounds of loans.
Despite some differences in loan features, the NC Rural Center serves as a good, relative representation of the U.S. microfinance landscape. Some incongruences do exist, such as the fact that the NC Rural Center has slightly lower interest rates than the national average and slightly higher default rates. Nonetheless, the issues facing NC Rural Center parallel those facing lenders in the larger U.S. microfinance market. By studying,
IV.! LITERATURE REVIEW
This section will review the literature available on collateral structures and risk-mitigating tools across the microfinance landscape. In addition, it will discuss the structural differences between U.S.-based micro-lending collateral and international microfinance institutions (MFIs). In this literature review, I will discuss:
•! Group vs. Individual Lending Structure
•! Social Collateral in the United States
•! Other Risk-Mitigating Tools
•! Applying These Tools in the U.S.
In this section, I will also work to point out the gaps within the relevant literature. Specifically, I will discuss the lack of research surrounding lender meetings as a potential form of (social) collateral and the absence of the borrower voice in the loan-structuring process. By outlining the information available and comparing the research that has been conducted, I will use this literature review as the foundation for my research
methodology and recommendations.
A.!Group vs. Individual Lending Structure
Group lending has been one of the most integral parts of microfinance since its conception. Yunus detailed the concept of group lending as it first appeared in the Grameen Bank — the MFI Yunus developed to combat poverty in Bangladesh.
Lending methodologies have expanded since Yunus’s original model, modifying the group lending model that exists and even venturing away from the group model entirely. In general, three prominent lending methods exist. Two group lending methods: (1) Solidarity, and (2) Village Bank and one non-group lending method: (3) Individual dominate the microfinance landscape today (McGuire & Conroy, 2000a, 2000b).
Solidarity Model:
The most common lending model for microfinance lending, the solidarity model is the modern implementation of Yunus’s original group lending method. Loan groups consist of five to seven group members who guarantee each other’s loans and attend regular meetings together. Self-monitoring tendencies within this model reduce operating costs for lenders as well.
Village Bank Model:
Less common in international practice, but still prominent, the village banking model consists of “agencies” comprised of 30-50 village members. Loans are provided to individuals, who exist within a larger social group. Peer pressure and tight-knit social bonds motivate borrowers to repay in full. Funds from this structure are typically recycled to fund future loans within the same “agency.”
Individual Model:
In both group lending structures, each individual borrower’s ability to take out future loans depends on the ability of the group (or other individual borrowers) to avoid default. This structure establishes two forms of leverage for the lenders: tangible and social collateral.
(1)!Tangible Collateral: Because loans are spread across the group, a loan can be repaid by the group in the event that one member defaults in a given period. Since missing a payment means compromising the ability of the entire group to attain future loans, the lender is protected from individual defaults by the rest of the group.
(2)!Intangible (Social) Collateral: In an interwoven, network-based society, the social pressure from the other group members also pushes borrowers to make their payments. Lenders benefit from this social push because the groups self-police when payments are due.
While group lending has been shifted and adjusted by other banks and MFIs since the 1970s, it still remains a major part of microfinance lending models across the world. The latter, social collateral, is a major pillar of the microfinance model and cited by Yunus (1999) as the biggest benefit of group lending. Yunus attributes much of Grameen Bank’s success to the role that group liability serves to create collateral.
borrowers are not punished as heavily if members of their group default. Additionally, one of Allen’s biggest criticisms of the group liability model is its dependence on the cultural and social structure of the home country.
According to Allen (2013), the United States is a good example of a society that doesn’t support group lending models well. The difficulty associated with implementing group lending in the United States — because of an inability to establish social collateral — has led many banks to turn entirely to individual liability. With a lack of collateral from social pressure, lenders have also implemented other forms of collateral and abandoned the effort to establish social collateral entirely in many cases (Allen, 2013). While Allen researched partial group liability in Mexico, a partial liability structure in the U.S. may offer lenders some level of collateral — though it is unlikely that the social collateral that Yunus describes could be achieved.
B.!Social Collateral in the United States
The absence of social collateral in the U.S. drives many of the decisions that MFIs make. The most notable decision, of course, is the movement away from group lending models to individual lending with largely tangible collateral. Considering the pivotal role that group lending and social collateral played in the success of early microfinance, according to Yunus (1999), it is important to continue researching the role (if any) that it could play in the collateral strategies of U.S. MFIs. Research surrounding this question poses one underlying question: Why doesn’t social collateral work in the United States? Why Doesn’t It Work?
absence of social collateral in the U.S. microfinance market. Additionally, some broader cultural research can be used to deduce a possible explanation as well. Ultimately, research surrounds three possible reasons for the absence of social collateral: (1)) Social Construct/Infrastructure, (2) Strategic Default, and (3) Cultural Dimensions.
Social Construct/Infrastructure:
Allen (2013) notes that one of the biggest undoings of social collateral may simply be the lack of feasibility for group lending in the U.S. Nietert (2016) noted that group lending thrives in areas with tight-knit societies, much like that of Bangladesh, where Yunus had so much success (Yunus, 1999). Village settings, where borrowers likely have pre-existing relationships, breed more successful group lending models and higher levels of social collateral.
Therefore, the societal construct of the U.S. is cited by Allen as a major reason for social collateral’s failure. In settings such as the small-village lending groups in Yunus’s original model, borrowers could not escape the social pressure placed upon them by their village (Yunus, 1999). Without the same interconnection in U.S. society, the same level of social collateral is difficult to recreate.
Additionally, Yunus (1999) and Bastelater (2006), both credit freedom of
is quite different in the U.S., and can be cited as yet another potential cause for the relative ineffectiveness of social collateral. In a microfinance setting, specifically when observing social collateral, the ability to relocate physically (and to a lesser extent, within subgroups of society) limits the effectiveness of social collateral.
Still, in many cases, borrowers can be bound physically due to land-ownership or employment limitations. In an interview with Robyn Nietert, the President of The
Women’s Microfinance Initiative, Nietert cited rural settings and military bases as areas
where social collateral could be successfully implemented (Nietert, 2016). Therefore, while U.S. social construct and infrastructure limits the effectiveness of social collateral significantly, it doesn’t completely negate its potential success in certain settings. Strategic Default:
Without the same social consequences for defaulting on a loan, such as a tarnished reputation, strategic default is also a major risk for MFIs in the United States. Strategic default occurs when one (or all) of the borrowers in a group intentionally default on a loan in a group setting shortly after receiving it. By defaulting, borrowers pass on much of the liability to the remaining group members, while limiting personal exposure (Allen, 2013).
Without the existence of social collateral, this problem persists, often times forcing lenders to move completely away from the group liability model — never
Cultural Dimensions:
Another possible reason for the failure of social collateral in the U.S. is based on broader research surrounding cultural dimensions in different countries around the world. Geert Hofstede (2001) conducted a study comparing six cultural dimensions in different countries. The first dimension, Individualism vs. Collectivism serves as a possible explanation for the success of social collateral in some areas and its failure in others. Below is a list of some areas where individual lending models exist vs group lending models (McGuire & Conroy, 2000a, 2000b).
Individual Lending Model Group Lending Model
•! United States
•! Switzerland
•! United Kingdom
•! Chile
•! Germany
•! Ghana
•! Bangladesh
•! India
•! Kenya
•! China
Using Hofstede’s cultural dimension indicator to compare these countries, a clear trend exists distinguishing the two groups of countries. Below is a comparison between the countries above, on the basis of Hofstede’s first cultural dimension (Hofstede, 2010).
While it would be valuable to assess the cultural dimensions of Uganda, it was not one of the countries included in Hofstede’s analysis. Uganda’s relative level of
Figure 1: Hofstede Cultural Dimensions by Country/Lending Model
Source: (Hofstede & Minkov, 2010)
Not surprisingly, countries where the individual lending model persists — and thus social collateral is absent —display individualistic cultural dimensions. Conversely, the countries where group lending and social collateral are most effective display
collectivist cultural trends. This trend does not stand true across all nations, of course. Mexico, for example, was ranked highly collectivistic, but its MFIs found the most success utilizing individual lending models (Rosenberg, 2007). Still, the trends suggest that social collateral is dependent on the level of collectivism a country’s culture displays.
C.!Other Risk-Mitigating Tools
In addition to (sometimes instead of) group lending liability, international micro-lenders also implement other tools to reduce the risk of their loans and establish
collateral. Some of the most prevalent tools include:
•! Meetings with loan group
•! Meetings with lender
•! Professional development courses
•! Tangible collateral 91
68 89 67
MFIs and micro-lenders also use an array of other tools to attempt to reduce default risk. Some or all of these features were identified as impactful loan features by Cohen (2002); Chakrabary and Bass (2013); and Feigenberg et al. (2010). Each of these works assess the effectiveness of one or more of these tools, and the findings differed between sources.
Meetings with group:
The role that group interaction plays in improving repayment rate has been explored in a number of studies. Interestingly, however, the findings have been
drastically different depending on the country. Van Bastelaer and Leathers (2006) found that more frequent meetings had a negative association on loan repayment rates in Zambia. In a later study, Feigenberg, Field, and Pande (2010) concluded through their study that more frequent group meetings were correlated with lower default rates in India. The study concluded that meetings with lenders may be more impactful than group lending structures with respect to creating social collateral (Feigenberg et al., 2010).
The polarized conclusions likely suggest that more research needs to be done on the subject. More importantly, they address the possibility that interactions themselves can develop relationships and build social collateral. While these studies focus
specifically on interactions between borrowers within loan-groups, the possible impact of other interactions (whether positive or negative) is brought to light.
Meetings with lender:
her/his lender. In rural microfinance operations, most borrowers already know their lender (or lending manager) personally (Yunus, 1999).
This gap will be a major focal point for my study. I will work to study and
address this gap in the research section of this thesis.
Professional development programs:
Professional development programs have widely been correlated with better strategic decision-making, more successful ventures, and higher repayment rates. Chakrabary and Bass (2013) conclude that providing professional development courses are an unwritten duty because of (1) the lack of institutional training available and (2) the default risk associated with failed entrepreneurial ventures. Thus, lenders are pressured into taking on this significant opperating cost (Chakrabary & Bass, 2013).
This study also concluded that high levels of foreign direct investment (FDI) encourages MFIs to provide entrepreneurial training to its customers. For many locally funded and operated MFIs, though, the absence of outside investment makes it more difficult to bare the cost of this offering — constantly weighing the operating costs vs. default risks (Chakrabary & Bass, 2013).
Additionally, the voice of the borrower is largely underrepresented with respect to the services available to her/him (Cohen, 2002). Because of the importance of these decisions for the long-term success of many micro-lenders, it is important to understand which services add the most value for borrowers when trade-offs inevitably need to be made.
D.!Applying These Tools in the U.S.
Many microfinance lenders in the U.S. use some or all of the tools mentioned to establish collateral in order to mitigate risk and promote repayment. But rather than primarily reduce upward pressure on interest rates — by serving as supplementary collateral — tools such as business development programs have instead further increased upward pressure on interest and reduced overall margins (Chakrabary & Bass, 2013).
This phenomenon is a result of multiple factors, including but not limited to already-high operating costs and social collateral’s relative ineffectiveness in the U.S. Nevertheless, this phenomenon leaves lenders with two options: (1) increase interest rates, or (2) limit the loan features/collateral tools in place (Chakrabarty & Bass, 2013). While Rosenberg (2013) notes that many MFIs have turned to higher interest rates, virtually every lender is also forced to face the latter. Chakrabarty and Bass point out that the “balancing act” of strategizing which loan features and collateral tools to include often leads to U.S. loans offering fewer resources for borrowers and leaving fewer risk-mitigating tools in place to protect lenders.
I will look to provide recommendations for some of these decisions in the final section of this thesis.
E.!Conclusion
Due to the lack of social collateral in the United States, many MFIs turned to individual lending models, which put upward pressure on operating costs and interest rates. Unable to utilize intangible collateral, lenders have toggled with the use of other forms of collateral to mitigate risk and address the issue of higher default rates. However, considering the upward pressure that each additional loan/collateral feature places on operating costs, lenders are constrained by limited resources. Thus, MFIs are forced to balance between including various loan/collateral features, further increasing the importance of implementing the most effective and efficient set of loan features.
Understanding that social collateral likely doesn’t work in the U.S. as a result of a combination of (1) social structure/infrastructure, (2) strategic default risk, and (3)
cultural dimensions, little research has been done to consider other techniques for establishing social collateral. Namely, a major gap exists in research surrounding the establishment of social collateral through meetings/interactions with lenders.
Research has been conducted on a number of other sources of collateral (and risk-mitigation tools) available to MFIs. These features, however, still increase operating costs and place pressure on overall profit margins. This leaves lenders to make strategic
V.! RESEARCH METHODOLOGY
The data used in this study is derived from investigation results from a
questionnaire (Table 1) distributed to two groups of borrowers. The study was conduct from February to March, 2017. This questionnaire was designed to collect high level information about repayment tendencies, loan features, and perceived importance of various collateral structures. This survey serves to better understand the two borrower groups (and their relative similarities/differences) and to work towards better inclusion of borrower voice in the decision-making process of lenders.
The survey contains four overarching sections. The first assesses how often borrowers (1) miss/delay a loan payment, (2) meet/interact with their lender, (3) receive business/professional development courses, and (4) meet/interact with their loan group (if applicable). The second part assesses the perceived importance of a set of six collateral features. Similarly, the third section assesses the perceived impact of each collateral feature on a borrower’s business operations. Lastly, an open-ended qualitative question is posed to understand what ultimately motivates borrowers to repay.
This section will discuss how/what data was selected, how it was analyzed, and also what limitations the study contains.
A.!Data Selection
In creating and distributing this survey, the goal was to draw comparisons between two groups of borrowers in order to provide some recommendations to one or both of them, based on the other. Additionally, the survey seeks to identify and quantify trends within each group of borrowers. The two groups of borrowers belonged to two unique MFIs, which differed in location, reach, and overall success. This section will discuss how (and why) each group was selected and the metrics that were measured. Samples:
I administered this survey to two groups of borrowers to compare overarching trends within the data. The surveys were administered to two groups of borrowers, from: The NC Rural Center in the U.S. and The Women’s Microfinance Initiative (WMI) in
Uganda. The two groups share some interesting similarities, but differ in the social settings in which they operate and many of the loan features that they offer. Below is a comparison of the two lenders.
Table 2: Loan Services & Features, NC Rural Center vs. WMI Uganda
MFI/Loan Features NC Rural Center WMI Uganda
Lending Model Individual Lending Model Group Lending Model Primary Market Low-Income Rural Borrowers Low-Income Rural Women
Active Borrowers 67 4,250
Relative Loan Size $5,000- $25,000 $4,000 - $20,000
(Adjusted for GDP per Capita)
Interest Rate U.S. Prime + 4% (8-9%) 10%
Collateral •! Home/Property Collateral •! Credit Score Rating •! Promise of Future Loan •! Strict Repayment
•! Social Collateral •! Group-Based Collateral •! Loan Group Meetings •! Promise of Future Loan •! Strict Repayment
Required Meetings With Lender No Yes
Professional Development Program One-time-only. Prior to first loan. Yes. Periodic Course Offerings.
These two groups differ significantly, especially in size, location, loan features, and overall success. The most important differences for this study are the loan features, collateral features, and overall success of the two MFIs — which will be measured in default rates. The results from each group will be analyzed to draw correlations between various features and certain borrower preference and overall success indicators.
While neither is a perfect comparison, each sample was also selected to represent two larger groups of lenders. As mentioned in the introduction, the NC Rural Center shares a number of similarities with the average U.S. microfinance lender, especially in terms of collateral features and default rates. While a number of key differences exist, especially considering the limited scale and reach of the NC Rural Center, parallels exist between the struggles of the Rural Center and those of the larger U.S. market.
Additionally, WMI is among the many international MFIs that have enjoyed high growth and repayment rates. Of course, with the massive variance in MFI success from country-to-country, it would be unwise to use WMI as a reference for the entire
international microfinance landscape. Instead, it serves as an example of a highly successful MFI, largely due to the successful use of social collateral.
Overall, these two samples will be utilized for comparisons against each other, with the ultimate goal of providing recommendations or feedback to the NC Rural Center, which has struggled with high default rates. When relevant, some
Survey Questions:
This short questionnaire seeks to measure a number of descriptive and potentially predictive metrics, but most importantly it seeks to include the borrower’s voice with respect to the effectiveness of various collateral tools. In crafting this survey, I pulled from various sources to design each question. In short, five questions are posed to the borrowers to assess the following:
•! Number of late/missed payments in the past 2 years.
•! (Some) Loan Features
•! Importance of Collateral
•! Impact of Collateral on Business
•! Motivation to Repay
Late/Missed Payments: (Figure 4)
While certainly not exact, this question provides a baseline measurement for each borrower’s repayment history and serves as a predictor of risk of loan default. Though this question is largely based on borrower memory, it still serves as a valuable metric to refer back to when considering the impact of the explanatory variables throughout the rest of the survey. Additionally, it is used by lenders to determine the potential risk of lending to borrowers, which will be explained below.
This metric is also used by the NC Rural Association, to assess the potential risk of default for individual borrowers. According to Amanda Young, the Director of Entrepreneurship at the NC Rural Center, past borrowers are generally placed into one three categories when being considered for a follow-up, which help the bank predict the risk of future loan loss. While each loan is still reviewed on a case-by-case behavior, this metric is used to mitigate risk for borrowers who habitually miss or delay payments.
Figure 2: NC Rural Center Risk Buckets
**It is extremely rare for a past borrower who classifies as “High Risk” to receive a follow-up loan. Some exceptions have been made, however.
The data collected from this question is valuable because it provides borrower-specific information with respect to loan default/late payment. It also helps forecast a borrower’s potential risk for future default, which is a valuable predictive measure. While I will not implement these buckets in my data analysis, because they only apply to past NC Rural Center borrowers, these three census-backed buckets allow me to operate with the assumption that a borrower with more payments missed or payed late are riskier than borrowers with less late or missed payments. Predictably, this will impact my recommendations significantly.
Minimal Risk
(0%"H 15%)
Never
1
Medium"Risk
(~40%)
2
3
High"Risk**
(85%H90%)
4
(Some) Loan Features:
The second set of questions asks borrowers how often they (1) meet/interact with their lender, (2) receive business/professional development courses, and (3) meet/interact with their fellow borrowers. Responses from this question provide two valuable types of data. The first serves to identify which (if any) loan features they have. This list is not extensive because I set out to focus on a select few features. For both the NC Rural Center and WMI, I was able to identify the universal loan features that exist within each, so this won’t be novel data. Though, these three features can be used as dummy variables if needed.
More importantly, this question provides data about the frequency of each of these activities. This, much like the first question, will provide borrower-specific
information, which would otherwise be unavailable. Using responses for each, I will also be able to draw connections between borrower opinions (below sections) and the
frequencies of each activity. These metrics can be used as explanatory variables for analyzing relationships with every other response in the survey except those from the final (open-ended) question.
Lastly, and especially critical to this study, this section introduces
Importance of Collateral:
The third and fourth sections are likely the most important in the entire survey. In these sections, the borrower is given a voice, which is a major gap in current
microfinance and collateral research. Borrowers identify which forms of collateral they have. These “Yes/No” responses will be used as dummy variables for potential regression analyses. Below are the forms of collateral included:
•! Loan Group Meetings
•! Meetings with Lender
•! Strict Repayment Periods
•! Interest Payments
•! Home/Property Collateral
•! Other
In addition to identifying whether they have each form of collateral listed, borrowers will also be asked, “How important is each factor in influencing you to repay your loan?” in Section 3 and “How do each of these factors impact your ability to do business?” in Section 4.
The questions in section three will gauge how important each form of collateral is, thus translating how effective (or ineffective) each form of collateral is for motivating each individual borrower to repay. This section focuses on the effectiveness of the actual collateral, which is a key metric for lenders who are faced with mutually exclusive collateral-establishment decisions.
entrepreneurial success, while effectively motivating them to repay, this should be a focus for lenders going forward.
Motivation to Repay:
The final question in this survey seeks to gather information that was either overlooked in the survey-creation process or impossible to capture through Likert-Style survey questions. These results will be (largely) unquantifiable, but they will still provide valuable insight into the minds of the borrowers and what motivates them to ultimately repay their loans. Results form this section will occupy the qualitative analysis portion of this study.
B.!Data Analysis
In order to fully understand and synthesize the survey results, I will use a combination of quantitative and qualitative data analysis. Using quantitative data, I will first seek to find patterns within each group’s respective results as well as identify and compare/contrast data from each of the two borrower groups. Furthermore, I will seek to qualitatively analyze the quantitative data results, when applicable. Lastly, I will utilize the open-ended section of this questionnaire to draw deeper insights from borrowers and generate a more robust analysis.
Quantitative Analysis
Quantifying the Data
response points. This will allow for the use of various data-analysis tools on the dataset, which was otherwise unfeasible with qualitative responses.
Still, however, all of the responses throughout the questionnaire are categorical. This means borrowers can only fall into one of the designated boxes, rather than
reporting on a continuous scale. This, in fact, limits some of the analytical tools and programs that can be used. Overall, this technique still proves to be a powerful technique when analyzing categorical data. Below is a quantification of each response in the questionnaire.
Figure 3: Coding Method for Survey Questions
is that it sets rigid, relative standards for a set of subjective responses. Not only does “Somewhat Important” carry a different meaning from borrower to borrower, this method also treats it as half as important as a response selecting “Important.”
This is one of the shortcomings of Likert survey questions, but this method still stands as the most common and reliable way to gauge subjective thoughts from
respondents. So, while it is expected that there is some level of error derived from the subjectivity of the response options and their codification, the overall results are trustworthy and synthesizable. With the survey data denoted numerically, I then began my analysis by observing a set of comparative statistical measures.
Comparative Statistics:
As a preliminary form of analysis, I will compare the results for the two borrower groups against each other by section within the survey. Through the use of sample means, standard deviations, and medians (when necessary), this comparative statistics section will provide an overview of where each microlender stands relative to the other.
First, I will utilize two-sample t-testing to compare sample means (across
responses) between the NC Rural Association borrowers and the WMI borrowers. I will compare sample means for (1) late/missed payments, (2) activity frequency, and (3) collateral importance. I will seek to either accept or reject the CD, or null hypothesis, that the two sample means are the same. This will allow me to better predict whether
It is important to make one key note about the use of means with these survey results. As mentioned before, the data collected through this questionnaire is categorical, rather than continuous, data. In calculating means, however, the mean will most likely exist as a decimal between two categories (e.g. Often (3) < µ = 3.71< Very Often (4)). Because these are subjective scales, these means can be treated continuously despite the categorical nature of the response options themselves.
While these comparative statistical methods serve as an effective method for displaying and comparing data, there are a few shortcomings with these specific tools. Most notable is the limited sample size of this questionnaire, relative to the overall population size — especially with the Women’s Microfinance Initiative. This makes it difficult to conclude that the sample represents the overall population well, reducing confidence intervals and often thwarting attempts to establish statistical significance. The issue of sample size will be discussed further in the limitations section below.
Regression Analysis:
To take a step beyond comparative data analysis, I will utilize statistical
regressions to better understand and predict the relationships between each of the survey questions (15 in total). While regression analysis for this type of data does pose some challenges, it is still a useful method for analyzing correlation and the statistical significance of certain relationships.
Multiple Linear Regression
I will leverage both multiple and single linear regression models for my data analysis. Both by design and as a result of customer insight — which will be elaborated upon in the qualitative analysis section — some survey questions will act as both response (dependent) variables and explanatory (independent) variables, depending on the regression that is being conducted.
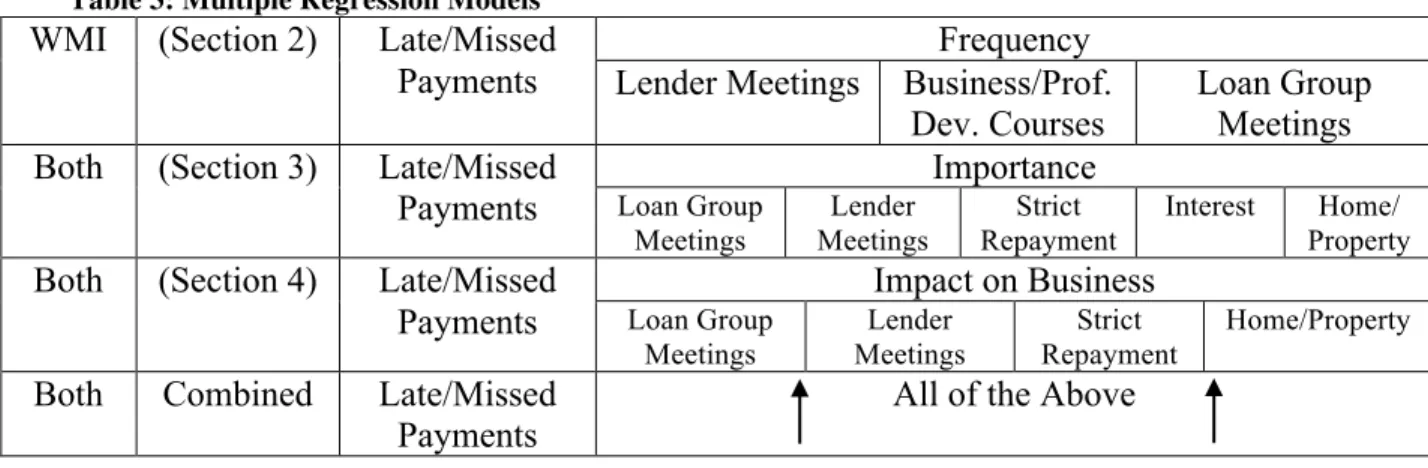
The multiple linear regression model will be used to analyze how numerous factors can explain the variation in late/missed payments. Four separate multiple regressions will be conducted to investigate the impact of Section 2, Section 3, and Section 4 on loan repayment. Additionally, a larger multiple linear regression will be run on the entire dataset. The multiple linear regression model serves to estimate coefficients, using the Ordinary Least Squared (OLS) method, which can be written as:
EF = ' .D + .GHG+ .IHI+ .JHJ + ⋯ +'.LHL+ 5F
Where .D is the intercept, .L is the coefficient associated with HL, an explanatory variable for the response variable: EF. This method is applied because it allows us to
control for a number of factors that could simultaneously impact EF.
Table 3: Multiple Regression Models WMI (Section 2) Late/Missed
Payments Lender Meetings Business/Prof. Frequency Dev. Courses
Loan Group Meetings Both (Section 3) Late/Missed
Payments Importance Loan Group Meetings Lender Meetings Strict Repayment
Interest Home/ Property
Both (Section 4) Late/Missed Payments
Impact on Business
Loan Group Meetings Lender Meetings Strict Repayment Home/Property
Both Combined Late/Missed
Payments All of the Above
These four regressions will help to highlight any statistically significant
coefficients with respect to late/missed payments. After conducting the regressions for each group, I will also compare the statistically significant coefficients (if any) of each. Beyond statistical significance, I will also leverage line-fit/residual plots to identify any trends that may provide some added insight, even if they do not prove statistically significant. This will likely be out of necessity, considering the limitations of this study.
Single Regression:
In addition to the multiple linear regression, I will also conduct some single regressions to directly assess the relationship between sets of variables. The formula for multiple linear regressions can be simplified for single regressions to:
EF = ' .D+ .GHG+ 5F
Table 4: Single Regression Models
Group Single Regression EF - Dependent Variable HL – Independent Variable Both Impact of Lender
Meetings/Interactions (Importance) Importance in Influencing Repayment (Section 2) Frequency of Meeting/Interaction WMI Impact of Loan Group Mtgs.
(Importance)
Importance in Influencing Repayment
Frequency of Loan Group Meeting/Interaction Both Impact of Lender
Mtgs./Interactions (Business)
Perceived Impact on Business
Frequency of Meeting/Interaction WMI Impact of Loan Group Mtgs.
(Business)
Perceived Impact on Business
Frequency of Meeting/Interaction WMI Impact of Business Training
(Repayment Periods)
Perceived Impact on Business
Frequency of Business Development Course Both Average Importance
(Late/Missed Payments) Late/Missed Loan Payments Average Collateral Importance NCRC Home/Property Collateral
(Importance) Late/Missed Loan Payments Importance in Influencing Repayment *Some regressions can only be run on one borrower group because of the individual vs. group lending
structure. Additionally, only the NC Rural Center utilizes physical (home/property) collateral.
Qualitative Analysis:
In addition to the quantitative portion of my data analysis, I will also qualitatively analyze the questionnaire results. This analysis will come from two places in the survey: (1) the “other” option at the end of sections three and four, and (2) the open-ended question to end the survey. These purely qualitative results will add deeper borrower insight into this study and make it more robust.
While reading through these two sections, I will be looking for recurring comments/themes that may signal a shared opinion among borrowers. I will also be searching for signs of cultural difference, namely collectivism vs. individualism. In the open ended question — which asks “What motivates you to pay back your loan?” — this will manifest itself in the individualistic (wealth, personal responsibility, etc.) or
But most importantly, the qualitative responses will serve as a place for borrowers to answer questions that I should have asked, but didn’t. The questionnaire creation process is inevitably imperfect, and this section may bring to light important phenomenon that I may have overlooked completely. This will be the focus of the qualitative analysis piece of my research.
C.!Limitations
It is important to note that numerous factors and circumstances exist that may limit the success of this study and its ability to fully answer the hypotheses posed. The most significant limitations for this study are (1) sample size, (2) borrower bias, and (3) variables selected/tested.
Without a doubt, the biggest limitation of this study is the sample size. Due to limited time, funding, and lender cooperation, the sample size for the two borrower groups is rather small. This will limit, significantly, my ability to establish statistical significance throughout my data analysis. It may be the case, in fact, that the sample size limits any statistically significant conclusions to be made. In this case, I will work to analyze and synthesize the data to make some observations, though they may need further testing to be proven statistically significant.
questions is that “often” or “important” have a different meaning from a person-to-person or borrower-to-borrower basis. This, however, is simply a risk associated with probing and quantifying consumer opinions. Additionally, the memory of borrowers is a potential limitation of this study. Borrowers are asked to recall how many late/missed payments they have had in the past two years, which opens the door for inaccurate responses.
VI.! RESULTS
Before diving into the data analysis and key findings, it is important to consider the purpose of this research and the reasonable expectations for the significance of its results. Understanding the resource constraints and limitations associated with the the data-collection process, this study will serve a largely exploratory purpose. Because the study seeks to address a major gap in microfinance research and literature, far more research would have to be conducted to back up and solidify the findings of this study. Additionally, a far wider net would need to be cast in order to draw significant
conclusions about larger microfinance markets or the international landscape as a whole. Nevertheless, by analyzing and comparing the findings from each of these two borrower groups, I was able to spot some interesting trends and utilize the tools
highlighted previously to draw statistically significant associations within the data. In this chapter, I will discuss the overall data, my statistically significant findings, and how they compared to some of my predictions before the study. In this chapter, I will address:
•! Comparative & Descriptive Statistics
•! Results from Multiple & Single Regression Calculations
•! Findings from Qualitative Analysis
A.!Comparative & Descriptive Statistics
Just by taking a high-level look at the questionnaire results, a few noteworthy observations can already be made. In this section, I will discuss the results from the comparative analysis of sample means for (1) late/missed payments, (2) lender meetings, and (3) collateral importance. The following page contains graphics depicting the
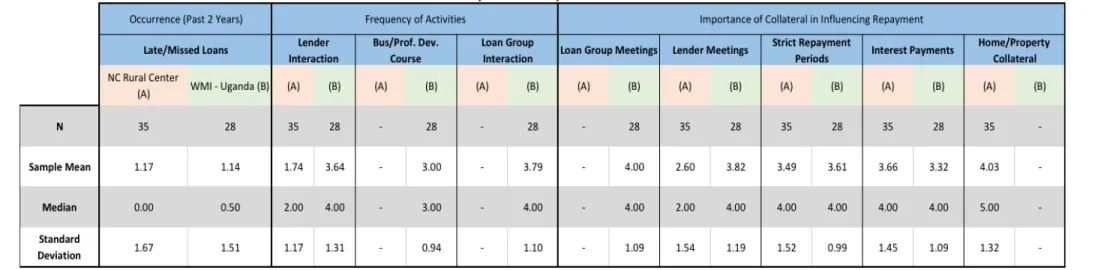
Table 5: Comparative Descriptive Statistics, NC Rural Center vs. WMI-Uganda
Table 6: Collateral Importance Breakdown (NC Rural Center) Table 7: Collateral Importance Breakdown (WMI-Uganda
Late/Missed Payments:
Interestingly, the sample means for the two borrower groups were highly similar
with respect to the late/missed payments metric. Despite the different loan features and
collateral structures, the sample means differed by just .03, though the NC Rural Center
sample’s higher Standard Deviation (1.67) suggests more polarized data than the WMI
borrower group (1.51). By using standard errors to estimate the population means for
these two groups, the similarity is highlighted further. The formula can be written as:
! = # ± %&
Where ! is the population mean, and # ± %& is the sample mean and standard error,
which are used to estimate how far off the estimation would likely be. Standard Error can
be calculated by using the following formula:
%& = '
( %& = % (
In this formula, ' represents the standard deviation of the population. Since that
information is not available, it is acceptable to utilize the standard deviation of the sample
mean as an estimate. Below are the calculations for the estimated population mean of
each borrower group.
!)*+ = #)*+± %& %& = 1.51 28= .285 1!)*+ = 1.14 ± 0.285
!4565 = #4565± %& %& = 1.67
35= .282 !4565 = 1.17 ± 0.282
Using this formula, we can estimate with 95% certainty that the population mean
for the NC Rural Center with respect to late/missed loan payments is between 0.888 and
WMI-Uganda is between 0.855 and 1.425. Additionally, by conducting a 2-sample t-test,
we conclude that we cannot reject the null hypothesis that there is no difference between
the two population means. Prior to this study, I assumed that the late/missed payments
would be significantly higher for the NC Rural Center, which it still may be, but the data
collected does not indicate that there is a significant difference between the two
populations. It will be important to keep this finding in mind when analyzing how
different forms of collateral impact the late/missed payment trends for these two samples.
Lender Meetings:
Just at first glance, the sample means for the two borrower groups seem vastly
different, with respect to how frequently borrowers meet/interact with their lender. The
NC Rural Center’s sample mean is 1.74 (~Sometimes), compared to WMI’s sample mean
of 3.64 (Often–Very Often). After conducting the same calculations as above, this
difference is further highlighted. We can estimate with 95% certainty that the population
mean for the NC Rural Center with respect to lender meeting/interaction frequency is
between 1.94 and 1.54. Additionally, we can estimate with 95% certainty that the
population mean for WMI-Uganda with respect to lender meeting/interaction frequency
is between 3.39 and 3.89.
After conducting a two-sample t-test on these two sample means, we find that the
difference between the sample means is significant. Thus, we can reject :;, the null
hypothesis, that the two means are the same. This stark difference between the two
Collateral Importance:
After conducting two-sample t-tests on the level of importance of each type of
collateral, my findings show that there is no significant difference between the two
samples with respect to any of the five types of collateral. Before conducting the analysis,
I predicted that the two sample means were statistically significant with respect to the
importance of lender meetings/interactions. Lender meetings had an average importance
of 3.82 (~Important) for WMI-Uganda borrowers, compared to an average importance of
2.60 (~Somewhat Important) for NC Rural Center borrowers. Despite a seemingly
significant difference between the two borrower groups in terms of importance for lender
meetings/interactions, statistical testing determined that we cannot reject :;, the null
hypothesis, which states that the two population means are the same. This difference in
sample means, while not significant, does indicate a need for further testing.
B.!Multiple Regression Calculations
A number of multiple linear regressions were conducted for this study, seeking to
explain the number of late/missed payments for each borrower group based on various
independent variables. Seven multiple regression tests were conducted in all, as shown in
Table 3, which is repeated below for reference. In this section, I will discuss the findings
First Regression:
The first regression, which was only run on the WMI-Uganda sample, sought to
use the frequency of lender meetings, business/professional development course, and loan
group meetings to explain the change in late/missed payments. This regression was not
run on NC Rural Center borrowers because the last two independent variables did not
apply to that sample. After running a multiple regression, the findings showed that the
frequency of loan group meetings had a negative association with late/missed payments.
The coefficient (-0.9504) had a P-value (0.00018) that was significant at 5%. This result
supports the underlying principle that loan group meetings/interactions are designed to
positively influence loan repayment. These findings also support the findings of
Feigenberg et al (2010) in their study.
Second & Third Regression:
The second and third regressions also featured interesting results, including one
major similarity. These two regressions — which seek to measure the association
between the importance of the five collateral features discussed and late/missed payments
— both found that the importance of lender meetings had a negative association with
late/missed payments. The WMI-Uganda regression showed that lender meetings had a
coefficient of -1.009 and a P-value of 0.00713, which is significant at 5%. Similarly, the
NC Rural Center regression showed that lender meetings had a coefficient of -0.7799 and
a P-value of 0.002, which is also significant at 5%. While further data collection is
necessary, this finding indicates the possibility of lender meetings as a potentially viable
Center was significantly lower than WMI-Uganda, showing that lender meetings showed
similar negative association in two significantly different settings.
Fourth & Fifth Regression:
The fourth and fifth regressions sought to establish some association between the
impact of each collateral feature on business and the late/missed loan payments for each
borrower group. The results showed that there was no significant association between the
impact that any of the collateral features had on business (whether positive or negative)
and late/missed loan payments.
Sixth & Seventh Regression:
The final two multiple regressions combined all of the independent variables
above, to assess whether any statistically significant association could be found between
the 12 variables and the number of late/missed payments. The regression found that there
were no statistically significant variables at either 10% or 5% significance. This was not
unexpected, considering the sample size of the two survey groups. More expansive
research might still find that one of the variables has a statistically significant impact on
loan repayment.
C.!Single Regression Calculations
In addition to running multiple regressions, several single linear regressions were
also conducted to take a deeper look at the individual relationships between certain
variables within this study. A total of 10 single regressions were conducted, with three
conducted for each samples (six regressions in total), three conducted on the
WMI-Uganda sample only, and one conducted on the NC Rural Center sample. The table below
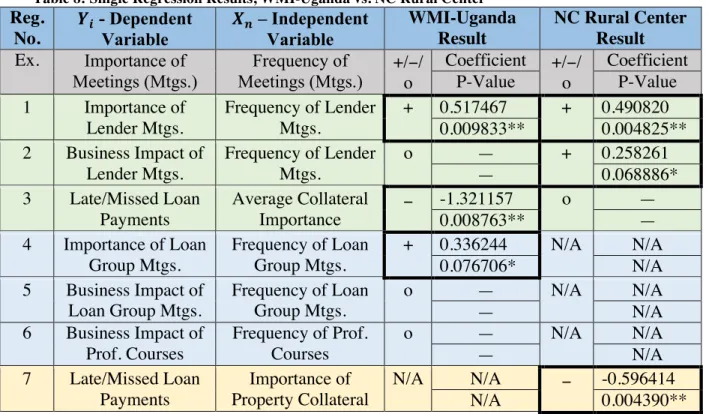
Table 8: Single Regression Results, WMI-Uganda vs. NC Rural Center
Reg. No.
<= - Dependent Variable
>? – Independent Variable
WMI-Uganda Result
NC Rural Center Result
Ex. Importance of Meetings (Mtgs.)
Frequency of
Meetings (Mtgs.) +/o −/
Coefficient +/−/ o
Coefficient
P-Value P-Value
1 Importance of
Lender Mtgs.
Frequency of Lender Mtgs.
+ 0.517467 + 0.490820
0.009833** 0.004825**
2 Business Impact of
Lender Mtgs.
Frequency of Lender Mtgs.
o — + 0.258261
— 0.068886*
3 Late/Missed Loan
Payments
Average Collateral
Importance −
-1.321157 o —
0.008763** —
4 Importance of Loan
Group Mtgs.
Frequency of Loan Group Mtgs.
+ 0.336244 N/A N/A
0.076706* N/A
5 Business Impact of
Loan Group Mtgs.
Frequency of Loan Group Mtgs.
o — N/A N/A
— N/A
6 Business Impact of
Prof. Courses
Frequency of Prof. Courses
o — N/A N/A
— N/A
7 Late/Missed Loan
Payments
Importance of Property Collateral
N/A N/A − -0.596414
N/A 0.004390**
*Significant at 10%; **Significant at 5%
Note: Correlations and P-values for regressions resulting in ‘o’, or no association are omitted for table readability.
Considering that multiple regressions for both WMI-Uganda and the NC Rural
Center showed a statistically significant association between importance of lender
meetings and late/missed payments, I anticipated a positive association between
frequency of lender meetings and importance of lender meetings for both groups as well.
The first set of regressions supports this, showing that there is, in fact, a positive
association between frequency of lender meetings and importance of lender meetings for
both samples.
Additionally, the second set of regressions identified a positive association
between the frequency of lender meetings and business impact of lender meetings. The
from the regression result for the WMI-Uganda sample, which found no statically
significant association between the two variables.
Average collateral was a metric developed based on the results. Average collateral
calculated the overall average of the importance assigned to each of the collateral features
combined. This metric helped to identify how important overall collateral was to each
borrower, and sought to identify if any significant associated existed between this metric
and late/missed payments. The two regressions run found that there was a negative
association between average collateral importance and late/missed loan payments for the
WMI-Uganda sample, but no such association was found for the NC Rural Center
sample.
Additionally, an individual regression was conducted to follow up the findings for
the first multiple regression, which established negative association between frequency of
loan group meetings and late/missed payments. This regression found a significant
positive association between frequency of loan group meetings and importance of loan
group meetings. This finding, too, would support the research conducted by Feigenberg
et al (2010).
Lastly, by conducting a single regression on the relationship between importance
of home/property collateral and late/missed payments, a statistically significant negative
association was found between the two. No association was found with respect to the
importance of home/property collateral during any of the multiple regressions, but this
positive association could signal a potentially significant association between the two