The Role of Ventral Striatal Dopamine in Reward Valuation Sensitivity Scott Hunter Oppler
Abstract
Striatal dopamine (DA) has been extensively implicated in reward related processes. We
assessed striatal DA variations and delay discounting (DD) behavior in humans by investigating two functional polymorphisms in genes associated with striatal DA signaling. First, the DA transporter (DAT), which is the primary mediator of DA clearance in the striatum; a variable nucleotide repeat polymorphism in the DAT gene is associated with variation in DAT
Acknowledgements
The Role of Ventral Striatal Dopamine in Reward Valuation Sensitivity
In daily life, people often face situations where they must decide between two types of choices: a choice that will be beneficial immediately or almost immediately, and one that is not as rewarding in the present, but will have a larger reward in the future. A major example of such a choice is the decision whether to get a job or to attend college following high school: getting a job immediately reaps a beneficial salary, while attending college sacrifices such immediate monetary reward. However, in the future, it is likely that a college degree will increase one’s potential earnings, leading to a greater overall reward. Many similar choices, on smaller scales, are evaluated regularly as people attempt to discern whether they would rather have a lower value reward immediately or a larger value reward in the future (these decisions are known as intertemporal choices). In such situations, there are three key variables that can influence an individual’s choice: the relative magnitude of the delayed reward compared with the immediate reward, the overall magnitude of the delayed reward, and the elapsed time required before getting the delayed reward. In many instances, the perceived magnitude of the future reward is “discounted” as the time needed to obtain the reward increases, resulting in smaller perceived values for rewards that are expected to occur more distantly in the future.
to be linked to individual differences in susceptibility to the development of addictive behaviors, such as pathological gambling and substance abuse, which provides a link between a general behavioral tendency (heightened immediate reward bias) and potentially debilitating disorders (Madden et al., 1997; Kirby et al., 1999; Alessi and Petry, 2003). Several studies have been conducted in order to develop a better understanding of the biological bases for individual differences in intertemporal choice, with the hope that this information may help determine biological bases for high impulsivity, and thus, increased susceptibility to certain psychological disorders. Such findings may eventually lead to easier identification of those at a greater risk for developing impulsivity-related problems, allowing for the provision of earlier interventions capable of helping the individuals who are affected.
VS Activity and Reward Preference
Multiple studies have identified one region of the brain, the ventral striatum (VS), as playing a major role in reward valuation, especially in the relative valuation of immediate compared to future rewards. In a study comparing VS activity level with interindividual differences in reward preferences, Hariri et al. (2006) found a positive correlation between the magnitude of monetary feedback-related striatal activity during a card guessing task and an individual’s relative preference for immediate rewards in a separate delay discounting task. This indicates that VS activity may be associated with the perception of temporally differentiated rewards. Further support for VS involvement in reward valuation comes from the finding that activation in the nucleus accumbens, a part of the VS, is positively correlated with the
proposal that VS signaling is related to how rewards are valued. In an attempt to better
understand the role of VS activity, and identify specific situations in which different regions of the brain impact choice, McClure et al. (2004) measured the activity in multiple parts of the brain as participants made preference-based choices between immediate rewards, rewards to be
received a short time in the future, and rewards to be received even further in the future, using functional magnetic resonance imaging (fMRI). Relative activity levels indicated that the VS responded more strongly during decisions that involved an “immediate reward” as an option, rather than two delayed reward choices, while regions in the prefrontal cortex responded uniformly to all presented choices. These different response patterns indicate that the VS may play a specific role in the valuation of immediate rewards, rather than having a large influence on the valuation of “sooner” rewards in general. Moreover, it was found that when participants were choosing between an immediate and future reward, those who chose the immediate reward showed stronger VS activity relative to prefrontal activity, while those who chose a future reward showed opposite activation patterns. Clearly, relative VS activity plays a major role in determining how temporally differentiated rewards are valued, and influences the extent to which future reward values are discounted.
VS Activity and DA
Siessmeier et al. (2006) found that striatal DA synthesis capacity and activity in response to affective stimuli were positively correlated. Similarly, Scott et al. (2007) found, using fMRI, that activity in the VS increased proportionally to placebo-induced DA release (measured by PET) during reward anticipation during a monetary incentive delay task. In an additional fMRI study looking at this relationship, VS activity tended to increase following amphetamine induced DA release (Menon et al., 2007). These results suggest that striatal DA relates to striatal activation. Menon et al. (2007) suggested that this interaction stems from some yet to be understood causal effect of DA synthesis on VS activity. These findings were corroborated by a study that also compared VS activity with VS DA levels using genetic methods (Forbes et al., 2009). This study measured DA indirectly, via functional genetic polymorphisms previously linked to the striatal dopaminergic pathway(Forbes et al., 2009). Results indicated that people with genetic indicators of relatively increased striatal DA availability (see below) tended to have higher striatal
activation while performing a task that involved a positive and negative feedback-associated monetary reward. This proposed link between genetics and VS activity carries large implications, as it offers the possibility of identifying a direct genetic modulator of VS activity, which, as already described, is associated with the valuation of reward. In order for this connection to be made, it is necessary that genetic influence on VS DA is sufficiently understood.
Genetic Influences on VS DA
DA receptor (DRD2). Functional polymorphisms of the genes coding for these proteins lead to variations in their ability to regulate and mediate DA signaling in the brain, which may have impacts on cognition and behavior.
DAT
The DAT regulates striatal DA levels by binding and returning extracellular DA to presynaptic terminals (Dreher et al., 2009). There is a common genetic variant in the
leads to greater DAT expression, increased DA clearance should be observed in 9R carriers, resulting in less extracellular striatal DA in 9R carriers relative to 10R homozygotes.
DRD2
Genetic variation in the DRD2 gene has also been implicated in the modulation of DA signaling in the striatum. D2 receptors are located both pre- and post-synaptically in the striatum, where they influence dopaminergic activity. Presynaptically, D2 receptors act as autoreceptors, inhibiting cell firing and DA release when DA binds to them. Post-synaptically, the D2 receptors also produce inhibitory affects on activity via a Gi-protein signaling cascade (Sibley et al., 1993). There are several identified polymorphisms in the DRD2 gene (e.g. C957T, -141C
insertion/deletion, and the Taq1A polymorphisms), all of which are in linkage disequilibrium (Duan et al., 2003). For this study, we focused on the C957T SNP, based on findings that this SNP can impact levels of striatal DRD2 binding; striatal D2/3 receptor binding potential is significantly reduced among people with the C/C genotype compared to those with the T/T genotype (Hirvonen et al., 2004; 2005). Among several possibilities that could explain this finding, one potential explanation is increased D2 receptor density in the striatum associated with the 957T allele (Hirvonen et al., 2009).
Interacting Effects of DAT and DRD2
that DA-related genetic polymorphisms can account for individual variation in behavior.
However, the complexity of dopaminergic signaling in the brain limits the explanatory power of a single genetic polymorphism in understanding behavior.
As such, work that investigates the effects of multiple DA system regulatory components (e.g. DAT and DRD2) and how they interact, lends greater power to behavioral genetic studies. For example, a study conducted by Rokem et al. (2010) highlights the importance of looking at multiple mechanisms of striatal DA regulation to predict behavior. That study measured an involuntary attentional process called inhibition of return (IOR) in participants that were 9R carriers or non-9R carriers. The investigators measured IOR twice, once on bromocriptine, a DRD2 agonist, and once on placebo. Bromocriptine effects on IOR depended on DAT genotype: it reduced IOR duration in 9R carriers, but increased IOR duration in 10R homozygotes,
illustrating that DAT genotype influences DRD2-mediated effects on human behavior and cognitive functioning. Further support for the complexity of striatal DA signaling comes from studies suggesting that DRD2 receptors directly modulate DAT reuptake activity (Meiergerd et al., 1993; Parsons et al., 1993; Dickinson et al., 1999; Mortensen and Amara, 2003). By this theory, DAT and DRD2 do not merely play two independent roles in DA transmission, but rather, DRD2 directly affects the capabilities of DAT in regulating the dopaminergic system, further emphasizing the importance of also looking at DRD2 genotype when assessing DAT genotype effects on behavior. Moreover, interacting effects of DAT and DRD2 may help explain conflicting data in the literature regarding DAT VNTR effects on DA availability.
DA Availability and Behavior
impact cognition and behavior according to an inverted U-shaped function, where DA extremes (both low and high) influence behavior in one way, while some middle, optimal amount of DA may influence behavior in a different way. Mattay et al. (2003) showed that above or below some set critical frontal DA amount, behavioral performance in a working memory task begins to decline, a finding that was in line with a previously found inverted U-shaped function of prefrontal DA on working memory (Goldman-Rakic et al., 2000). Recent findings suggest that DA in the striatum may also have a similar influence on activity in this area of the brain (van Schouwenburg et al., 2010). In addition, a study by Bertolino et al. (2009) found that the effect of the DAT VNTR on brain activation during a recognition memory paradigm depended directly on DRD2 polymorphic context. The polymorphic combinations leading to peak activation were those predicted to result in an intermediate amount of DA, supporting an inverted-U shape effect of DA on recognition memory. In general, such a function would imply that a polymorphism of one gene that results in increased DA availability may have different effects depending on the extant DA context determined by polymorphisms of other genes affecting dopaminergic signaling.
All of the above research has contributed to the major progress that has been made towards identifying the biological bases for individual differences in intertemporal reward valuation. In summary, the relevant links that have been made include those between: DAT and DRD2 polymorphisms and striatal DA availability (Faraone et al., 2013; Hirvonen et al.,
2004;2005; Rokem et al., 2010; Shumay et al., 2011; van de Giessen et al., 2009); DA
2007; Siessmeier et al., 2006); and relative VS activation levels and relative preferences for immediate versus future rewards (intertemporal choice tendencies) (Hariri et al, 2006; Knutson et al., 2001; McClure et al., 2004). It follows logically from these connections that if genetic variance influences DA availability, which impacts striatal activation, which itself has been shown to be related in some way to intertemporal choice, then through these means, variability in genes governing striatal DA signaling would predict substantial interindividual differences in reward valuation during intertemporal choice. Despite this inferred relationship, little research has been done to investigate this proposed link between striatal DA availability, indexed by functional genetic polymorphisms, and intertemporal choice tendencies.
In the present study, we will test whether specific genetic polymorphisms that modulate striatal DA availability can predict differences in immediate versus future reward valuation between individuals. We will use DAT and DRD2 polymorphisms as genetic markers to predict VS DA availability, since previous research suggests that these polymorphisms influence striatal DA levels. While other dopaminergic genes undoubtedly influence the function of the brain’s reward pathways, we have limited our focus to these, as functional consequences of these polymorphisms have been defined, and DAT and DRD2 are arguably the most important proteins specific to regulating striatal DA signaling.
sensitivity. We also propose that individual reward sensitivity can be measured across tasks by assessing how choice is modulated by proportional reward value increases across all choices (e.g. instead of a task involving $2 to $100 rewards, a new task involving $200 to $10,000 rewards). Previous studies have suggested that participant preference for immediate over future reward should decline with the increase of reward magnitudes being used in the task (Green et al., 1997; Kirby & Marakovic, 1996). As a result, response to future reward shifts can be used as an index of reward sensitivity, a behavior linked to compulsive, maladaptive behaviors such as substance abuse, pathological gambling, and ADHD (Chen et al., 2007; Reuter et al., 2005; Scheres et al., 2007; Strohle et al., 2008; Wrase et al., 2007).
Based on previous findings linking striatal DA, VS activity, and intertemporal choice preferences, we hypothesized that participants with predicted “extreme” amounts of striatal DA availability (either low or high), based on DAT VNTR and DRD2 C957T genotypes will be less sensitive to changes in delayed reward value, while those with more mid-range, intermediate levels of VS DA will demonstrate relatively greater responsiveness to such value changes.
Methods
Exp 1: Striatal DA and ICR as a function of delayed reward magnitude – within task
Participants
received monetary compensation for their participation. For the present study, we focused on data from the emerging adult participants (n = 207) within this sample (ages 18-25; M = 21.12, SD = 1.96). The emerging adult participants included 99 females and 108 males, with the following ethnic distributions: 7% Asian, 12.6% Black, 3.5% Hispanic, 71.4% White, and 5.5% other.
Standard Delay Discounting Task
Participant impulsivity was assessed using a delay discounting task, described in detail previously (Mitchell et al., 2005; Altamirano et al., 2011). For the task, participants were positioned at a computer, and completed a task divided into eight blocks of 42 or 43 trials each. In each trial, participants were presented with two reward options to choose between, each containing a monetary amount and time value: one option, the “Later” option, had a monetary value of $2, $5, $10, $20, or $100 and a time value of 1 week, 2 weeks, 1 month, 3 months, or 6 months, while the other option, the “Now” option, had a monetary value of some reduced
half of the trials, and the other three conditions were divided evenly among the other half of the trials. Participant reaction time (RT) was also recorded in each trial. Of the 207 emerging adults tested, eight were excluded from all analyses based on RTs in the control conditions greater than RTs during subjective choice trials.
Dependent Measures
Our main behavioral dependent measure, the impulsive choice ratio (ICR), was
calculated as the proportion of “Now” responses made in the WANT condition with an ICR =1 signifying a participant always choosing the “Now” option. ICR was calculated at each delay amount to measure how ICR varied with delayed reward magnitude.
To quantify reward valuation sensitivity, we fit ICR as a function of delayed reward value with a logarithmic function, measuring the slope and intercept of these fits using the built in curve-fitting function in Microsoft Excel (Mitchell et al., 2005).
Exp 2: Striatal DA and ICR as a function of delayed reward magnitude – between task
Participants
In a similar experiment following slightly different procedures, new participants (n =144) were recruited from UNC and the surrounding community following the same procedures and guidelines as those used in Experiment 1, with the exception that all recruited participants were between the ages of 18 and 25 (M = 21.34, SD = 1.88). The sample included 72 females and 72 males, with ethnic distributions as follows: 4.2% Asian, 11.1% Black, 4.9% Hispanic, 74.3% White, and 4.9% other.
Increased Reward Magnitude Delay Discounting Task
discounting task on two separate occasions. The first time they did the task, participants
completed a task with reward values either identical to those in the task previously described (the standard task), or with delayed reward values 10 times or 100 times larger than those in the standard task: $20, $50, $100, $200, and $1,000 reward values or $200, $500, $1,000, $2,000, and $10,000 reward values (the 10x and 100x tasks, respectively). In their second testing session, participants completed the delay discounting task again, this time being assigned to the standard task if they had not been assigned to it the first time they did the task, or being randomly
assigned to any of the three task variations if they had already done the standard task (all
participants completed the standard task at least once, and some completed it twice). Participants were evenly and randomly assigned to the possible task combinations (standard/standard,
standard/10x, and standard/100x), such that 48 participants were assigned to each task combination. Task order was counterbalanced to mitigate any practice effects.
Comparing ICR between Tasks
In order to quantify participant reward valuation sensitivity, we compared ICR measured in the standard task with that measured in the alternative (the standard-repeat, 10x, or 100x task). This is a within subject measure of change in ICR across two variations of the task (standard task ICR – second task ICR).
Common Measures
Genotyping
occurred in duplicates for some of the samples in order to ensure validity of the DNA analysis (Smith & Boettiger, 2012).
For Experiment 1, participant DRD2 genotype distribution was: 59 C/C, 86 C/T, and 53 T/T. For Experiment 2, participant DRD2 genotype distribution was: 39 C/C, 60 C/T, and 43 T/T. Neither experiment’s DRD2 genotype distribution differed from Hardy-Weinberg-Equilibrium (χ2 = 3.11, df = 2, p=0.211; χ2
= 3.414, df = 2, p=0.181).
DAT VNTR determination was based on a PCR amplification protocol described
previously (Anchordoguy et al., 2003). The primer sequences used in the PCR were the forward 5’-TGT GGT GTA GGG AAC GGC CTG AG-3’, and the reverse 5’-CTT CCT GGA GGT CAC GGC TCA AGG-3’. Twenty µL volume reactions were used for the PCR, with each
reaction containing: 1µL of genomic DNA (20 ng), 10% DMSO (Hybra-Max® grade; Sigma, St. Louis, MO), 1:8 mM MgCl2, 180 µM deoxynucleotides, with 7’-deaza-2’-deoxyGTP (Roche Applied Science, Indianapolis, IN) substituted for one half of the dGTP, 480 nM of both the forward and reverse primer (IDT, Coralville, IA), 2uL 1x PCR buffer II solution (ABI, Foster City, CA) and 1 unit of AmpliTaq Gold® polymerase (ABI, Foster City, CA). After DAT VNTR amplification, all DNA samples were read for base pair length by the Genome Analysis facility at UNC, Chapel Hill, using an ABI 3730xl DNA Analyzer (ABI, Foster City, CA) in order to determine the DAT repeat(s) they contained. Data was visualized using PeakScanner software (ABI, Foster City, CA), and base pair calls were made by two independent observers.
consisting of less frequent alleles (consisting of 6, 7, and 11 repeat VNTRs) or genotypes that could not be determined. In each experiment, participants with the rare/unattainable DAT variants were excluded from analyses looking at genetic effects on our measures of interest. After these exclusions, Experiment 1 used data from 190 participants for analysis, and Experiment 2 used data from 137 participants for analysis.
Participants were divided into groups based on their DAT and DRD2 genotypes. With respect to DAT genotype, participants were split into two groups, one consisting of 9R carriers, and the other consisting of 10R homozygotes. 9R carriers were combined into one group to follow commonly used conventions for looking at this DAT polymorphism. With respect to DRD2 genotype, participants were split into three groups, one for C homozygotes, one for heterozygotes (C/T), and one for T homozygotes.
Behavioral and Demographic Measures
Statistical Analyses: Experiment 1
Most demographic and behavioral differences between groups were assessed using between subjects 2 by 3 ANOVAs (2 DAT genotype groups by 3 DRD2 genotype groups). Differences in sex, ethnicity, and COMT genotype were assed with χ2
tests. Between subjects 2 by 3 ANOVAs were also used to assess group differences in ICR delayed amount slope, overall ICR, and various RT measures. Additionally, post-hoc t-tests were used to further analyze specific group by group differences in these measures.
Statistical Analyses: Experiment 2
Demographic and behavioral differences between participants in each of the task groups were assessed using both between groups (three task groups) one way ANOVAs and χ2
tests. A 3 (within-subject variable: task group) by 3 (between-subject variable: DRD2 genotype group) by 2 (between-subject variable: DAT genotype group) mixed ANOVA was used to look at
Results
Exp 1: Striatal DA and ICR as a function of delayed reward magnitude – within task
Group Characteristics/Behavioral Measures
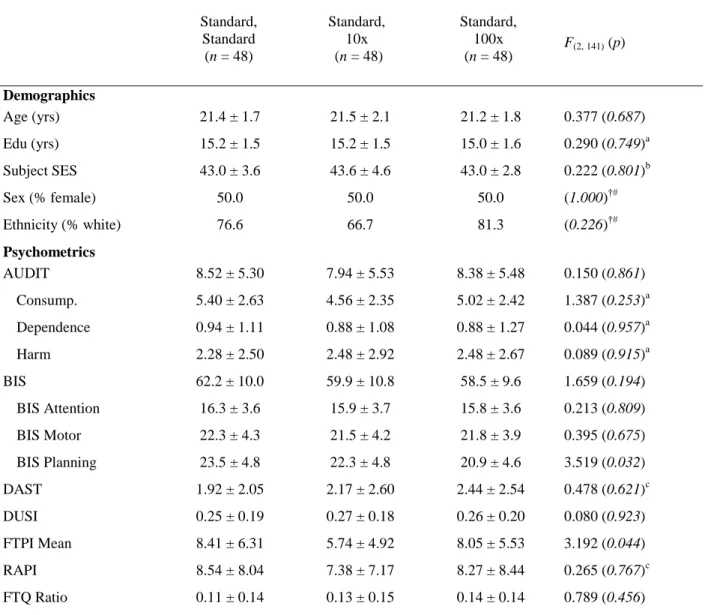
The demographic characteristics and behavioral inventory results by genotype group are shown in Table 1. There were no significant effects of DAT, DRD2, or interaction effects of DAT and DRD2 for most of these characteristics, including age, years of education, and SES. Additionally, groups did not differ significantly in sex distribution. However, groups did differ significantly in ethnicity, with a smaller percentage of Caucasian participants in the DAT 10R, DRD2 CC group than in the other participant groups (p<.001). In addition, COMT genotype differed by DAT/DRD2 group (p=0.008), with a greater percentage of participants in the DAT 9R, DRD2 TT group having the COMT Met/Met (MM) genotype. Among the behavioral inventories, DAT/DRD2 groups differed significantly in their scores on the AUDIT (p = 0.019), the AUDIT consequences subscale (p = 0.019), and the DUSI (p = 0.014). There were no significant differences across DAT and DRD2 genotype groups among the other behavioral inventories, including the BIS (p=0.636), a self-report measure of trait impulsivity.
Delay Discounting Task ICR Measures
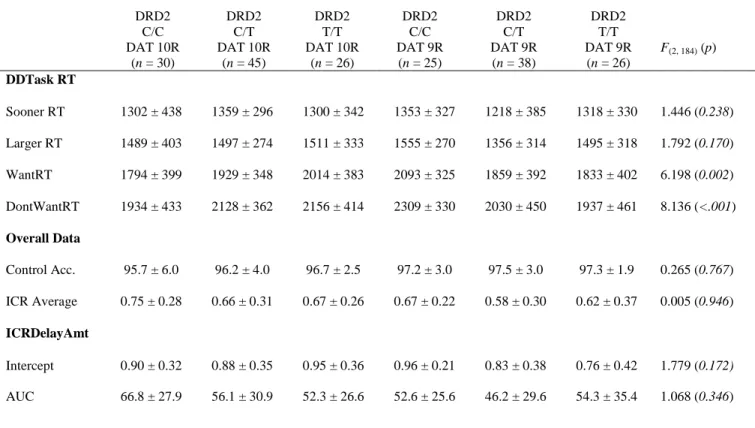
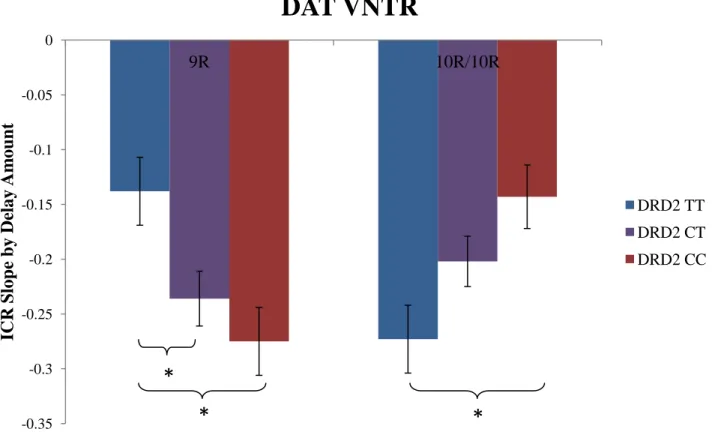
Various task performance measures for each of the genotype groups are reported in Table 2. There were no significant main effects of either DAT or DRD2 on ICR delayed amount slope (DAT: F(2,184)=0.181, p=0.671; DRD2: F(2,184)=0.125, p=0.883). However, there was a
ICR delayed amount slope compared with the intermediate expression DRD2 CT group (t(62)= -2.478, p=0.016) and the higher expression DRD2 CC group (t(49)=-3.306, p=0.002). Within the DAT 10R homozygotes, there was a trend towards the DRD2 TT group having a significantly steeper ICR delay amount slope compared with the DRD2 CT group (t(69)=1.743, p=0.086); The DRD2 TT group did have a significantly steeper slope than the DRD2 CC group (t(44.8)=2.995, p=0.004). When looking at our hypothesized intermediate DA groups (DAT 9R, DRD2 CC and DAT 10R, DRD2 TT), there was no significant difference in ICR delayed amount slope
(t(49)=0.031, p=0.976). In fact, average slope for each of these groups were nearly identical (9R/CC M= -0.275±0.160; 10R/TT M= -0.273±0.184). These ICR by delayed amount slope results can be seen in Figure 1. While DAT and DRD2 genotypes interacted to influence this slope, they did not have an interaction effect on overall ICR collapsed across all delayed reward magnitudes, even after controlling for group differences in ethnicity, AUDIT, DUSI, and COMT (F(2,179)=0.064, p=0.938).
Delay Discounting Task Reaction Times
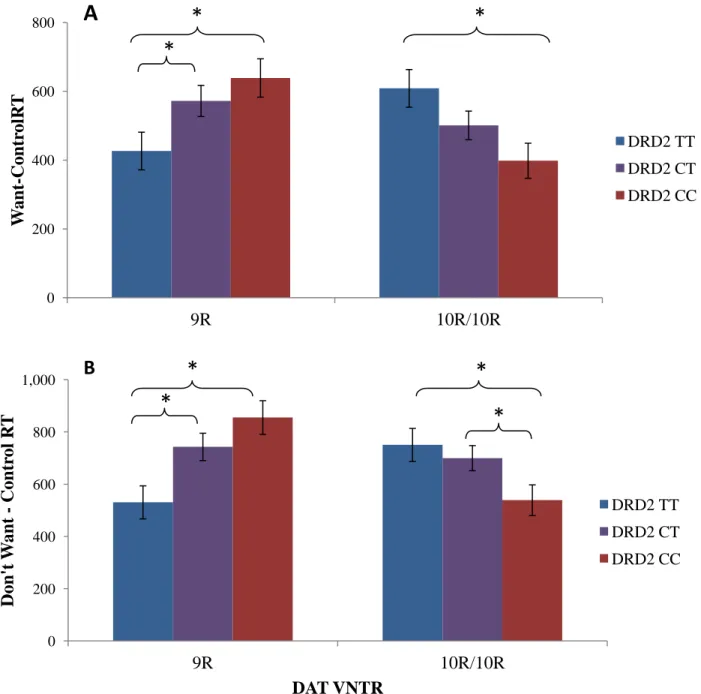
We found a significant DAT by DRD2 interaction effect on participant RT (even after controlling ethnicity, AUDIT, DUSI, and COMT). This effect was seen on WANT – CONTROL RT, a measure of how much longer it takes participants to make a subjective WANT choice compared to objective decisions about the rewards (SOONER and LARGER evaluations) (F(2,179)=5.813, p = .004). Within the DAT 9R carriers, the DRD2 TT group had a significantly faster RT compared with the DRD2 CT group (t(62)= 2.015, p=0.048) and the DRD2 CC group (t(49)=2.846, p=0.006). Within the DAT 10R homozygotes, the DRD2 TT group had a
CONTROL reaction times were similar between the groups, with no significant difference (t(49)=-0.325, p=0.747).
Showing similar trends as the WANT – CONTROL RT measure, there was a significant DAT by DRD2 interaction effect on DON’T WANT – CONTROL RT, (F(2,179)=6.957, p = 0.001), an additional measure comparing the objective decisions to an alternative subjective condition, even after controlling for group differences. Comparisons between individual genotype groups showed qualitatively similar results to the differences found between groups for WANT –
CONTROL RTs. Both the WANT and DON’T WANT versus CONTROL RT results can be seen in Figures 2.
Once again, there were no significant main effects of DAT or DRD2 alone on either of these RT measures. There were also no significant DAT by DRD2 interaction effects on RT in either the SOONER or LARGER objective, control conditions (SOONER RT: F(2,179)=1.745, p=0..178; LARGER RT: F(2,179) =2.230, p=0.110). There was a significant interaction effect of DAT by DRD2 on WANT RT (F(2, 179) = 5.921, p = 0.003), with groups showing a qualitatively similar pattern of RT differences as seen using the WANT – CONTROL RT measure. Each of these measures were made controlling for ethnicity, AUDIT, DUSI, and COMT.
Exp 2: Striatal DA and ICR as a function of delayed reward magnitude – between tasks
Group Characteristics/Behavioral Measures
In Experiment 2, three different task administration groups were evaluated: standard-standard, standard-10x, and standard-100x (order counter-balanced). The demographic
the other groups, and for FTPI mean extension scores (p=0.044), with participants in the standard-10x task group having reduced scores compared to the other two groups. Other demographic characteristics and behavioral measures did not differ significantly between participants in each of the three task groups.
Delay Discounting ICR Changes across Task Groups
As a DAT by DRD2 interaction effect on ICR delay amount slope was found in Experiment 1 (ICR changed as a function of delay reward value within the standard delay discounting task differentially based on DAT/DRD2 genotype), we looked to see whether participant delay discounting behavior (as indexed by ICR) was modulated by interactions between DAT and DRD2 as the magnitude of reward values changed across variations in our discounting task. As expected, task type by itself had a main effect on change in ICR
Delay Discounting ICR Changes by Task Group
For the standard-standard task group (identical reward values used for both tasks), there was no significant difference in participant ICR between task 1 (standard) and task 2 (standard) (F(1,41)=0.712, p=0.404). Further, there was no significant task type by DAT by DRD2
interaction effect on ICR change across separate administrations of the standard discounting task (F(2,41)=1.258, p=0.295).
For the standard-10x task group (standard reward values used in one task, 10x reward values used in the other task), there was a significant difference in participant ICR between task 1 (standard) and task 2 (10x) (F(1,37)=44.744, p<.001). This finding indicates participants
recorded lower ICR scores during the 10x reward task compared with their recorded ICR from the task with the smaller, standard reward values, which we hypothesized would be the case. However, as seen in the standard-standard task group, there was no significant task type by DAT by DRD2 interaction effect on ICR change between tasks (F(2,37)=1.026, p=0.368).
For the standard-100x task group (standard reward values used in one task, 100x reward values used in the other task), there was a significant difference in participant ICR between task 1 (standard) and task 2 (100x) (F(1,41)=53.121, p<.001), demonstrating that participants in this treatment group showed a decline in ICR in the task with the 100x reward values compared with ICR in the task with the standard reward values. Differing from the other task groups, the 100x task group showed a significant task type by DAT by DRD2 interaction effect on ICR
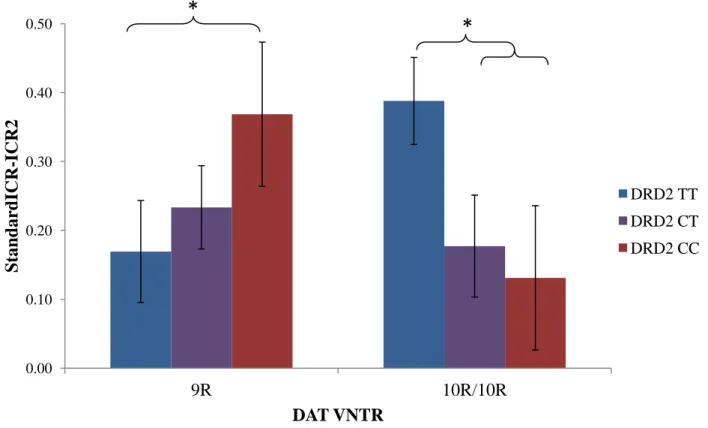
significantly smaller ICR change compared with the DRD2 CC group (t(10)= 2.252, p=0.048). Within the DAT 10R homozygotes, there was a trend towards the DRD2 TT group having a significantly greater ICR change compared with both the DRD2 CT group (t(17)= -1.89, p=0.076) and the DRD2 CC group (t(13)= -1.988, p=0.068). While the DRD2 TT group did not differ significantly from either the DRD2 CT or CC group, when these two C carrier groups were collapsed together, a significant difference was found between the TT group and the combined C carrier group (t(21)= -2.377, p=0.027), with the TT group having a greater ICR change. When looking at our hypothesized intermediate DA groups, there was no significant difference in ICR change (t(13)=0.158, p=0.877). The average ICR change between the groups was very similar (9R/CC M= 0.369±0.112; 10R/TT M= 0.388±0.230). The standard-100x task group ICR change results can be seen in Figure 3.
Discussion
The purpose of this study was to analyze whether variations in both the DAT and DRD2 striatal DA related genes had any predictive value on responsiveness to change in reward value, and if so, to attempt to more clearly discern this relationship between genetics, levels of striatal DA, and reward sensitivity. To accomplish this goal, we used two separate experiments, each with its own set of participants and operational measure of reward sensitivity, with the
expectation that similar results in each experiment would provide stronger support for findings of the study.
the 10R VNTR (Faraone et al., 2013), and previous findings have linked the DRD2 957T allele to greater DA binding potential than the 957C allele (Hirvonen et al., 2004; 2005), interpreted as greater DRD2 expression and lower striatal DA tone in the “T” allele. These studies provided support for the placement of the six genotype groups on a continuum of hypothesized,
genetically determined striatal DA availability. Based on these findings, we ranked the six genotype groups, from lowest striatal DA availability to highest as: DAT 9R, DRD2 TT < DAT 9R, DRD2 CT < DAT 9R, DRD2 CC < DAT 10R, DRD2 TT < DAT 10R, DRD2 CT < DAT 10R, DRD2 CC.
Exp 1: Striatal DA and ICR as a function of delayed reward magnitude – within task
Comparing the ICR delay amount slopes of the different genotype groups revealed a significant DAT by DRD2 interaction effect on slope steepness. This finding, along with the absence of main effect of either of the genes alone on slope, supports the idea that DAT and DRD2 likely interact, whether directly or indirectly, in their influence on reward-related neural pathways in the brain. Comparing the slope values of each of the six groups, going from the group with the least hypothesized DA availability (DAT 9R, DRD2 TT) to the group with the greatest hypothesized DA availability (DAT 10R, DRD2 CC) revealed an inverted U-shaped function of DA availability on slope, where the two groups with intermediate amounts of striatal DA had the steepest average slope, while groups with extreme amounts of DA availability (low or high) had the flattest slopes. In terms of reward sensitivity, this suggests that the intermediate DA groups were more responsive to changes in reward value than groups with more extreme levels of DA.
in differences between the genetic groups. The groups with intermediate DA levels took longer, on average, to make subjective choices (WANT, DON’T WANT) than the extreme DA groups did. This pattern was not observed, however, for the time it took to make objective, CONTROL decisions, suggesting that DAT and DRD2 genetic differences, and their resulting impacts on striatal DA and neural pathways, may be specifically implicated in deliberation and responding to rewards, rather than more general differences in global cognitive response speed or attention. It should also be noted that those who were more reward sensitive tended to take longer, on average, deliberating on their reward preference than those who were less reward sensitive. Given that those individuals who were most reward sensitive were also the most deliberative in making their subjective responses, we can rule out the possibility that, in this dataset, reward sensitivity is being driven by impulsivity in reward-related responding. If that were the case, we would have expected to see the intermediate striatal DA groups as relatively quicker at making a subjective response than those on the extreme ends of striatal DA. This effect was not observed. In fact, we observed no differences in trait impulsivity (BIS scores) between groups or cognitive impulsivity as measured by overall ICR. Thus, our striatal DA related findings do not appear to be driven by response, trait, or cognitive impulsivity differences across groups.
Exp 2: Striatal DA and ICR as a function of delayed reward magnitude – between task
Looking at how DAT, DRD2, and task group in the delayed discounting task variations (standard-standard, standard-10x, or standard-100x) impacted change in ICR between two task types (standard ICR – alternate ICR), we found that DAT and DRD2 interacted with task group to have a significant effect on ICR change. Individuals with intermediate levels of hypothesized striatal DA tone appeared to be most sensitive to the effects of increasing reward value across task types.
Because of our specific interest in the relationship between DAT and DRD2
polymorphisms on reward sensitivity, we looked at each task group on its own to see if any of the specific task conditions were demonstrative of a DAT by DRD2 influence on reward sensitivity. No interaction effect of DAT or DRD2 was seen on ICR change in either the standard-standard task group (which was to be expected, since there was no consistent change between the identical tasks) or the standard-10x task group. However, a significant interaction effect of DAT and DRD2 on ICR change in the standard-100x task group showed a pattern of reward sensitivity for the different genotype groups similar to that seen in Experiment 1. In this case, the more intermediate DA genotype groups had the greatest decrease in ICR going from the standard task to the 100x task, while the groups with more extreme DA levels had the least change in ICR. Relating ICR change to reward sensitivity, Experiment 2, like Experiment 1, suggests that proposed intermediate striatal DA groups were more sensitive to changes in reward value than the more extreme DA groups, as demonstrated by their greater change in “Now” choice selection (ICR) as a function of reward value.
Overall Conclusions
delay amount slope and ICR change across increasing reward value task types. In each of these relationships, the more intermediate DA groups showed greater sensitivity to changes in reward value than did DA groups that had either less or more expected DA. The fact that both of our experiments, with their independent participant sets and reward sensitivity paradigms,
corroborate in the effects of striatal DA on reward sensitivity provides strength to our findings. In support of the initial hypothesis that participants with more extreme amounts of striatal DA availability (those in the DAT 9R carriers, DRD2 TT, and DAT 10R homozyogtes, DRD2 CC genotype groups) would be the least sensitive to changes in reward value, while those more average/intermediate levels of striatal DA would be more sensitive to such changes, these results point towards the existence of some “optimal” intermediate level of DA relating to enhanced reward valuation. In contrast, deviation from this optimal DA level, whether through increased or decreased DA levels, may potentially hinder said processing. Overall, this study indicates that there is a distinct inverted U-shaped relationship between genetically predicted striatal DA tone and reward sensitivity, providing an indication of how DAT and DRD2 genotypes may have an interacting influence on reward processing.
Inverted U-Shaped DA-Behavioral Functioning Interactions
circuits are critical in reward related behaviors (Haber & Knutson, 2010). Additionally, Bertolino et al. (2009), examining DAT and DRD2 polymorphic differences, found preliminary evidence suggesting that these genes, through their effects on DA availability, interact to affect neural activity in both the prefrontal cortex and striatum, and the structure of gray matter in the caudate (part of the striatum). Similar to our findings, these effects were shown to take on a variety of inverted U-shaped relationships, providing further support to the idea that DAT and DRD2 may have interactive effects on a variety of cognitive, behavioral, and neurological measures.
While each of the above studies provides support for the inverted U-shaped DA influences in various parts of the brain in relation to cognitive processes such as working memory, neither study focused on how striatal DA influences reward-related behavior. The present study extends these results, providing evidence of an effect of striatal DA on behavioral functioning, specifically related to reward valuation. The existence of similar patterns of
DAT and DRD2 Interactions
The DAT by DRD2 genetic interactions and resulting inverted U-shaped influence on reward sensitivity shown by this study provide evidence that DAT genotype alone, and resulting DAT expression levels, are not sufficient to predict striatal DA-related behaviors. DAT
expression is high in the striatum, making it the major DA regulator and tone setter in this region (Cools et al., 2008). Our findings demonstrate that the DRD2 polymorphic context that a
particular DAT polymorphism operates in can modulate reward-related behavior, suggesting that DRD2 expression also has a major influence on how the striatum processes reward-related information.
Despite the unquestionable importance of DRD2 on striatal DA, the gene has not been the subject of much study, with only the Hirvonen studies (2004, 2009) looking extensively at the influence of the C957T polymorphism on striatal expression. As a result, mechanisms of DRD2 activity and influence on DA in the brain are unclear, and the global impact of the C957T SNP, beyond its association with receptor availability (Hirvonen et al., 2004) is not well
understood. In fact, Hirvonen et al. (2009) suggests that the SNP may have different
relationships to extrastriatal DA than it does to striatal DA. Nevertheless, our data suggests that, regardless of mechanism, DRD2 seems to have an influential role on mediating the effects of variations in the DAT gene on reward sensitivity, stressing the importance of using a multi-genetic model when analyzing the polymorphic effects of DAT on striatal DA and related behaviors.
2013). Depending on the DRD2 genotype composition of 9R and 10R DAT participant groups, we hypothesize that the experimentally determined effects of 9R and 10R DAT VNTRs on striatal DA may vary. As an example in the context of the present study, an investigation of the effect of DAT on reward sensitivity would have yielded different results based on whether there were more DRD2 CC or TT participants in either one of the DAT groups. For this reason, future studies investigating DAT expression in the striatum should take participant DRD2 genotype into account when analyzing the effects of different DAT genotypes on behaviors thought to be subserved by the striatum.
Implications
A more complete understanding of the manner in which striatal DA influences the activity of reward related regions of the brain may have the potential to assist in the treatment of individuals with various reward responsivity-related disorders. As mentioned by Andrews et al. (2011), a number of pathological conditions have been shown to be related to the reduced activation of various reward-related regions of the brain, as measured by fMRI during a monetary incentive delay task. Included among these conditions are substance abuse,
pathological gambling, and ADHD, all potentially debilitating problems if not properly treated. Additionally, Andrews et al. (2011) found this same pattern of reduced activity in the nucleus accumbens of at-risk individuals with a family history of alcoholism. Provided a link between neural activation and reward sensitivity, the present study’s findings describing how DAT, DRD2, and DA relate to reward sensitivity may play an important role in determining the proper treatment to fix the underlying neurological conditions possibly contributing to such disorders.
reward sensitivity, underlying dopaminergic contributors might vary significantly: for some people, reduced sensitivity may be due to having less than optimal amounts of DA in the striatum, while for others, it may be due to having too much DA. For these very different populations, divergent treatments would be necessary for a return to optimal levels of DA. If useful pharmacological treatments were to become available for these conditions, an
understanding of this curve, and an individual’s baseline level of DA, would be necessary in order to determine whether the best treatment for a given case of the same condition would be a DA agonist, to “increase” DA signaling, or a DA antagonist, to “decrease” DA signaling.
Another important link that these findings provide is the direct connection between DAT and DRD2 genotype and predicted reward sensitivity. This relationship may provide support for the use of a simple and effective genetically-based screening method for identifying individuals who belong to DAT and DRD2 groups that may potentially put them at risk for having the reduced reward responsivity that may be a risk factor for certain disorders. By providing an easy method for screening individuals for DA-related risk factors, as opposed to the more difficult task of testing DA levels directly through PET, potentially problematic cases may be identified before a more serious disorder presents itself, increasing the chances of helping individuals whose striatal DA tone could increase their risk for developing particular pathologies.
Future Directions
While the findings of this study help to clarify the role of DAT and DRD2 genetics and striatal DA on reward sensitivity, further research is needed to clarify the mechanisms by which these polymorphisms and DA influence behavior.
used were well substantiated, more direct study of how DAT and DRD2 polymorphisms functionally interact to influence DAT and DRD2 receptor expression and availability may provide more concrete support for the relationships between the two polymorphisms studied here. A PET study could be completed to assess DA receptor levels in the different genotype groups to determine whether receptor density correlates/tracks with DAT and DRD2 genetics as expected. Findings in such a study would be important in determining whether DAT and DRD2 polymorphic influences on receptor expression and striatal DA availability are actually what is driving differences in reward sensitivity, as this study suggests.
Additionally, it would be useful to be able to generalize the findings of the DAT and DRD2 effects on reward sensitivity to other reward related tasks. Genetic neuroimaging studies using other tasks, such as the commonly used monetary incentive delay task (Knutson et al., 2001), to look at reward sensitivity and other reward-related behaviors would provide support to the idea that DAT and DRD2 may have a relatively global influence on reward-related
behaviors. Similarly, it would be of interest to determine whether these results generalize to other DRD2 variants, such as the -141C insertion/deletion and TAQ 1A polymorphisms, DRD2 SNPS that have been widely studied in other behavioral, cognitive, and reward-related activities
Finally, it should be remembered that the dopaminergic system of the brain is extremely complex, and is influenced by far more factors than DAT and DRD2 expression alone. As a result, as research on reward sensitivity expands, the influence of a variety of other dopaminergic variables should be accounted for. The genes studied here are thought to primarily reflect tonic, global DA, but it is known that both tonic and phasic DA (DA levels in response to some stimulus) are important in influencing brain activity, and perhaps how the brain responds to rewards (Goto et al., 2007). These two types of dopaminergic signaling mechanisms may potentially interact to influence reward related behavior. As one example, a lower level of tonic DA could potentially lead to a more salient phasic response, while a higher level of tonic DA may make a similar phasic response stand out less from the baseline DA level. In each condition, the tonic DA context impacts the relative effects of phasic DA release and signaling in response to a stimulus. Also contributing to the complexity of the DA system are numerous other genes potentially interacting with DAT and DRD2 to influence dopaminergic pathways in the brain. One such gene, COMT, is thought to play a major role in modulating frontal DA, both tonic and phasic (Bilder et al., 2004; Dreher et al., 2009; Wu et al., 2012). Despite the fact that COMT is thought to be more involved in modulating frontal DA, it may also have downstream effects on striatal DA due to previously mentioned frontal-striatal loops involved in reward behavior. Demonstrating the potential importance of a variety of additional genes, Nikolova et al. (2011) created a DA profile score based on multiple genetic polymorphisms, including DAT and DRD2, but also COMT and DRD4. This score was found to have predictive value on reward-related VS reactivity, despite the lack of predictive power of any of the genes alone. In sum, the
References
Alessi, S. M., Petry, N. M. (2003). Pathological gambling severity is associated with impulsivity in a delay discounting procedure. Behav Processes, 64, 345-354.
Altamirano, L. J., Fields, H. L., D’Esposito, M., & Boettiger, C. A. (2011). Interaction between family history of alcoholism and locus of control in the opioid regulation of impulsive responding under the influence of alcohol. Alcohol Clin Exp Res, 35, 1905-1914. Anchordoguy, H. C., McGeary, C., Liu, L., Krauter, K. S., Smolen, A. (2003). Genotyping of
three candidate genes following whole genome preamplification of DNA collected from buccal cells. Behav Genet, 33, 73-78.
Andrews, M. M., Meda, S. A., Thomas, A. D., Potenza, M. N., Krystal, J. H., Worhunsky, P., …, Pearlson, G. D. (2011). Individuals family history positive for alcoholism show
functional magnetic resonance imaging differences in reward sensitivity that are related to impulsivity factors. Biol Psychiatry, 69, 675-683.
Barratt, W. (2006). The Barratt Simplified Measure of Social Status (BSMSS) measuring SES. Unpublished manuscript, Indiana State University.
Bertolinoi, A., Fazio, L., Di Giorgio, A., Blasi, G., Romano, R., Taurisano, P., … Sadee, W. (2009). Genetically determined interaction between the dopamine transporter and the D2 receptor on prefronto-striatal activity and volume in humans. Journal of Neuroscience, 29, 1124-1234.
Boettiger, C. A., Mitchell, J. M., Tavarea, V. C., Robertson, M., Joslyn, G., D’Esposito, M., Fields, H. L. (2007). Immediate reward bias in humans: Fronto-parietal networks and a role for the catechol-o-methyltransferase 158Val/Val genotype. The Journal of
Chen, A.C., Porjesz, B., Rangaswamy, M., Kamarajan, C., Tang, Y., Jones, K. A., …Begleiter, H. (2007). Reduced frontal lobe activity in subjects with high impulsivity and alcoholism. Alcohol Clin Exp Res, 31, 156-165.
Costa, A., Riedel, M., Muller, U., Moller, H-J., Ettinger, U. (2011). Relationship between SLC6A3 genotype and striatal dopamine transporter availability: A meta-analysis of human single photon emission computed tomography studies. Synapse, 65, 998-1005. Cools, R. (2008). Role of dopamine in the motivational and cognitive control of behavior.
Neuroscientist, 14(4), 381-395.
Cools, R., D’Esposito, M. (2011). Inverted-U-shaped dopamine actions on human working memory and cognitive control. Biol Psychiatry, 69, e113-e125.
Cools, R., Robbins, T. W. (2004). Chemistry of the adaptive mind. Philos Transact A Math Phys Eng Sci, 362, 2871-2888.
Dickinson, S. D., Sabeti, J., Larson, G. A., Giardina, K., Rubinstein, M., Kelly, M. A., … Zahniser, N. R. (1999). Dopamine D2 receptor-deficient mice exhibit decreased
dopamine transporter function but no changes in dopamine release in dorsal stratium. J Neurochem, 72, 148-156.
Dreher, J-C., Kohn, P., Kolachana, B., Weinberger, D. R., Berman, K. F. (2009). Variation in dopamine genes influences responsivity of the human reward system. PNAS, 106, 617-622.
Faraone, S. V., Spencer, T. J., Madras, B. K., Zhang-James, Y., Biederman, J. (2013). Functional effects of dopamine transporter gene genotypes on in vivo dopamine transporter
functioning: a meta-analysis. Molecular Psychiatry. Advance online publication. doi: 10.1038/mp.2013.126.
Forbes, E. E., Brown, S. M., Kimak, M., Ferrell, R. E., Manuck, S. B., Hariri, A. R. (2009). Genetic variation in components of dopamine neurotransmission impacts ventral striatal reactivity associated with impulsivity. Molecular Psychiatry, 14, 60-70.
Goldman-Rakic, P. S., Muly, E. C. 3rd, Wiliams, G. V. (2000). D(1) receptors in prefrontal cells and circuits. Brain Res Brain Res Rev, 31, 295-301.
Goto, Y., Otani, S., Grace, A. A. (2007). The yin and yang of dopamine release: a new perspective. Neuropharmacology, 53, 583-587.
Green, L., Myerson, J., McFadden, E. (1997). Rate of temporal discounting decreases with amount of reward. Mem Cognit, 25, 715-723.
Haber, S. N., Knutson, B. (2010). The reward circuit: Linking primate anatomy and human imaging. Neuropsychopharmacology, 35, 4-26.
Hariri, A. R., Brown, S. M., Williamson, D. E., Flory, J. D., de Wit, H., Manuck, S. B. (2006). Preference for immediate over delayed rewards is associated with magnitude of ventral striatal activity. Journal of Neuroscience, 26, 13213-13217.
Hirvonen, M., Laakso, A., Nagren, K., Rinne, J. O., Pohjalainen, T., Hietala, J. (2004). C957T polymorphism of the dopamine D2 receptor (DRD2) gene affects striatal DRD2 availability in vivo. Molecular Psychiatry, 9, 1060-1061.
Hirvonen, M., Laakso, A., Nagren, K., Rinne, J. O., Pohjalainen, T., Hietala, J. (2005). C957T polymorphism of the dopamine D2 receptor (DRD2) gene affects striatal DRD2 availability in vivo. Molecular Psychiatry, 10, 889.
Hirvonen, M., Laakso, A., Nagren, K., Rinne, J. O., Pohjalainen, T., Hietala, J. (2009). C957T polymorphism of dopamine D2 receptor gene affects striatal DRD2 in vivo availability by changing the receptor affinity. Synapse, 63, 907-912.
Kagel, J. H., Battalio, R. C., Green, L. (1995). Economic choice theory: An experimental analysis of animal behavior. Cambridge, England: Cambridge University.
Kirby, K. N., Marakovic, N. N. (1996). Delay-discounting probabilistic rewards: Rates decrease as amounts increase. Psychonomic Bulletin & Review, 3, 100-104.
Kirby, K. N., Petry, N. M., Bickel, W. K. (1999). Heroin addicts have higher discount rates for delayed rewards than non-drug using controls. J Exp Psychol Gen, 128, 78-87.
Knutson, B., Adams, C. M., Fong, G. W., Hommer, D. (2001). Anticipation of increasing monetary reward selectively recruits nucleus accumbens. Journal of Neuroscience, 21, RC 159.
Mann, R. E., Sobell, L. C., Sobell, M. B., Pavan, D. (1985). Reliability of a family tree
questionnaire for assessing family history of alcohol problems. Drug Alcohol Depend, 15, 61-67.
Manuck, S. B., Flory, J. D., Muldoon, M. F., Ferrell, R. E. (2003). A neurobiology of
intertemporal choice. In: Time and decision: economic and psychological perspectives on intertemporal choice (pp. 139-172). New York, NY: Sage.
Mata. R., Hau, R., Papassotiropoulos, A., Hertwig, R. (2012). Dat1 polymorphism is associated with risk taking in the balloon analogue risk task (BART). Plos One, 7, 1-7.
Mattay, V. S., Goldberg, T. E., Fera, F., Hariri, A. R., Tessitore, A., Egan, M. F., … Weinberger, D. R. (2003). Catechol O-methyltransferase val 58-met genotype and individual variation in the brain response to amphetamine. Proc Natl Acad Sci USA, 100, 6186-6191.
Mazur, J. E., Vaughan, W. Jr. (1987). Molar optimization versus delayed reinforcement as explanations of choice between fixed-ratio and progressive-ratio schedules. J Edp Anal Behav, 48, 251-261.
McClure, S. M., Laibson, D. I., Loewenstein, G., Cohen, J. D. (2004). Separate neural systems value immediate and delayed monetary rewards. Science, 306, 503-507.
Meiergerd, S. M., Patterson, T. A., Schenk, J. O. (1993). D2 receptors may modulate the function of the striatal transporter for dopamine: Kinetic evidence from studies in vitro and in vivo. J Neurochem, 61, 764-767.
Mitchell, J. M., Fields, H. L., D’Esposito, M., Boettiger, C. A. (2005). Impulsive responding in alcoholics. Alcoholic Clinical and Experimental Research, 29, 2158-2169.
Mortensen, O. V., Amara, S. G. (2003). Dynamic regulation of the dopamine transporter. Eur J Pharmacol, 479, 159-170.
Parsons, L. H., Schad, C. A., Justice, J. B. Jr. (1993). Co-administration of the D2 antagonist pimozide inhibits up-regulation of dopamine release and up-take induced by repeated cocaine. J Neurochem, 60, 376-379.
Patton, J. H., Stanford, M. S., Barratt, E. S. (1995). Factor structure of the Barratt Impulsiveness Scale. J Clin Psychol, 51, 768-774.
Rachlin, H. (1989). Chapter 5. Judgment, decision, and choice: A cognitive/behavioral synthesis. New York: Freeman.
Reuter, J., Raedler, T., Rose, M., Hand, I., Glascher, J., Buchel, C. (2005). Pathological
gambling is linked to reduced activation of the mesolimbic reward system. Nat Neurosci, 8, 147-148.
Rokem, A., Landau, A.N., Prinzmetal, W., Wallace, D.L., Silver, M.A., D’Esposito, M. (2012). Modulation of inhibition of return by the dopamine D2 receptor agonist bromocriptine depends on individual DAT1 genotype. Cerebral Cortex, 22, 1133-1138.
Saunders, J. B., Aasland, O. G., Babor, T. F., de le Fuente, J. R., Grant, M. (1993). Development of the alcohol use disorders identification test (AUDIT). WHO collaborative project on early detection of persons with harmful alcohol consumption – II. Addiction, 88, 791-804. Scheres, A., Milham, M. P., Knutson, B., Castellanos, F. X. (2007). Ventral striatal
Scott, D. J., Stohler, C. S., Egnatuk, C. M., Wang, H., Koeppe, R. A., Zubieta, J. (2007). Individual differences in reward responding explain placebo-induced expectations and effects. Neuron, 55, 325-336.
Shumay, E., Chen, J., Fowler, J. S., Volkow, N. D. (2011). Genotype and ancestry modulate brain’s DAT availability in healthy humans. PLoS One, 6, e22754.
Siessmeier, T., Kienast, T., Wrase, J., Larsen, J. L., Braus, D. F., Smolka, M. N., …, Heinz, A. (2006). Net influx of plasma 6-[18F]fluoro-l-DOPA (FDOPA) to the ventral striatum correlates with prefrontal processing of affective stimuli. Eur J Neurosci, 24, 305-313. Sibley, D. R., Monsma Jr., F. J., Shen, Y. (1993). Molecular neurobiology of dopaminergic
receptors. Int Rev Neurobiol, 35, 391-415.
Skinner, H. A. (1982). The drug abuse screening test. Addict Behav, 7, 363-371.
Smith, C. T., Boettiger, C. A. (2012). Age modulates the effect of COMT genotype on delay discounting behavior. Psychopharmacology, 222, 609-617.
Strohle, A., Stoy, M., Wrase, J., Schwarzer, S., Schlagenhauf, F., Huss, M., …, Heinz, A. (2008). Reward anticipation and outcomes in adult males with attention-deficit/hyperactivity disorder. Neuroimage, 39, 966-972.
Tarter, R. (1990). Evaluation and treatment of adolescent substance abuse: A decision ree method. Am J Drug Alcohol Abuse, 16, 1-46.
Van Schouwengurg, M., Aarts, E., Cools, R. (2010). Dopaminergic modulation of cognitive control: Distinct roles for the prefrontal cortex and the basal ganglia. Curr Pharm Des, 16, 202-2032.
Vandenbergh, D. J., Persico, A. M., Uhl, G. R. (1992). Human dopamine transporter gene (DATI) maps to chromosome 5p15.3 and displays a VNTR. Genomics, 14, 1104-1106. VanNess, S. H., Owens, M. J., Kilts, C. D. (2005). The variable number of tandem repeats
element in DATI regulates in vitro dopamine transporter density. BMC Genetics, 6, 1-11. Wallace, M. (1956). Future time perspective in schizophrenia. J Abnorm Psychol, 52, 240-245. Wrase, J., Schlagenhauf, F., Kienast, T., Wustenberg, T., Bermpohl, F., Kahnt, T., …, Heinz, A.
(2007). Dysfunction of reward processing correlates with alcohol craving in detoxified alcoholics. Neuroimage, 35, 787-794.
Table 1. Experiment 1: Demographic data by genotype groups (ages 18-25)
DRD2 C/C DAT 10R
(n = 30)
DRD2 C/T DAT 10R
(n = 45)
DRD2 T/T DAT 10R
(n = 26)
DRD2 C/C DAT 9R
(n = 25)
DRD2 C/T DAT 9R (n = 38)
DRD2 T/T DAT 9R
(n = 26) F(2, 184) (p)
Demographics
Age (yrs) 21.2 ± 2.1 21.4 ± 1.9 20.8 ± 1.7 21.2 ± 2.0 20.8 ± 1.9 21.2 ± 2.0 1.034 (0.357) Edu (yrs) 14.8 ± 1.5 14.8 ± 1.4 14.6 ± 1.6 14.7 ± 1.8 14.8 ± 2.0 14.7 ± 1.5 0.070 (0.932)a Subject SES 50.4 ± 9.4 49.0 ± 9.7 52.4 ± 8.1 49.7 ± 9.2 52.7 ± 6.2 49.3 ± 8.7 2.689 (.071) Sex
(% female)
50.0 44.4 50.0 68.0 47.4 42.3 (0.480)†#
Ethnicity (% white)
16.7 71.1 92.3 72.0 94.7 88.5 (<.001)†#
COMT (% MM) 13.3 28.9 23.1 32.0 26.3 46.2 (.008)†$
Psychometrics
AUDIT 8.2 ± 5.5 10.3 ± 6.9 8.5 ± 6.0 8.3 ± 5.6 6.6 ± 4.6 10.3 ± 5.3 4.058 (0.019)b Consump. 4.7 ± 3.0 5.6 ± 2.5 5.1 ± 2.4 4.7 ± 2.0 4.4 ± 2.3 5.7 ± 2.3 2.247 (0.109)c Dependence 1.1 ± 1.2 1.4 ± 1.7 1.0 ± 1.5 0.9 ± 1.2 0.6 ± 1.0 1.0 ± 1.1 1.817 (0.166)c Conseq. 2.3 ± 2.3 3.4 ± 3.3 2.8 ± 2.9 2.8 ± 3.1 1.6 ± 1.9 3.6 ± 2.9 4.042 (0.019)c BISCUM 59.4 ± 10.2 59.5 ± 10.3 59.6 ± 9.7 62.5 ± 9.1 59.8 ± 8.6 59.6 ± 9.3 0.454 (0.636)b BISAttn 15.3 ± 3.8 15.5 ± 3.8 15.8 ± 3.4 16.6 ± 2.7 16.2 ± 3.4 16.0 ± 3.2 0.357 (0.700)b BISMotor 21.9 ± 3.2 21.7 ± 4.2 22.5 ± 3.7 22.5 ± 3.7 22.2 ± 3.7 21.8 ± 3.8 0.426 (0.654)b BISPlanning 22.2 ± 4.9 22.2 ± 4.5 21.4 ± 4.7 23.4 ± 4.9 21.3 ± 4.1 21.8 ± 5.1 0.853 (0.428)b DAST 2.1 ± 2.6 2.3 ± 2.4 2.1 ± 2.4 1.9 ± 2.4 1.7 ± 2.0 2.5 ± 2.7 0.653 (0.522) DUSI 0.25 ± 0.21 0.32 ± 0.21 0.26 ± 0.17 0.30 ± 0.21 0.23 ± 0.17 0.34 ± 0.18 4.382 (0.014) FTPI Mean 7.4 ± 5.2 7.7 ± 6.4 7.9 ± 4.9 8.7 ± 6.5 8.4 ± 5.2 6.8 ± 5.8 0.619 (0.540) RAPI 8.6 ± 8.5 10.7 ± 10.3 7.7 ± 6.7 8.1 ± 7.1 6.1 ± 6.7 9.0 ± 5.3 2.481 (0.086) FTQ Ratio 0.10 ± 0.14 0.11 ± 0.14 0.15 ± 0.15 0.14 ± 0.15 0.14 ± 0.14 0.15 ± 0.15 0.184 (0.832)
Values are reported as mean ± standard deviation. F and p-values are reported for DAT by DRD2 group interactions. †p-value for results of χ2
Table 2. Experiment 1: Demographic data by genotype groups (ages 18-25)
DRD2 C/C DAT 10R
(n = 30)
DRD2 C/T DAT 10R
(n = 45)
DRD2 T/T DAT 10R
(n = 26)
DRD2 C/C DAT 9R
(n = 25)
DRD2 C/T DAT 9R
(n = 38)
DRD2 T/T DAT 9R
(n = 26)
F(2, 184) (p)
DDTask RT
Sooner RT 1302 ± 438 1359 ± 296 1300 ± 342 1353 ± 327 1218 ± 385 1318 ± 330 1.446 (0.238) Larger RT 1489 ± 403 1497 ± 274 1511 ± 333 1555 ± 270 1356 ± 314 1495 ± 318 1.792 (0.170) WantRT 1794 ± 399 1929 ± 348 2014 ± 383 2093 ± 325 1859 ± 392 1833 ± 402 6.198 (0.002) DontWantRT 1934 ± 433 2128 ± 362 2156 ± 414 2309 ± 330 2030 ± 450 1937 ± 461 8.136 (<.001)
Overall Data
Control Acc. 95.7 ± 6.0 96.2 ± 4.0 96.7 ± 2.5 97.2 ± 3.0 97.5 ± 3.0 97.3 ± 1.9 0.265 (0.767) ICR Average 0.75 ± 0.28 0.66 ± 0.31 0.67 ± 0.26 0.67 ± 0.22 0.58 ± 0.30 0.62 ± 0.37 0.005 (0.946)
ICRDelayAmt
Intercept 0.90 ± 0.32 0.88 ± 0.35 0.95 ± 0.36 0.96 ± 0.21 0.83 ± 0.38 0.76 ± 0.42 1.779 (0.172)
AUC 66.8 ± 27.9 56.1 ± 30.9 52.3 ± 26.6 52.6 ± 25.6 46.2 ± 29.6 54.3 ± 35.4 1.068 (0.346)
Table 3. Experiment 2 Demographic data by Task Group
Standard, Standard (n = 48)
Standard, 10x (n = 48)
Standard, 100x (n = 48)
F(2, 141) (p)
Demographics
Age (yrs) 21.4 ± 1.7 21.5 ± 2.1 21.2 ± 1.8 0.377 (0.687)
Edu (yrs) 15.2 ± 1.5 15.2 ± 1.5 15.0 ± 1.6 0.290 (0.749)a Subject SES 43.0 ± 3.6 43.6 ± 4.6 43.0 ± 2.8 0.222 (0.801)b
Sex (% female) 50.0 50.0 50.0 (1.000)†#
Ethnicity (% white) 76.6 66.7 81.3 (0.226)†#
Psychometrics
AUDIT 8.52 ± 5.30 7.94 ± 5.53 8.38 ± 5.48 0.150 (0.861)
Consump. 5.40 ± 2.63 4.56 ± 2.35 5.02 ± 2.42 1.387 (0.253)a Dependence 0.94 ± 1.11 0.88 ± 1.08 0.88 ± 1.27 0.044 (0.957)a Harm 2.28 ± 2.50 2.48 ± 2.92 2.48 ± 2.67 0.089 (0.915)a
BIS 62.2 ± 10.0 59.9 ± 10.8 58.5 ± 9.6 1.659 (0.194)
BIS Attention 16.3 ± 3.6 15.9 ± 3.7 15.8 ± 3.6 0.213 (0.809) BIS Motor 22.3 ± 4.3 21.5 ± 4.2 21.8 ± 3.9 0.395 (0.675) BIS Planning 23.5 ± 4.8 22.3 ± 4.8 20.9 ± 4.6 3.519 (0.032)
DAST 1.92 ± 2.05 2.17 ± 2.60 2.44 ± 2.54 0.478 (0.621)c
DUSI 0.25 ± 0.19 0.27 ± 0.18 0.26 ± 0.20 0.080 (0.923)
FTPI Mean 8.41 ± 6.31 5.74 ± 4.92 8.05 ± 5.53 3.192 (0.044)
RAPI 8.54 ± 8.04 7.38 ± 7.17 8.27 ± 8.44 0.265 (0.767)c
FTQ Ratio 0.11 ± 0.14 0.13 ± 0.15 0.14 ± 0.14 0.789 (0.456)
Values are reported as mean ± standard deviation. F and p-values are reported for DAT by DRD2 group interactions.
Figure 1. DAT and DRD2 genotype interact to affect ICR by delayed amount slope. A between subjects 2 by 3 ANOVA revealed a significant interaction effect of DAT and DRD2 on ICR by delayed amount slope (F(2, 179)=10.340, p<.001). Post-hoc independent samples t-tests revealed significant (p<0.05) ICR delayed amount slope differences (as indicated, *) between several of the genotype groups. (9R = DAT 9R VNTR carrier; 10R/10R = DAT 10R VNTR homozygote; TT = DRD2 C957T homozygote; CT = DRD2 C957T heterozygote; CC = DRD2 957C
homozygote)
-0.35 -0.3 -0.25 -0.2 -0.15 -0.1 -0.05 0
9R 10R/10R
ICR
S
lop
e b
y
De
lay
Am
ou
n
t
DAT VNTR
DRD2 TT
DRD2 CT
DRD2 CC
*
*
Figure 2. DAT and DRD2 interact to affect differences in subjective versus objective reaction times. Figure 2A. A between subjects 2 by 3 ANOVA revealed a significant interaction effect of DAT and DRD2 on reaction time difference, calculated as WANT RT – CONTROL RT (F(2, 179)=5.813, p=0.004). Post-hoc independent samples t-tests revealed significant (p<0.05) differences in this reaction time measure (as indicated, *) between several of the genotype groups. RT, reaction time. Figure 2B.DAT and DRD2 interact to affect differences in DON’T WANT versus objective reaction times. A between subjects 2 by 3 ANOVA revealed a significant interaction effect of DAT and DRD2 on reaction time difference, calculated as DON’T WANT RT – CONTROL RT (F(2, 179)=6.957, p<.001). Post-hoc independent samples t-tests revealed significant (p<0.05). differences in this reaction time measure (as indicated, *) between several of the genotype groups. RT, reaction time.
0 200 400 600 800
9R 10R/10R
W an t-Contr olR T DRD2 TT DRD2 CT DRD2 CC 0 200 400 600 800 1,000
9R 10R/10R
Figure 3. DAT and DRD2 genotype interact to affect between task change in ICR when reward values increased to 100x. A between subjects 2 by 3 ANOVA revealed a significant interaction effect of DAT and DRD2 on differences in ICR change (F(2, 41)=3.911, p=0.028). Differences in ICR change were calculated by subtracting ICR from the 100x delay discounting task from ICR from the standard delay discounting task. Post-hoc independent samples t-tests revealed
significant (p<0.05) differences in this ICR change measure (as indicated, *), between the DAT 9R DRD2 TT and DAT 9R DRD2 CC group and between the DAT 10R DRD2 TT group and DAT 10R DRD2 C carriers.
0.00 0.10 0.20 0.30 0.40 0.50
9R 10R/10R
S
tand
ar
d
ICR
-ICR
2
DAT VNTR
DRD2 TT
DRD2 CT
DRD2 CC