190
Bi-objective optimization of a blood supply chain network with
reliability of blood centers
Hassan Heidari-Fathian
1, Seyed Hamid Reza Pasandideh
1*1Department of Industrial Engineering, Faculty of Engineering, Kharazmi University, Tehran, Iran [email protected], [email protected]
Abstract
This paper presents a multi-periodic, multi-echelon blood supply chain network consisting of blood donors, mobile collection units, local blood centers, main blood centers and demand points in which the local and main blood centers are subject to random failure in dispatching blood products to demand points. The problem has two objectives including minimization of the total chain costs and maximization of the reliability of the local and main blood centers by maximizing the average total number of blood products dispatched to demand points. The problem is first formulated as a mixed-integer linear mathematical model. Then, to solve the problem, three multi-objective decision-making (MODM) methods including Elastic Bounded Objective Method, Modified augmented ε-constraint method and LP-metric method are employed for the solution. Thirty different examples are solved to assess the performance of the solution methods and their results are compared statistically. Using ELECTRE method, the best solution method is selected. At the end, to determine the effect of the change in the main parameters of the problem on the objective functions values, sensitivity analysis is performed.
Keywords
:
Blood supply chain, perishable product, Reliability, MODM, Multiple comparisons, ELECTRE1- Introduction
Like other supply chains, a blood supply chain network consists of several different echelons including blood donors, blood collection facilities, component labs, storage facilities, distribution centers and demand points (Nagurney et al. 2012). The management of perishable products is a considerable issue in Supply chain management. Human blood is a perishable and worthwhile resource that the life of human beings is strongly dependent on it and any untimely supply of this urgent product to demand points could cause irreparable damages and lives may be lost. Demand points receive blood products from blood centers. Blood centers are responsible for receiving, transfusing and finally dispatching blood products to demand points. There are some different types of blood centers that are divided into the two main categories: Dynamic blood centers and static blood centers.
*Corresponding author
ISSN: 1735-8272, Copyright c 2018 JISE. All rights reserved
Journal of Industrial and Systems Engineering Vol. 11, No. 3, pp. 190-213
191
Dynamic blood centers are usually buses or coaches that are driven to locations accessible to donors. But static blood centers are facilities for blood donation in fixed or permanent locations with more donation capacities rather than dynamic blood centers. They receive whole blood from donors and also from dynamic blood centers and produce several different blood product from them: red blood cells, white blood cells, platelets, serum, and plasma. All of the produced components except for plasma have a limited shelf life and can become outdated. For example, platelet has a very short shelf life among them and becomes unusable after six days. For this reason, static blood centers have to be reliable to dispatch blood products to demand point. If a blood center is not able to service the demand points due to any reason in a period, a demand point may don’t receive its demand and some of the patients may lose their life. On the other hand, the blood remained to the blood centers owing to the unreliability of blood centers to dispatch them to demand points, may become outdated.
This paper formulates the problem into a mixed-integer linear mathematical model with two conflicting objectives including minimization of the total chain costs and maximization of the reliability of the local and main blood centers by maximizing the average total number of blood dispatched to demand points. A probability distribution based on the exponential distribution is used for considering the issue of reliability in the proposed model. In the proposed model, a new assumption is considered for the sequence visits of the mobile collection units. For solving the proposed mathematical model, three multi-objective decision making (MODM) methods are employed and their applicability is evaluated statistically using Tukey method. Also, the ELECTRE method is used to select the best solution method.
The reminder of this paper is organized as follows. Section 2 reviews the related literature. The problem description and the mathematical model are given in section 3. Section 4 discusses the solution methods to solve the problem. The performance of the solution methods is evaluated in section 5. Section 6 contains sensitivity analysis on the effects of some input parameters on the objective functions values. Finally, conclusions and future researches come in Section7.
2- Literature review
Management of the perishable products in a supply chain network has received the considerable attention of many researchers for a number of years. For example, Niakan and Rahimi (2015) extended a multi-objective model for Routing Problem for of a medicinal drug distribution to healthcare facilities with considering perishability of drugs. Sarker et al. (2000) developed a supply chain model to determine an optimal ordering policy for deteriorating items under inflation. Blackburn and Scudder (2009) examined supply chain design strategies for a specific type of perishable product. Blood, as a perishable product is also an interesting field for researchers. But the majority of literature in the blood supply chain management is about individual echelons and does not consider relationships between the different stages. For example, Elston and Pickrel (1963) considered a simulation based study to ordering and usage policies for a hospital blood bank. Cumming et al. (1976) investigated a planning model to assist regional blood suppliers in diminishing seasonal imbalances between the supply of and demand for blood. Abdulwahab and Wahab (2014) introduced a model for the establishment of an inventory bank holding perishable blood platelets with a short shelf life. Their model considered a blood platelet bank with stochastic demand, stochastic supply, and formulated using approximate dynamic programming. Gunpinar and Centeno (2015) presented stochastic and deterministic models to minimize the total cost, shortage and wastage levels of blood products at a hospital within a planning horizon. Their focus was on the red blood cells and the platelet components of the whole blood. Gunpinar and Centeno (2016) proposed a vehicle routing problem for a blood center to identify the number of bloodmobiles to operate and minimize the distance traveled. Similar studies can also be found in Hemmelmayr et al. (2009), Bosnes et al. (2005), Pereira (2006), Lowalekar and Ravichandran (2015). Recently, publications have aimed to connect the echelons with each other by considering the whole of the supply chain. Osorio et al. (2015) reviewed the related works on modelling for the blood product supply chain. Sahin et al. (2007), formulated several mathematical problems to address the location–allocation aspects of regionalization of blood services of the Turkish Red Crescent Society. They assumed that demand for blood and blood products at a certain site is completely uncertain. Fahimnia et al. (2015) suggested a supply chain design
192
model for the efficient and effective supply of blood in disasters. They considered different echelons including blood donors, mobile blood facilities, local and regional blood centers, and demand points. A similar problem is studied in Jabbarzadeh et al. (2014). Chaiwuttisak et al. (2016) developed a model for the blood supply chain of the Thailand Red Cross Society using low-cost collection and distribution centers. In another work, Zahiri et al. (2015) proposed a mixed integer linear programming model to make strategic as well as tactical decisions in a multi-echelon system over a multi-period planning horizon. They applied a robust possibilistic programming approach to cope with the epistemic uncertainty in the demand and supply data. Zahiri and Pishvaee (2017) considered compatibility of blood groups in their works by presenting a bi-objective mathematical model for simultaneous minimization of the total cost and the maximum unsatisfied demand.
Different types of solution methods have been implemented to solve the blood supply chain problems. Zahiri et al. (2015), Jabbarzadeh et al. (2014), Fahimnia et al. (2015), Sahin et al. (2007), Chaiwuttisak et al. (2016), Gunpinar and Centeno (2016), Nagurney et al. (2012) used integer programming in their works and Cohen et al. (1976), Blake (2009) used stochastic dynamic programming. In Kamp et al. (2010), Gregor et al. (1982), Michaels et al. (1993), Alfonso et al. (2012) simulation methods and in Pegels and Jelmert (1970), Kaspi and Perry (1983), Kopach (2008) queuing methods were used.
Regarding the literature review, the goal of the present work is to design a supply chain framework for management of blood as a vital resource with considering the economic aspects, uncertainty, and the perishability of the blood. The main contributions of this research are presented in the following:
A new mathematical model is proposed to design a reliable blood supply chain network
Different echelons of the blood supply chain network including blood donors, mobile collection units, local blood centers, main blood centers and hospitals are considered in the model
A probability distribution based on the exponential distribution is used to consider the issue of reliability in the proposed model
The model has two conflicting objective functions for minimization of the costs of the supply chain network and also maximization of the average total number of blood dispatched to demand points
Shelf life of blood are considered in the problem and the model tries to minimize the wastage of blood in the cost objective function
A new assumption is considered for the sequence visits of the mobile collection units from the candidate locations
Three multi-objective decision making (MODM) methods are employed to solve the proposed mathematical model
The solution methods are compared to each other using a statistical approach The ELECTRE method is applied to rank the solution methods.
3- Problem modeling
This section includes notations, problem description, and the mathematical model.
3-1- Notations
The following notations including indices, parameters, and decision variables are used in the proposed model.
Indices:
i: index used for a donor group, i=1,...,I
y,j:index of candidate locations for mobile collection units, y=1,...,Y p: index used for a mobile collection unit, p=1,…,P
l: index used for a local blood center, l=1,...,L m: index used for a main blood center, m=1,…,M
193 ,
t t : index used for a period with a fixed length of v , t=1,…,T
Parameters: yjpt
U : Cost of moving mobile collection unit p from location j to location y in period t
it
MAXB : Maximum blood supply of donor group i in period t
ypt
uc
: Unit operational cost of mobile collection unit p at location y in period t ltulc
: Unit operational cost at local blood center l in period t mtumc : Unit operational cost at main blood center m in period t ypmt
cmm : Unit transportation cost from mobile collection unit p located at location y to main blood center m in period t
lmt
clm : Unit transportation cost from local blood center l to main blood center m in period t
lht
clh
: Unit transportation cost from local blood center l to hospital h in period t mhtcmh : Unit transportation cost from main blood center m to hospital h in period t
lt
hcl
: Unit holding cost at local blood center l in period t mthcm
: Unit holding cost at main blood center m in period t htsc
: Unit shortage cost at hospital h in period t pcap : The capacity of mobile collection unit p
l
cap
: Storage capacity available for local blood center l to store blood in a periodm
cap
: Storage capacity available for main blood center m to store blood in a periodiy
dy : Distance between donor i and location y
il
dl
: Distance between donor i and local blood center lcd
: Coverage distance of blood facilitiesr
: Referral rate: the rate of processes that local blood centers can’t fulfill and they have to direct them to main blood centers,
m t
smh
: Shelf life of blood products that are sent from main blood center m to hospital h in period t,
l t
slh : Shelf life of blood products that are sent from local blood center l to hospital h in period t
M :A reasonably large number
ex
ht : Unit expiration cost of blood products at hospital h in period tmt
: Failure rate of main blood center m to dispatch blood products to demand points in period t lt
: Failure rate of local blood center l to dispatch blood products to demand points in period t htD
: Demand for blood product at hospital h in period t Variables:yjpt
X : 1, if mobile collection unit p travels from location j to location y in period t, 0 otherwise
iyt
O
: 1, if location y is assigned to donor i in period t, 0 otherwiseilt
G
: 1, if local blood center l is assigned to donor i in period t under, 0 otherwiselmt
194
iypmt
NBM : Quantity of blood collected at location y from donor i in period t by mobile collection unit p to dispatch to main blood center m
ilt
NBL : Quantity of blood collected at local blood center l from donor i in period t
lmt
NLM : Quantity of blood dispatched by local blood center l to main blood center m in period t
lhtt
NLH
: Quantity of transfused blood dispatched by local blood center l to hospital h in period t
to be used in period
t
mhtt
NMH
: Quantity of transfused blood dispatched by main center m to hospital h in period t to beused in period
t
lt
IL
: Inventory level of blood at local blood center l at the end of period t mtIM
: Inventory level of blood at main blood center m at the end of period tht
S
: Shortage quantity of blood at hospital i at the end of period t3-2- Problem description
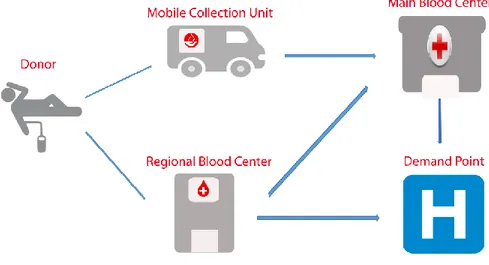
Consider a blood supply chain network shown in figure 1. This network consists of blood donors, mobile collection units, local blood centers, main blood centers and demand points (like hospitals). The main assumptions involved in this problem are:
Fig. 1 The proposed blood supply chain network
Blood donors can donate blood at either a local blood center or a mobile one within a certain geographical distance, but not at the main blood centers
The mobile collection units are already purchased (the number of them is known) and their location could be changed over from one period to another. They transform the collected blood to main blood centers.
All transfusion processes can be done at the main blood centers, but the local blood center can’t fulfill a full range of transfusion processes and they may direct some of these processes to a pre-assigned main blood center.
195
Mobile collection units aren’t permitted to visit a location within a certain number of days after the previous visit. According to Sahinyazan et. al )2015(, the number of donations significantly decreases on a second and third day of having the Mobile collection unit visiting the same location The blood products that are shipped from local and main blood centers to the demand points have a
specific expiration date and will be unusable thereafter
Shortage of blood products at the demand points are considered in the model
Local and main blood centers do not operate perfectly all the time in term of dispatching blood products to demand point and they may fail to dispatch blood product to demand point in a period Tl
(for local blood centers) and Tm (for main blood centers). This failing follows an exponential
distribution with a mean of
lt(for local blood centers) and mt (for main blood centers). Accordingly, the reliabilities of local blood center l, (Rl) and main blood center m, (Rm) indispatching blood product to demand point in a period are:
(1)
(
) e
;
(
) e
;
lt lm v l l v m m
R
P T
v
R
P T
v
l L
m M
(2)
Considering the above assumptions, the goal is to reach a compromise between two objective functions so that the total costs of supply chain are minimized and also the average total number of blood products dispatched to demand points be maximized.
3.3. The mathematical model
According to the above-mentioned assumptions, the mathematical model of the problem is a mixed-integer linear programming as follows:
1
' '
min
(
)
(
)
(
)
iypmt iypmt ilt lmt lmt lhtt mhtyjpt yjpt iypt
j y p t i y p t m
lt l t i
mt iypmt
m t i y p l
ypmt lmt
i y p m t l m t
lht mht
l h t t m h t t
NBM
NBM
F
U
X
uc
ulc
NBL
umc
NBM
NLM
cmm
clm NLM
clh NLH
cmh NMH
, , 2(3)
ex (
)
(
t
mhtt lhtt
m t l t
mht
lt lt mt mt ht ht
l t m t h t
ht
h t m t t smh l t t t slh
hcl IL
hcm IM
sc S
NMH
NLH
MaxF
NMH
(4)
e
mte
lt)
t lhtt
m h t t l h t t
NLH
(1) (2) (3) (4)196 1
subject :
, t
(5)
1
yjpt j J p P
jypt yjpt j Y p P j Y p P
X
X
X
to
y Y
T
, t
(6)
,
, t
iyt yjpt
j Y p P O
y Y
T
i I y Y
T
X
(7)
,
1, 2,...,
1
a n yjpt j Y p P t a
y Y a
X
T
n
(8)
,
1, 2,...,
1
1
(9)
T
yjpt j Y p P t T n a
X
y Y a
n
,
,
,
,
(10)
,
,
,
,
.
.
iyt iypmt iypmt yjpt jO
y Y i
I p
P m M t T
y Y i
I p
NBM
M
NBM
M
X
P m M t T
(11)
,
,
.
ilt Gilt
NB
L
M
i
I l
L t
T
(12)
i , t (13)
p
,
iypmt
ilt ity p m l
iypmt p
i y m
P
NBM
NBL
MAXB
NBM
cap
t T
(14)
.
iyt
,
, t
iyO
cd
dy
i
I y Y
T
(15)
.
ilt
,
, t
(16
il
dl G
cd
i
I l
L
T
)
, t
1
(17)
,
, t
.
lmt lmt m lmtl
L
T
l
L m
LM
N
LM
M LM
M
T
(18)
,
, t
lmt ilt
i
NLM
r
NBL
l
L m M
T
1
1
(19)
, t
(1
)
(20)
(
ilt
lhttiyp
lt lt
i h t
mt mt NBM
IL
IL
r
NBL
NLH
IM
IM
l
L
T
, ' , '
h,t h, 1
, t
(21)
,
)
(
)
t
lmt mhttlht t mht t
l t m t
mt
i y p l h t
t ht
l t slh t t m t smh t t
NLM
N
m M
T
h
H
MH
S
S
D
NLH
NMH
(22)
, t
(23)
lt l mt mIL
cap
IM
cap
T
l
L
T
, t
,
(
,
,
,
,
,
24)
,
0
lmtilt ht lhtt mhtt lt mt
iypmt
NLM
S
IL IM
m M
T
NBM
NBL
NLH
NMH
(25)
,
,
,
{0
,1}
yjpt iyt ilt lmt
X O
G
LM
(26)
(5) (8) (9) (10) (7) (6) (14) (13) (12) (11) (22) (21) (19) (24) (23) (16) (18) (20) (15) (17) (25) (26)
197
The first objective function shown in equation (3) aims to minimize the total cost of the blood supply chain network. The first term in the right hand side of equation (3) refers to the cost of moving mobile collection units from a location to another one. The rest of the terms in RHS of equation (3) refer respectively to the operational cost at mobile collection centers, operational cost at local blood centers, operational cost at main blood centers, transportation cost of bloods from mobile collection units to main blood centers, transportation cost of bloods from local blood centers to main blood centers, transportation cost of bloods from local blood centers to demand points, transportation cost of bloods from main blood centers to demand points,inventory holding cost of the bloods in local blood centers, inventory holding cost of the bloods in main blood centers, the shortage cost of demand points and finally the cost of expired bloods. The second objective function in equation (4) maximize the average total number of blood products dispatched from local and main blood centers to demand points. Equation (5) forces that in every period; at most one mobile collection unit can locate at each donation location. Equation (6) ensures that a mobile collection unit can’t move from a donation location where no collection unit has been located.Equation (7) state that donor groups can’t be assigned to vacant locations. Equations (8) and (9) specify that when a donation location is visited, the subsequent visit can’t occur during next n days. Equation (10) eschews transporting blood from mobile collection units that are not assigned to that donor group. Equation (11) ensures the blood cannot be dispatched from the locations that don’t exist any mobile collection unit in them. Equation (12) assures that local blood centers can’t transport donated blood of a donor group when that donor group is not assigned to them. Equation (13) limits the capacity of blood donation of each donor group. Equation (14) guarantee that the total collected blood at each mobile collection unit cannot exceed its capacity. Equation (15) and (16) are for avoiding the assignment of donors to mobile collection units and local blood centers out of service area. Equation (17) enforces assigning no more than one local blood center to each main blood center. Equation (18) states that local blood centers can’t transport blood to not assigned main blood centers. Equation (19) is related to the rate of processes that local blood centers can’t fulfill and they have to direct them to main blood centers. The constraints in equations (20) and (21) are balance equations for blood inventory at local and main blood centers, respectively.Equation (22) is balance equation for shortages of the hospitals’ demands. Equations (23) and (24) limit the capacity of blood holding at local and main blood centers, respectively. Equation (25) enforces the non-negativity restriction on the decision variables and finally equation (26) represents the binary variables.
4- Solution methods
The proposed model in the previous section is a bi-objective mixed integer linear programming for the blood supply chain problem. The objective functions of the model are in conflict with each other such that a feasible solution cannot optimize both of them simultaneously. One approach for solving multi-objective optimization problems is converting the multi-objective functions into a single-multi-objective and then solving the single-objective problem using some multi-criteria decision making (MCDM) methods (Hwang and Masud 1979). In most of the multi-objective problems, the objective functions are in conflict with each other such that one objective function cannot gain its optimal value without deterioration of at least one of the other objective functions. In this situations, the multi-criteria decision making (MCDM) methods are used to reach a win-win deal between the objective functions. There are various methods to solve multi-objective problems. In this paper, three multi-objective decision making techniques including Elastic Bounded objective method, Modified augmented ε-constraint method, and LP-metric method are employed to solve the proposed bi-objective optimization problem. The next subsections describe the selected solution methods.
4-1- Elastic Bounded Objective Method (BOM)
The Bounded Objective Method is one of the decision making methods to solve the multi-objective problems. In this method, one of the objective functions is optimized considering the other objective functions as the constraint with two-sided bounds. Elastic BOM method is an extended version of the
198
Mounded Objective Method that like the conventional form of BOM, optimizes one of the objective function and considers the other objective functions as the constraint. But its difference is that Elastic BOM involves all of the objective function in the created objective function by using an elastic factor as shown in below (Marler and Arora 2004), (Jabbarzadeh et al. 2017).
1
Maximize {
}
:
g 1,..., p g
f ( )
subject to
,
(27)
p
i g g
g g r
g g g g g g
k
m
k
f
M
k
x
x S k
i
R
Where, µg is a positive parameter that controls the values of variable kg, fg(x) is the value of objective
function g, S is the feasible space of the original problem, and mgand Mgare lower and upper bounds for
value of objective function g, that in this paper, are considered equal to lowest and highest values of the payoff table, respectively.
4-2- Modified augmented ε-constraint method
Recently, Esmaili et al. (2011) proposed the modified augmented ε-constraint that is a novel version of conventional ε-constraints, which was introduced by Haimes et al. (1971). Although ordinary ε-constraint method is considered among the most popular method to generate a set of Pareto solutions for multi-objective optimization problems, but in some cases, it can result in inefficient Pareto solutions that this new version has remedied this problem by considering the slack variables into the objective function constraints and putting them as a second term in the objective function. Also Modified augmented ε-constraint method, considers the relative importance of the objective functions in generating the Pareto solutions. The mathematical form of the modified augmented e-constraint method is as follows:
1
Maximize
{f ( ) ( s / r )}
subject to :
f ( ) s g 1,..., p , ( ,
28)
p g
i i g g
g i g i
g g g
w x r
w
x e g i
x S
sgR
Where S is the feasible space of the original problem, fg(x) is the value of objective function g, sg is
slack variables of gth constrained objective function, rg is range of gth constrained objective function
obtained from the payoff table such that 𝑟𝑔= 𝑓𝑔𝑚𝑎𝑥− 𝑓𝑔𝑚𝑖𝑛, wi is the weight factor of the ith objective
function such that ∑𝑝𝑔=1𝑤𝑔= 1 and 𝑒𝑔 is an upper bound for fg(x) that are obtained using the individual
optimization method.
4-3- LP-metric method
The LP-metric method is one of the popular methods for solving multi-objective problems with inconsistent objective functions. The goal in this method is to find a solution that minimizes digression between the objective functions (𝑓𝑔; 𝑔 = 1,2, … , 𝑝) and their ideal solution (𝑓𝑔∗; 𝑔 = 1,2, … , 𝑝) that are obtained using the individual optimization method. The following mathematical problem is solved by this method.
(27)
199
1/ *
* 1
(29)
g g r r p
g g
f f
Min D
f
In this research, r is chosen 1.
5- Performance evaluation and comparison
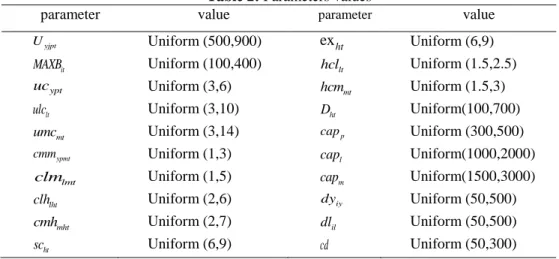
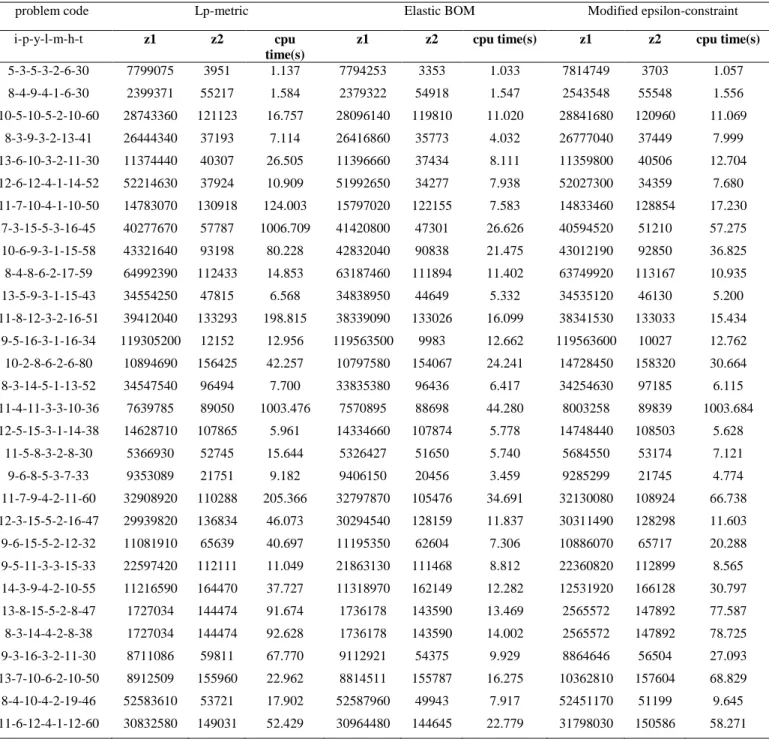
In order to demonstrate the applicability and to assess the performances of the above-mentioned solution methods in terms of the objective functions values and required CPU time, thirty different hypothetical examples are employed in this section. The sizes of the generated problems are given in table 1. These examples are generated randomly and are solved on a laptop with core (TM) i5, 2.40 GHz, RAM 4 Mb using GAMS 24.7.3 software and making use of the CPLEX solver. Consider a blood supply chain problem that aims to optimize the platelet’s chain. The shelf life of the platelets dispatched from local and main blood centers to demand’s points are randomly generated based on a uniform distribution between 4 and 6 days. The referral rate r considered 0.3. Also, the failure rates of the local and main blood centers to dispatch blood products to demand points are randomly generated based on a uniform distribution between 0.02 and 0.05. The other main parameters of the mathematical model are randomly generated using uniform distributions presented in table 2. Furthermore, the initial data required in the solution methods are w1=0.4, w2=0.6, and 𝜇 = 10. The results of the local optimum feasible solutions (Z1 & Z2)
and their CPU times for thirty different examples obtained by GAMS are summarized in table 3. The results present the Pareto optimal solutions that consider all of the objective functions and try to satisfy all of the objectives of decision makers. If the decision makers want to simultaneously reach to all of the objectives in their optimal values, it is impossible. Because the objective functions are in conflict with each other and an optimal value of an objective function cannot be reached without deteriorating another objective function. Thus, if the decision makers want to reach to the entire objective functions in their near to optimal values, the results of the solution methods can help them. Otherwise, they cannot gain a logical result to reach their objectives.
200
Table1. Generated problems
problem code i p y l m h t
5-3-5-3-2-6-30 5 3 5 3 2 6 30
8-4-9-4-1-6-30 8 4 9 4 1 6 30
10-5-10-5-2-10-60 10 5 10 5 2 0 60
8-3-9-3-2-13-41 8 3 9 3 3 13 41
13-6-10-3-2-11-30 13 6 10 3 2 11 30
12-6-12-4-1-14-52 12 6 12 4 1 14 52
11-7-10-4-1-10-50 11 7 10 4 1 10 50
7-3-15-5-3-16-45 7 3 15 5 3 16 45
10-6-9-3-1-15-58 10 6 9 3 1 15 58
8-4-8-6-2-17-59 8 4 8 6 2 17 59
13-5-9-3-1-15-43 13 5 9 3 1 15 43
11-8-12-3-2-16-51 11 8 12 3 2 16 51
9-5-16-3-1-16-34 9 5 16 3 1 16 34
10-2-8-6-2-6-80 10 2 8 6 2 6 80
8-3-14-5-1-13-52 8 3 14 5 1 13 52
11-4-11-3-3-10-36 11 4 11 3 3 10 36
12-5-15-3-1-14-38 12 5 15 3 1 14 38
11-5-8-3-2-8-30 11 5 8 3 2 8 30
9-6-8-5-3-7-33 9 6 8 5 3 7 33
11-7-9-4-2-11-60 11 7 9 4 2 11 60
12-3-15-5-2-16-47 12 3 15 5 2 16 47
9-6-15-5-2-12-32 9 6 15 5 2 12 32
9-5-11-3-3-15-33 9 5 11 3 3 15 33
14-3-9-4-2-10-55 14 3 9 4 2 10 55
13-8-15-5-2-8-47 13 8 15 5 2 8 47
8-3-14-4-2-8-38 8 3 14 4 2 8 38
9-3-16-3-2-11-30 9 3 16 3 2 11 30
13-7-10-6-2-10-50 13 7 10 6 2 10 50
8-4-10-4-2-19-46 8 4 10 4 2 19 46
201
Table 2: Parameters values
parameter value parameter value
yjpt
U Uniform (500,900) exht Uniform (6,9)
it
MAXB Uniform (100,400) hcllt Uniform (1.5,2.5) ypt
uc Uniform (3,6) hcmmt Uniform (1.5,3)
lt
ulc Uniform (3,10) Dht Uniform(100,700)
mt
umc Uniform (3,14) capp Uniform (300,500)
ypmt
cmm Uniform (1,3) capl Uniform(1000,2000)
lmt
clm Uniform (1,5) capm Uniform(1500,3000)
lht
clh Uniform (2,6) dyiy Uniform (50,500)
mht
cmh Uniform (2,7) dlil Uniform (50,500)
ht
202
5-1- Comparison
In this section, the Tukey method is employed to analyze and compare the results of the solution methods with each other. This method is a useful test when there are more than two means being compared. It compares the difference between each pair of means with appropriate adjustment for multiple testing (Montgomery, 2009). By considering 0.05 Significance level (α), the null hypothesis H0
declare that the means of the objective functions values and required CPU time in all three proposed solution methods are the same and alternative hypothesis H1 state that at least one mean is different. The
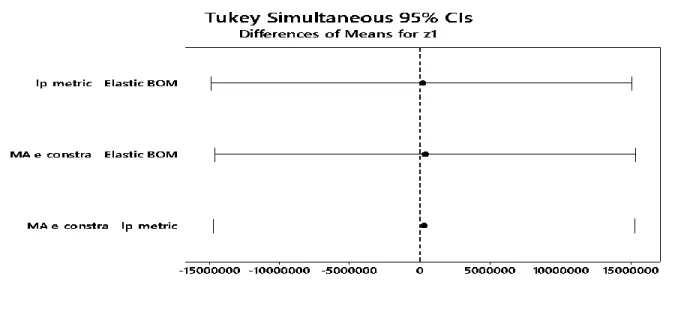
result of performing the Tukey test using MINITAB17.3.1 software are shown in ANOVA tables 4-6 and figures 2-4 .According to this results:
i-p-y-l-m-h-t z1 z2 cpu
time(s)
z1 z2 cpu time(s) z1 z2 cpu time(s)
5-3-5-3-2-6-30 7799075 3951 1.137 7794253 3353 1.033 7814749 3703 1.057 8-4-9-4-1-6-30 2399371 55217 1.584 2379322 54918 1.547 2543548 55548 1.556 10-5-10-5-2-10-60 28743360 121123 16.757 28096140 119810 11.020 28841680 120960 11.069
8-3-9-3-2-13-41 26444340 37193 7.114 26416860 35773 4.032 26777040 37449 7.999 13-6-10-3-2-11-30 11374440 40307 26.505 11396660 37434 8.111 11359800 40506 12.704 12-6-12-4-1-14-52 52214630 37924 10.909 51992650 34277 7.938 52027300 34359 7.680 11-7-10-4-1-10-50 14783070 130918 124.003 15797020 122155 7.583 14833460 128854 17.230
7-3-15-5-3-16-45 40277670 57787 1006.709 41420800 47301 26.626 40594520 51210 57.275 10-6-9-3-1-15-58 43321640 93198 80.228 42832040 90838 21.475 43012190 92850 36.825 8-4-8-6-2-17-59 64992390 112433 14.853 63187460 111894 11.402 63749920 113167 10.935 13-5-9-3-1-15-43 34554250 47815 6.568 34838950 44649 5.332 34535120 46130 5.200 11-8-12-3-2-16-51 39412040 133293 198.815 38339090 133026 16.099 38341530 133033 15.434
9-5-16-3-1-16-34 119305200 12152 12.956 119563500 9983 12.662 119563600 10027 12.762 10-2-8-6-2-6-80 10894690 156425 42.257 10797580 154067 24.241 14728450 158320 30.664 8-3-14-5-1-13-52 34547540 96494 7.700 33835380 96436 6.417 34254630 97185 6.115 11-4-11-3-3-10-36 7639785 89050 1003.476 7570895 88698 44.280 8003258 89839 1003.684 12-5-15-3-1-14-38 14628710 107865 5.961 14334660 107874 5.778 14748440 108503 5.628
11-5-8-3-2-8-30 5366930 52745 15.644 5326427 51650 5.740 5684550 53174 7.121 9-6-8-5-3-7-33 9353089 21751 9.182 9406150 20456 3.459 9285299 21745 4.774 11-7-9-4-2-11-60 32908920 110288 205.366 32797870 105476 34.691 32130080 108924 66.738 12-3-15-5-2-16-47 29939820 136834 46.073 30294540 128159 11.837 30311490 128298 11.603 9-6-15-5-2-12-32 11081910 65639 40.697 11195350 62604 7.306 10886070 65717 20.288 9-5-11-3-3-15-33 22597420 112111 11.049 21863130 111468 8.812 22360820 112899 8.565 14-3-9-4-2-10-55 11216590 164470 37.727 11318970 162149 12.282 12531920 166128 30.797 13-8-15-5-2-8-47 1727034 144474 91.674 1736178 143590 13.469 2565572 147892 77.587 8-3-14-4-2-8-38 1727034 144474 92.628 1736178 143590 14.002 2565572 147892 78.725 9-3-16-3-2-11-30 8711086 59811 67.770 9112921 54375 9.929 8864646 56504 27.093 13-7-10-6-2-10-50 8912509 155960 22.962 8814511 155787 16.275 10362810 157604 68.829 8-4-10-4-2-19-46 52583610 53721 17.902 52587960 49943 7.917 52451170 51199 9.645 11-6-12-4-1-12-60 30832580 149031 52.429 30964480 144645 22.779 31798030 150586 58.271
problem code Lp-metric Elastic BOM Modified epsilon-constraint
203
As shown in ANOVA tables (4) and (5), given that the amounts of P-values for both objective functions are more than the significance level (0.999 > 0.05 for first objective function, and 0.976 > 0.05 for second objective function), the null hypothesis for both objective functions values are accepted, and there is not any significant difference between the result of the three proposed method in terms of objective functions values.
The null hypothesis for required CPU time is rejected. According to ANOVA table (6), the amount of P-value in this comparison is 0.045 that is less than the significance level (0.05).
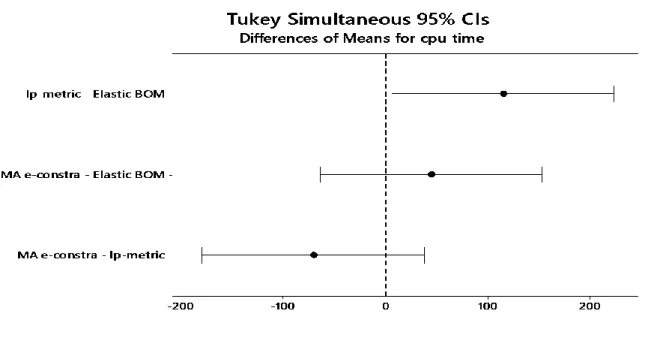
The Tukey simultaneously control limits graph, is a graph that shows control limits of the difference of means for all pairs in multiple comparisons and if an interval does not contain zero, it means that the corresponding means are significantly different. Figures 2 and 3 are the Tukey simultaneously control limits graphs for the values of first and second objective functions, respectively. Considering these graphs, there is not any significant difference between the results of the three proposed method in terms of objective functions values for all pairwise comparisons. But figure 4 shows that the means of LP-metric and Elastic BOM methods are significantly different in term of required CPU time value and it causes the rejection of null hypothesis for required CPU time.
Table 4: ANOVA results for first objective value
SOURCE DF SS MS P-VALUE TREATMENT 2 1.71632E+12 8.58160E+11 0.999 ERROR 87 5.16418E+16 5.93584E+14
TOTAL 89 5.16435E+16
Table 5: ANOVA results for second objective value
Table 6: ANOVA results for required CPU time
SOURCE DF SS MS P-VALUE TREATMENT 2 200433 100217 0.045 ERROR 87 2703854 31079
TOTAL 89 2904287
SOURCE DF SS MS P-VALUE TREATMENT 2 115246272 57623136 0.976 ERROR 87 2.02275E+11 2324997591
204
Fig. 2 Tukey’s simultaneous 95 percent intervals for first objective function value comparison
205
Fig. 4 Tukey’s simultaneous 95 percent intervals for CPU time comparison
5-2- The Best solution method
The ELECTRE method is used in order to rank and choose the best solution method among the three proposed MODM methods. The acronym ELECTRE stands for “ELimination Et Choix Traduisant laREalité” and is the most widely used outranking methods for multiple criteria decision analysis (Greco et al. 2011). This methodis based on the outranking relations. The construction of an outranking relation is based on the concordance and the discordance concepts. The concordance concept consists of the verification of the existence of a criteria’s concordance in favor of the assertion that an alternative is as good as another one. The discordance concept consists of the verification of the inexistence of a strong discordance among the score values that may reject the previous assertion (Vahdani and Hadipour, 2011). Considering the result of the numerical examples of section 4.1, Elastic BOM method selected as the best solution method among the three proposed methods by performing ELECTRE. Also there is not any preference between LP-metric and Modified augmented ε-constraint methods based on the results of ELECTRE.
6- Sensitivity analysis
In this section, sensitivity analysis is performed to determine the effects of the changes in some main parameters of the model on the objective functions values. For this purpose, main parameters of the model are selected. Given that the Elastic BOM method is the best method based on the result of the previous section; this method is used to perform the sensitivity analysis. The results are presented in figures 5-9.
6-1- Change in objective functions values by the changes in parameters
MAXB
i,cd, cap
p,r
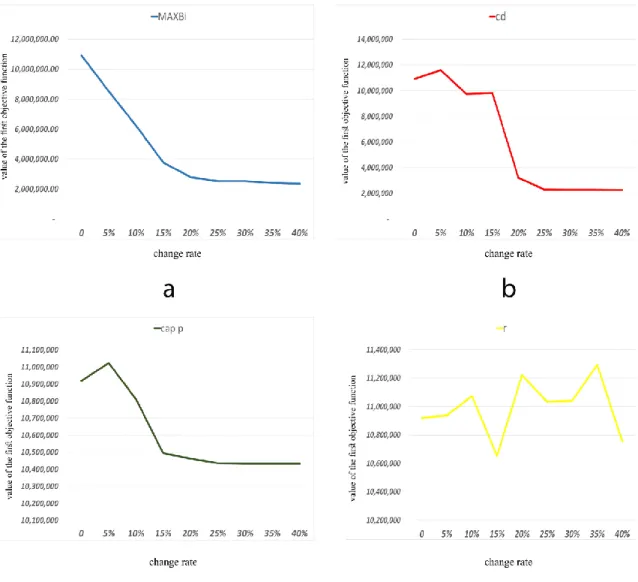
The result of increases (at +5% to +40% rates) in these parameters on the objective functions values are shown in figures 5 and 6. The results indicate that:206
207
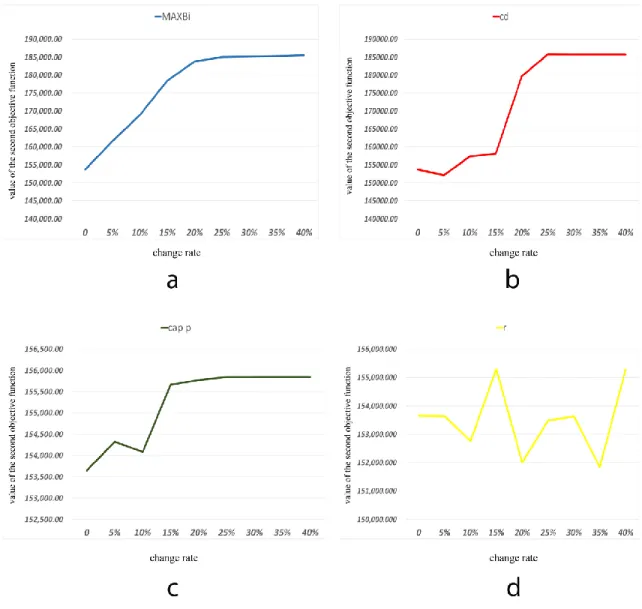
Fig. 6 Change in second objective function value by the changes in parameters MAXBi, cd, capp, r
a. The increase in the value of parameter MAXBi at all of the rates, results in the decrease in the first
objective function value and increase in the second objective function value
b. The increase in the value of parameter cd at +5% rate, results in the increase in the first objective function value and decrease in the second objective function value. but for the other rates, it results in the decrease in the first objective function value and increase in the second objective function value
c. The increase in the value of parameter capp at +5% rate, results in the increase in the first objective
function value. But for the other rates, it results in the decrease in the first objective function value. Also increase in the value of this parameter at all of the rates, results in the increase in the second objective function value
d. The increase in the value of parameter r at +15% and +40% rates, results in the decrease in the first objective function value and increase in the second objective function value. But for the other rates,
208
it results in the increase in the first objective function value and decrease in the second objective function value.
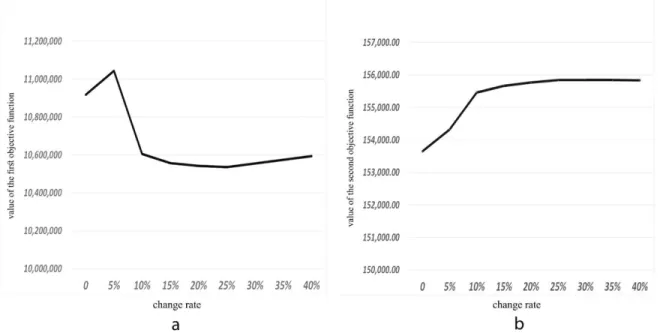
6-2- Change in objective functions values by simultaneous changes in parameters
In the following, the effect of the simultaneous changes in parameters r and capp on the objective
functions values are analyzed. The results of simultaneous increases (at +5% to +40% rates) are presented in figure 7. Based on these results, the simultaneous increase in the values of parameters r and
capp at +5% rate, results in the increase in the first objective function value. But for the other rates, it
results in the decrease in the first objective function value. Also, the simultaneous increase in the value of these parameters at all of the rates results in the increase in the second objective function value.
Fig. 7 Change in objective functions values by simultaneous changes in parameters r and capp
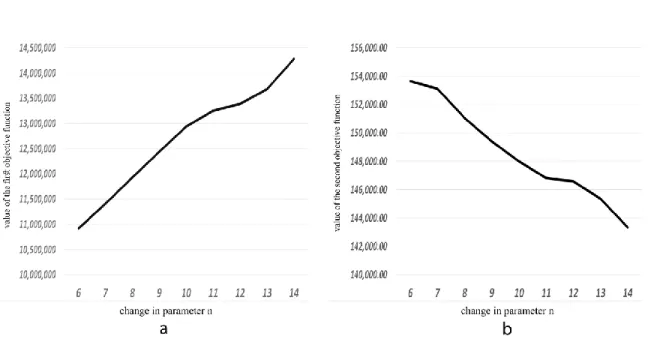
6-3- Change in objective functions values by the changes in parameter
n
In order to analyze the effect of the number of days in between visits on the objective function values, different values of the n are employed. The results of figure 8 show that the increase in the number of days in between visits, results in the increase in the first objective function value and decrease in the second objective function value.
209
Fig. 8 Change in objective functions values by the changes in parameter n
6-4- Change in objective functions values by the changes in the parameter of Elastic BOM
A sensitivity analysis is performed to examine the effect of the different values of parameter µ on the objective function values. As presented in figure 9, the increase in the value of parameter µ results in the increase in the first objective function value except at µ=30 rate that the best value of the first objective function is obtained at that rate. Also increase in the value of parameter µ, results in the decrease in the second objective function value and the best value of it is obtained at µ=10 rate.210
7- Conclusion
In this paper, a novel mathematical formulation for a blood supply chain network consisting of blood donors, mobile collection units, local blood centers, main blood centers and demand points was proposed in which the local and main blood centers were subject to random failure in dispatching blood products to demand points. The problem was first formulated into a mixed-integer linear model with two conflicting objectives including minimization of the total chain costs and maximization of the reliability of the local and main blood centers. Then, three MODM methods including LP- metric, Elastic BOM and modified augmented ε-constraint methods were developed to solve the mathematical model of the problem. In order to evaluate the efficacy of the solution methods in terms of the objective functions values and required CPU time, thirty different hypothetical examples were employed. The results of the solution methods were compared with each other using Tukey’s multiple comparison tests. This comparison illustrated a significant difference between the results of the three proposed methods in terms of CPU time. Also, ELECTRE method was employed to rank and choose the best solution method among the three proposed MODM methods. The results demonstrated the better performance of the Elastic BOM method in terms of the objective functions values and required CPU time. Some sensitivity analysis was performed at the end to distinguish the effects of the changes in the main parameters of the model on the objective functions values.
As guidance for future research, one can consider uncertainty in some main parameters of the model like uncertainty in demand for blood products or uncertainty in the donation of blood. Also, other probability distributions can be developed to model the reliability of blood centers, instead of the exponential distribution. The proposed exact methods aren’t capable of solving large scale problems in a reasonable time. Hence, developing meta-heuristic algorithms to solve the model would be worthwhile.
References
Abdulwahab U, Wahab MIM (2014) Approximate dynamic programming modeling for a typical blood platelet bank. Computers & Industrial Engineering 78: 259–270. doi: 10.1016/j.cie.2014.07.017
Alfonso E, Xie X, Augusto V, Garraud O (2012) Modeling and simulation of blood collection systems. Health Care Management Science 15:63–78. doi:10.1007/s10729-011-9181-8
Blackburn J, Scudder G (2009) Supply Chain Strategies for Perishable Products: The Case of Fresh Produce. Production and Operations Management 18:129–137. doi: 10.1111/j.1937-5956.2009.01016.x
Blake JT (2009) On the use of operational research for managing platelet inventory and ordering. Transfusion 49:396–401. doi:10.1111/j.1537-2995.2008.02061.x
Bosnes V, Aldrin M, Heier HE (2005) Predicting blood donor arrival. Transfusion 45:162–170. doi: 10.1111/j.1537-2995.2004.04167.x
Cumming PD, Kendall KE, Pegels CC, Seagle JP, Shubsda JF (1976) A collections planning model for regional blood suppliers: description and validation. Management Science 22:962–971. doi: 10.1287/mnsc.22.9.962
Chaiwuttisak P, Smith H, Wu Y, Potts C, Sakuldamrongpanich T, Pathomsiric S (2016) Location of low-cost blood collection and distribution centres in Thailand. Operations Research for Health Care 9:7–15. doi: 10.1016/j.orhc.2016.02.001
211
Cohen MA, Nahmias S, Pierskalla WP (1976) A feedback inventory model of a hospital blood bank. Proceedings of the Seventh Annual Pittsburgh Conference, University of Pittsburgh 7:612–616.
Elston RC, Pickrel JC (1963) A statistical approach to ordering and usage policies fora hospital blood bank. Transfusion 3:41-47. doi:10.1111/j.1537-2995.1963.tb04602.x
Esmaili M, Amjady N, Shayanfar HA (2011) Multi-objective congestion management by modified augmented e-constraint method. Applied Energy 88: 755–766. doi:10.1016/j.apenergy.2010.09.014
Fahimnia B, Jabbarzadeh A, Ghavamifar A, Bell M (2015) Supply Chain Design for Efficient and Effective Blood Supply in Disasters. International Journal of Production Economics Accepted: 11 November 2015 doi: 10.1016/j.ijpe.2015.11.007
Gunpinar S, Centeno G (2015) Stochastic integer programming models for reducing wastages and shortages of blood products at hospitals. Computers & Operations Research 54:129–141. doi: 10.1016/j.cor.2014.08.017
Gunpinar S, Centeno G (2016) An integer programming approach to the bloodmobile routing problem. Transportation Research Part E 86 94–115. doi: 10.1016/j.tre.2015.12.005
Gregor PJ, Forthofer RN, Kapadia AS (1982) An evaluation of inventory and transportation policies of a regional blood distribution system. European Journal of Operational Research 10:106–113. doi: 10.1016/0377-2217(82)90138-2
Greco S, Kadziński M, Mousseau V, Słowiński R (2011) ELECTREGKMS: robust ordinal regression for outranking methods. European Journal of Operational Research 214:118–135. doi:10.1016/j.ejor.2011.03.045
Hemmelmayr V, Doerner KF, Hartl RF, Savelsbergh MWP (2009) Delivery strategies for blood products supplies. OR Spectrum 31:707–725. doi: 10.1007/s00291-008-0134-7
Hwang CL, MasudmASM (1979) Multiple objective decision making, methods and applications: A state-of-the-art survey. Berlin: Springer-Verlag. doi:10.1007/978-3-642-45511-7
Haimes YY, Lasdon, LS, Wismer DA (1971) On a bicriterion formulation of the problems of integrated system identification and system optimization. IEEE Transactions on Systems, Man, and Cybernetics 1: 296–297. doi:10.1109/TSMC.1971.4308298
Jabbarzadeh A, Fahimnia B, Seuring S (2014) Dynamic supply chain network design for the supply of blood in disasters: A robust model with real world application. Transportation Research Part E 70: 225– 244. doi: 10.1016/j.tre.2014.06.003
Jabbarzadeh A, Fahimnia B, Sheu JB (2017) An Enhanced Robustness approach for managing supply and demand uncertainties. Int. J. Production Economics 183: 620–631. doi: 10.1016/j.ijpe.2015.06.009.
Kamp C, Heiden M, Henseler O, Seitz R (2010) Management of blood supplies during an influenza pandemic. Transfusion 50:231–239. doi: 10.1111/j.1537-2995.2009.02498.x
Kaspi H, Perry D (1983) Inventory systems of perishable commodities. Advances in Applied Probability 15:674–685. doi:10.1017/S0001867800021467
212
Kopach R, Balcioglu B, Carter M (2008). Tutorial on constructing a red blood cell inventory management system with two demand rates. European Journal of Operational Research 185:1051–1059. doi:10.1016/j.ejor.2006.01.051
Lowalekar H, Ravichandran N (2015). A combined age-and-stock-based policy for ordering blood units in hospital blood banks. Intl. Trans. in Op. Res 00:1–26. DOI: 10.1111/itor.12189
Michaels JD, Brennan JE, Golden BL, Fu MC (1993) A simulation study of donor scheduling systems for the American Red Cross. Computers and Operations Research 20:199–213. doi:10.1016/0305-0548(93)90075-T
Montgomery DC (2009) Design and Analysis of Experiments. 7th Ed., John Wiley & Sons Incorporation, New York, USA.
Marler RT, Arora JS (2004) Survey of multi-objective optimization methods for engineering. Struct Multidisc Optim 26:369–395. doi : 10.1007/s00158-003-0368-6
Nagurney A, Masoumi AH, Yu M (2012) Supply chain network operations management of a blood banking system with cost and risk minimization. Computational Management Science 9: 205-231. doi:10.1007/s10287-011-0133-z
Niakan F, Rahimi M (2015) A multi-objective healthcare inventory routing problem; a fuzzy possibilistic approach. Transportation Research Part E 80:74-94. doi: 10.1016/j.tre.2015.04.010
Osorio AF, Brailsford SC, Smith HK, Forero-Matiz SP, Camacho-Rodríguez BA (2016) Simulation-optimization model for production planning in the blood supply chain. Health Care Management Science Accepted: 24 May 2016. doi:10.1007/s10729-016-9370-6
Osorio AF, Brailsford SC, Smith HK (2015) A structured review of quantitative models in the blood supply chain: a taxonomic framework for decision-making. International Journal of Production Research 53: 7191-7212. doi: 10.1080/00207543.2015.1005766.
Pereira A (2006) Economies of scale in blood banking: a study based on data envelopment analysis. Vox Sanguinis 90:308–315. doi: 10.1111/j.1423-0410.2006.00757.x
Pegels CC, Jelmert AE (1970) An evaluation of blood inventory policies: a markov chain application. Operations Research 18:1087–1098. doi:10.1287/opre.18.6.1087
Sarker BR, Jamal AMM, Wang S (2000) Supply chain models for perishable products under inflation and permissible delay in payment. Computers & Operations Research 27:59-75. doi: 10.1016/S0305-0548(99)00008-8
Sahin G, Süral H, Meral S (2007) Locational analysis for regionalization of Turkish Red Crescent blood services. Computers and Operations Research 34:692–704. doi: 10.1016/j.cor.2005.03.020
Sahinyazan FG, Kara BY, Taner MR (2015) Selective vehicle routing for a mobile blood donation system. European Journal of Operational Research 245:22–34. doi:10.1016/j.ejor.2015.03.007
Vahdani B, Hadipour H (2011) Extension of the ELECTRE method based on interval-valued fuzzy sets. Soft Computing 15:569–579. doi:10.1007/s00500-010-0563-5
213
Zahiri B, Torabi SA, Mousazadeh M, Mansouri SA (2015) Blood collection management: Methodology and application. Applied Mathematical Modelling 39:7680–7696. doi:10.1016/j.apm.2015.04.028
Zahiri B, Pishvaee MS (2017) Blood supply chain network design considering blood group compatibility under uncertainty. International Journal of Production Research 55: 2013-2033. doi: 10.1080/00207543.2016.1262563