THE APPLICATION OF INNOVATIVE PARKING SOLUTIONS IN
DOWNTOWN CHAPEL HILL
by
Brian Patrick Grover
A Master’s Project submitted to the faculty of the University of North Carolina at Chapel Hill
in partial fulfillment of the requirements for the degree of Master of Regional Planning in the Department of City and Regional Planning.
Chapel Hill
2007
Approved by:
________________________
TABLE OF CONTENTS
List of Figures.……….3
List of Tables.………..3
Executive Summary.……….……...4
I. Introduction.………..………..5
II. Literature Review.……….10
III. Data Collection.………18
IV. Methodology.………20
V. Analysis Results………24
VI. Limitations and Future Research.………..……...32
VII. Conclusion.………...34
Appendix A………..…..36
Appendix B………..………..38
Appendix C………..…………..39
Appendix D………..…………..40
Appendix E………..…………..41
Appendix F……….………..……..42
LIST OF FIGURES
Figure 1. Franklin Street, Downtown Chapel Hill………...………6
Figure 2. Weekday On-Street Parking Pricing in Redwood City ……….…………15
Figure 3. Downtown Parking Facilities by Lot ID………..………...…...…18
Figure 4. Downtown Parking Facilities by Use………..………...……19
Figure 5. Occupancy Rates………..………...…...……25
Figure 6. Empty Parking Spaces………..………...……...……25
Figure 7. Change in Price as a Result of Performance-Based Pricing………..……….…26
Figure 8. Buffer Analysis – Shared Parking………..………...…….…29
Figure 9. Lot Uses – Shared Parking………..………..…….…30
Figure 10. Empty Spaces – Shared Parking………..…….…30
LIST OF TABLES
Table 1. Background Parking Studies.………...…………..8Table 2. Peak Parking Demands for Various Uses……….…………...12
Table 3. Acceptable Walking Distances……….………...12
Table 4. Parking Elasticities………...……...……14
Table 5. Typical Parking Facility Costs……….…16
Table 6. Priced Parking Facilities………...21
EXECUTIVE SUMMARY
I.
INTRODUCTION
BACKGROUND
Parking is an integral component of any automobile-oriented transportation system. Every vehicle trip requires some form of parking at its destination, and parking that is difficult to find, inadequate, inconvenient, or expensive will not only lead to frustration but can also discourage travel to those locations. As such, many destinations prefer to offer more parking than necessary to ensure that they will be conveniently accessible. Unfortunately, the quality of a particular location is often inversely proportional to its parking supply. Put more simply, automobiles require quantity while pedestrians require quality, and meeting both of these needs can be quite challenging. Dan Burden, a renowned expert on livable communities, has argued this point for several decades, and many would agree that expansive seas of parking are not exactly reminiscent of great places. It is thus imperative that planners and policymakers balance the needs of an automobile-oriented society while maintaining a sense of place.
While expansive parking lots are often the backbone of conventional suburban developments,
downtown areas tend to offer less parking. This is partly because there is a decreased demand. The
density and mix of uses inherent in downtown development encourages alternative modes of
transportation (walking, bicycling, and transit), reducing the need for automobile infrastructure. In
addition, downtown areas offer less parking because their appeal is contingent upon the quality of the
“downtown experience.” The advantage that downtowns have over fringe development is that they
are walkable, compact, pedestrian-oriented areas. These qualities that enable a downtown to remain
healthy and vibrant would fade away if downtowns adhered to conventional minimum parking
requirements and supplied ample free surface parking. They would become less pedestrian-friendly
and effectively lose their sense of character, the very thing that makes them distinctive.
When downtowns experience growth, however, strategic parking solutions must be sought. In theory,
there are three ways to address parking shortages: 1) increase supply, 2) decrease demand, or 3) use
the existing capacity more efficiently. Increased supply is typically achieved by enforcing minimum
demand requires strategies such as parking pricing and encouraging transit use as an alternative
transportation mode. Lastly, it is possible to increase the efficiency of existing parking infrastructure
by implementing shared parking, parking pricing, and providing transit access to remote parking
sites. In downtown areas, increasing the supply of parking is not always a feasible solution for
reasons already mentioned. Most downtown parking solutions are thus concerned with decreasing
demand and/or using existing parking infrastructure more efficiently.
CONTEXT – CHAPEL HILL
Downtown Chapel Hill was originally founded in 1819 to serve the University of North Carolina. The town was chartered in 1851, and since then intense development has occurred along its main street, Franklin Street (see Figure 1), which is now considered to be the heart of downtown. The Chapel Hill downtown is a major mixed-use center, serving both the adjacent university as well as the surrounding community. The town as a whole has a population of 48,715 (U.S. Census, 2000), and 61.5 percent of working individuals in Chapel Hill commute to work alone in their automobiles (compare to national average of 76 percent). Importantly, 6.5 percent of working individuals commute to work on mass transit (4.7 percent national average) and 15.1 percent walk (2.9 percent national average). With nearly 20 percent of the workforce commuting by means of mass transit or walking, the town is less automobile-dependent than many of its counterparts across the country. This is most evident in downtown Chapel Hill, where the automobile is clearly subservient to pedestrians and public parking is limited.
Recently, growth in downtown Chapel Hill has led to parking shortages, and public accessibility to downtown businesses has been a topic of significant concern. The idea that parking should be customer-focused and used as an economic development tool was made clear by the Town Council, bringing forth the challenge of making parking widely available to downtown customers while at the same time maintaining the pedestrian-oriented environment that allows downtown to thrive. To address the issue, the Town Council established a Downtown Parking Citizens Committee on May 8, 2006, to make recommendations on parking to the Council. The Committee’s objectives were to encourage the efficient use of parking facilities and maintain parking utilization at about 85 percent. Strategies to achieve these goals included increasing enforcement, reducing on-street time limits, and expanding the core area boundaries to increase the numbers of spaces managed for short-term use. Further, the town had identified shared parking as a potentially beneficial parking management strategy, along with parking pricing and the use of alternative modes.
The Downtown Parking Citizens Committee presented their Report to the Town Council on February 26, 2007. The stated purpose of the report is to review the current parking management system, identify issues, and highlight the goals, objectives, and strategies for a downtown parking plan. Further, the report offers a set of recommendations and implementation plans to achieve the guiding principles set for downtown parking. The report (2007) suggests the following management strategies as the first actions to be taken in coordinating a parking plan:
• Inform the public
• Encourage shared parking
• Communicate with private owners, the University, and other communities • Provide equitable enforcement and regulations
• Implement user-friendly technologies
• Maintain appropriate parking rates and return revenues to the downtown community (85 percent occupancy rates)
The committee also stated that following the full execution of the parking management strategies, long-term assessments may be needed to identify the long-range changes in parking supply and demand, as well as the need for additional parking infrastructure.
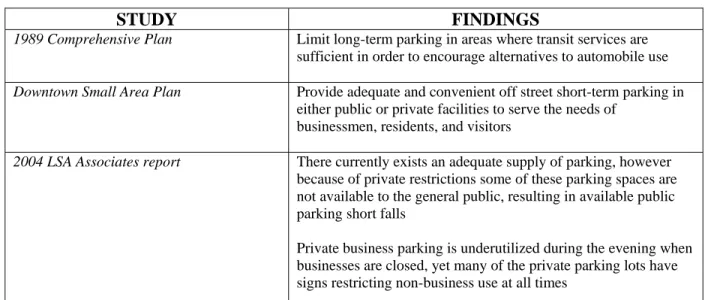
In addition to the report compiled by the Downtown Parking Citizens Committee, several studies have recommended strategies for downtown parking in Chapel Hill. These studies are described in Table 1.
TABLE 1: Background Parking Studies
STUDY FINDINGS
1989 Comprehensive Plan Limit long-term parking in areas where transit services are sufficient in order to encourage alternatives to automobile use
Downtown Small Area Plan Provide adequate and convenient off street short-term parking in either public or private facilities to serve the needs of
businessmen, residents, and visitors
2004 LSA Associates report There currently exists an adequate supply of parking, however because of private restrictions some of these parking spaces are not available to the general public, resulting in available public parking short falls
Private business parking is underutilized during the evening when businesses are closed, yet many of the private parking lots have signs restricting non-business use at all times
Source: LSA Associates (2004)
GOALS AND OBJECTIVES
The purpose of this research paper is to identify a more efficient use of the existing parking facilities in downtown Chapel Hill. Inspired in part by the work of Donald Shoup, it will focus on performance-based pricing as well as shared parking, each as a means of increasing the efficiency of downtown Chapel Hill’s parking facilities. Past studies and preliminary research indicate that performance-based pricing has the potential to ensure parking availability at all times of the day for both on-street and off-street parking, while at the same time utilizing existing facilities more efficiently. Additionally, the area has the potential to benefit considerably from shared parking between relatively diverse uses. The research will build upon the findings of past parking studies in Chapel Hill by making more specific recommendations and detailing an implementation plan.
II. LITERATURE
REVIEW
BACKGROUND
Automobiles are the dominant mode of transport for most individuals, especially in the United States, yet the strains they place on a region’s transportation network reveal tremendous inefficiencies. For example, the typical automobile is parked 23 hours each day and uses several parking spaces each week (Litman, 2006a). Much of this parking, however, is available at no direct charge to the user. Instead, parking costs are transferred to other sectors, and even individuals without cars end up paying for parking indirectly. Donald Shoup, a leading researcher in the field, has often said that the cost of parking does not cease to exist just because the driver doesn’t have to pay for it. These hidden costs result in a total subsidy for off-street parking that, in 2002, was estimated to be between $127 billion and $374 billion (Shoup, 2006). These costs are bundled into the cost of development, and thus increase the price of all goods and services offered at these sites that offer free parking. From housing expenses to the cost of a burger at the local McDonald’s, all of society is paying for parking, whether they use it or not.
Todd Litman, executive director of the Victoria Transport Policy Institute (VTPI), argues that innovative parking solutions can help reconcile the inequities of current parking practice. Parking management refers to “policies and programs that result in more efficient use of parking resources” (Litman, 2006a, p. 2). When appropriately applied, these strategies can significantly reduce the number of required parking spaces for a particular application. For example, shared parking is a management strategy that enables a parking facility to serve multiple destinations. Along with other strategies such as performance-based pricing and reduced parking requirements, more value is squeezed from each parking space and the amount of parking needed to serve an area has the potential to be greatly reduced.
does not eliminate parking shortages because spaces are often only available for certain uses. As such, Litman sees the real problem as being inefficient management rather than inadequate supply.
PARKING MANAGEMENT STRATEGIES
The hypothetical solution – supported by Litman, Shoup, and others – involves creating parking regulations that are more accurate and flexible. Suggested strategies include the following:
• Increase parking facility efficiency by sharing and pricing; use off-site parking facilities; improve user information.
• Reduce parking demand by encouraging use of alternative modes of transportation. • Reduce or even do away with minimum parking requirements.
SHARED PARKING
TABLE 2: Peak Parking Demands for Various Uses
Weekday Peaks Evening Peaks Weekend Peaks Banks Schools Distribution facilities Factories Medical clinics Offices Professional services Auditoriums Bars and dance halls Meeting halls Restaurants Theaters
Religious institutions Parks
Shops and malls
Source: VTPI (2007)
Shared Parking is limited by the proximity of destinations that share a parking facility (VTPI, 2007). Exactly how close they must be depends on the type of land use and the type of user. Table 3 summarizes acceptable walking distances for various types of activities. Acceptable walking distance is also affected by the quality of the pedestrian environment, climate, line of site, and “friction” (barriers along the way, such as crossing busy traffic).
TABLE 3: Acceptable Walking Distances
Adjacent (less than 100 ft)
Short (less than 800 ft)
Medium (less than 1,200 ft)
Long (less than 1,600 ft.)
People with disabilities Deliveries and loading Emergency services Convenience store Grocery stores Professional services Medical clinics Residents General retail Restaurant Employees Entertainment center Religious institution Airport parking
Major sport or cultural event Overflow parking
Source: VTPI (2007)
In general, the potential for shared parking is greatest in areas where land use activities are clustered, and the benefits from sharing parking are greatest due to high parking costs.
PARKING PRICING
Shoup (2005) provides the following guidelines for efficient parking pricing:
• Price the most convenient parking, such as on-street spaces, so occupancy averages about 85 percent.
• Dedicate some or all of the revenue from on-street parking to benefit local businesses and residents.
• Unbundle parking from building rents, so occupants only pay for the number of parking spaces they want.
• Allow private developers and building managers to decide how much parking to provide at each destination, rather than relying on rigid regulations.
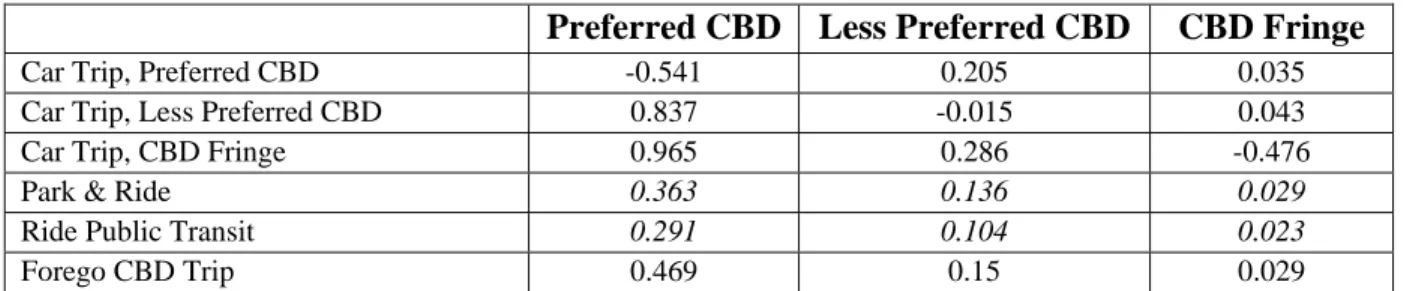
TABLE 4: Parking Elasticities
Preferred CBD Less Preferred CBD CBD Fringe
Car Trip, Preferred CBD -0.541 0.205 0.035
Car Trip, Less Preferred CBD 0.837 -0.015 0.043
Car Trip, CBD Fringe 0.965 0.286 -0.476
Park & Ride 0.363 0.136 0.029
Ride Public Transit 0.291 0.104 0.023
Forego CBD Trip 0.469 0.15 0.029
Source: Hensher and King (2001)
INFLUENCE OF SHOUP’S PARKING POLICY – REDWOOD CITY
Over the past several years, Donald Shoup has become known as the preeminent expert on parking policy in the United States. He now travels between cities, preaching his knowledge and encouraging municipalities to adopt his policies. One of the first to do so was Redwood City, a suburb located in the heart of California’s Silicon Valley. Faced with one million additional visitors every year and only 600 new parking spots, the city had to do something drastic. Downtown was constantly in gridlock, mostly because vehicles were “cruising” looking for parking spots. The solution, proposed by Shoup as well as other economists and city planners, promoted ideas like free-market pricing at meters and letting developers, rather than cities, dictate the supply of off-street parking (Dougherty, 2007). In Redwood City, on-street parking spots that were free in the past became metered, charging patrons as much as 75 cents per hour. Time limits were done away with, allowing patrons to prepay for as long as they like. According to local planners, the move has helped steer more cars to underutilized parking garages away from the main street.
The city’s website says the following of its new parking system:
“Now, prices will be structured so that the most popular spaces are most expensive and the less
popular spaces are cheaper. We will occasionally adjust prices up if an area gets too crowded and
will adjust prices down if an area is too empty. This will prevent people from congesting the best
parking areas. This innovative parking management system is called "market-rate pricing" and it
gives you many benefits, such as available parking spaces when and where you want them, and no
Pricing is structured such that during regular weekday hours, all on-street parking is metered and
prices vary from 25 cents per hour to 75 cents per hour, depending on the convenience of the
parking spot. A graphical depiction of this parking pricing is shown in Figure 2. During nights
and weekends, the least convenient parking spaces (those priced at 25 cents per hour) become
free parking. In addition to available on-street parking, the city maintains 1 parking garage and 4
parking lots. Spaces in these facilities can be leased on a monthly basis, with rates between $30
and $60 depending on the desired degree of access.
FIGURE 2: Weekday On-street Parking Pricing in Redwood City
Source: City of Redwood City (2007)
separately from other City funds and may be used only within or for the benefit of the Downtown Core Meter Zone.
COST OF PARKING INFRASTRUCTURE
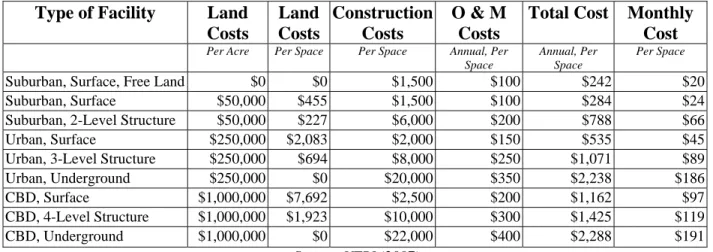
The VTPI (2007) notes that prices can be set to either recover parking facility costs or to maximize revenue. The latter is the approach used for most commercial parking, and it implies setting the highest rates that the market will bear. Rates at other nearby parking facilities set the upper limit that a particular parking facility owner may charge without losing customers. Table 5 indicates typical costs of providing parking facilities. As an example, a surface parking space in a CBD is estimated to cost just over $10,000, while a parking space in a 4-level structure costs just over $12,000.
TABLE 5: Typical Parking Facility Costs
Type of Facility Land Costs
Land Costs
Construction Costs
O & M Costs
Total Cost Monthly Cost
Per Acre Per Space Per Space Annual, Per
Space
Annual, Per Space
Per Space
Suburban, Surface, Free Land $0 $0 $1,500 $100 $242 $20
Suburban, Surface $50,000 $455 $1,500 $100 $284 $24
Suburban, 2-Level Structure $50,000 $227 $6,000 $200 $788 $66
Urban, Surface $250,000 $2,083 $2,000 $150 $535 $45
Urban, 3-Level Structure $250,000 $694 $8,000 $250 $1,071 $89
Urban, Underground $250,000 $0 $20,000 $350 $2,238 $186
CBD, Surface $1,000,000 $7,692 $2,500 $200 $1,162 $97
CBD, 4-Level Structure $1,000,000 $1,923 $10,000 $300 $1,425 $119
CBD, Underground $1,000,000 $0 $22,000 $400 $2,288 $191
Source: VTPI (2007)
DOWNTOWN CONSIDERATIONS
mass of people every day but do so without clogging itself to the point of paralysis, and that one way to do this is to require off-street parking spaces. However, they go on to note the high costs of these parking requirements. It is important to recognize that parking is not an end in itself but is intended to serve the needs of the various users of downtown, including workers, shoppers, tourists, and others.
III. DATA
COLLECTION
A study performed by LSA Associates in 2004 lists the inventory of parking facilities available in downtown Chapel Hill, not accounting for University-owned facilities. Data taken from their parking inventory spreadsheet (see Appendix B) indicates occupancy rates for each of these facilities, in addition to lot type and lot use. The inventory identifies how many of the available parking spaces were occupied during both a weekday afternoon and a Friday evening in October 2003. It recognizes 77 parking facilities within the downtown area, identified in Figure 3 by Lot ID. These Lot IDs can be matched with both the LSA inventory spreadsheet as well as updated spreadsheets, as they are used to identify the various parking facilities in the analysis.
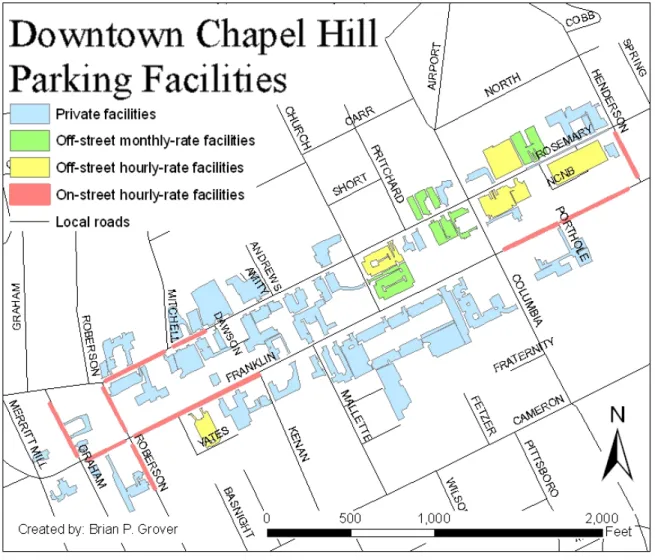
In preparation for this analysis, LSA’s inventory was first updated to include hourly rates and more accurate lot descriptions. This dataset was collected by surveying the 77 facilities on a site-by-site basis. Once the data were obtained and input into the inventory spreadsheet, a shapefile of the parking facilities was created in ArcGIS in order to spatially reference the data. Parking facilities are differentiated as either private, off-street monthly, off-street hourly, or on-street hourly. These data were collected from the LSA inventory, surveying, and the Town of Chapel Hill website (2007). The data were then joined to their respective parking facilities within the shapefile. The shapefile is shown graphically in Figure 4, and the updated parking inventory spreadsheet can be found in Appendix C.
IV.
METHODOLOGY
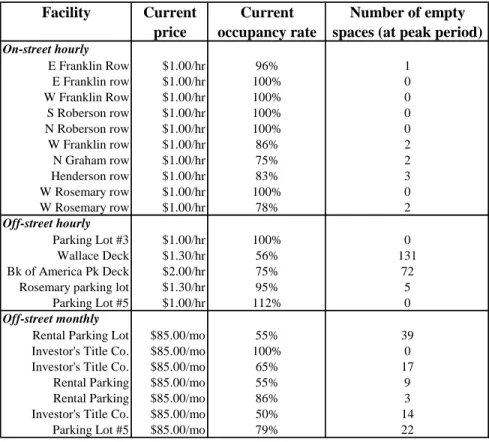
As outlined in the Introduction, this analysis aims to 1) set performance-based prices for existing parking facilities and 2) identify opportunities for shared parking. The pricing program will set prices for all public parking facilities downtown. Of the 77 parking facilities, 55 of them are private (about 71 percent). As such, the performance-based pricing program will only apply to 22 parking facilities (7 off-street monthly, 5 off-street hourly, and 10 on-street hourly facilities). The shared parking program, on the other hand, will analyze the remaining 55 private facilities. Importantly, the shared parking analysis is intended to serve as a basic inquiry, and because a shared parking program’s success is ultimately reliant on the willingness of local property owners to participate the analysis will not construct a detailed solution.
PERFORMANCE-BASED PRICING
TABLE 6: Priced Parking Facilities
Facility Current price
Current occupancy rate
Number of empty spaces (at peak period)
On-street hourly
E Franklin Row $1.00/hr 96% 1
E Franklin row $1.00/hr 100% 0
W Franklin Row $1.00/hr 100% 0
S Roberson row $1.00/hr 100% 0
N Roberson row $1.00/hr 100% 0
W Franklin row $1.00/hr 86% 2
N Graham row $1.00/hr 75% 2
Henderson row $1.00/hr 83% 3
W Rosemary row $1.00/hr 100% 0
W Rosemary row $1.00/hr 78% 2
Off-street hourly
Parking Lot #3 $1.00/hr 100% 0
Wallace Deck $1.30/hr 56% 131
Bk of America Pk Deck $2.00/hr 75% 72
Rosemary parking lot $1.30/hr 95% 5
Parking Lot #5 $1.00/hr 112% 0
Off-street monthly
Rental Parking Lot $85.00/mo 55% 39
Investor's Title Co. $85.00/mo 100% 0
Investor's Title Co. $85.00/mo 65% 17
Rental Parking $85.00/mo 55% 9
Rental Parking $85.00/mo 86% 3
Investor's Title Co. $85.00/mo 50% 14
Parking Lot #5 $85.00/mo 79% 22
As identified in the Literature Review, parking price elasticities can vary quite considerably depending on demographic, geographic, travel choice, and trip characteristics. Because the elasticity is perhaps the single-most important factor in determining parking pricing, choosing the proper value is critical. Hensher and King (2001) is one of the few studies that not only identifies elasticities specifically for downtowns, but goes one step further to differentiate between preferred downtown parking facilities, less preferred downtown parking facilities, and fringe parking facilities.
priced at $1.00 per hour, its new performance-based price will be $1.00 + ($1.00*-0.1848), or $0.82.
This methodology is applied to the 22 parking facilities identified in the study. Drawing from the methods used in Redwood City, rates for on-street parking facilities are adjusted up or down in $0.25 intervals, rounding prices to the nearest interval value. The minimum rate has been set to $0.25 an hour. Off-street hourly parking facilities are priced in the same way. Off-street monthly facilities, which are currently offered at a rate of $85 per month, will be adjusted in $10 intervals, with $25 per month set as a minimum monthly rate. The spreadsheet used to complete this analysis can be found in Appendix D.
Lastly, an economic analysis is performed to assess the costs of implementing the pricing program. Total revenues are calculated for on-street hourly-rate, street hourly-rate, and off-street monthly-rate facilities for both the “current” scenario as well as the “pricing program” scenario. For the hourly facilities, hourly revenues are assumed to be accumulated over an 8-hour period each day, 5 days a week, 50 weeks a year. In this way, yearly revenues are calculated. For monthly facilities, the total monthly revenue is simply multiplied by 12 months to obtain the yearly revenue.
SHARED PARKING
The 55 private parking facilities included in the shared parking analysis are first distinguished as either being above or below the 85 percent occupancy rate threshold. In this way, it is possible to identify preliminary shared parking opportunities; for example, assuming there are two proximate parking facilities, one above the threshold and one below it, these facilities would likely benefit from shared parking since one has excess supply while the other has excess demand.
specifically, the Chapel Hill Land Use Management Ordinance establishes that parking requirements may be satisfied off-site, within 1,200 feet of an entrance to the building. In relation to Table 3, this requirement corresponds to a “Medium” walking distance, acceptable for retail, restaurant, employees, entertainment centers, and religious institutions. As a conservative measure, the analysis will assume that the centroid of an underused parking facility (i.e. below the occupancy threshold) must be within a distance of 200 feet from the centroid of the other, overused facility that will be sharing its spaces. In this way, in the rare case that downtown patrons accessing the aforementioned land uses must walk 1,000 feet from their parking space to a destination, they will now be walking a maximum of 1,200 feet, which is acceptable under the Town’s requirement. Buffers are created in GIS to determine which underused facilities are within 200 feet of an overused facility, and those that are not within this proximity of one another are not included in further analysis.
V.
ANALYSIS RESULTS
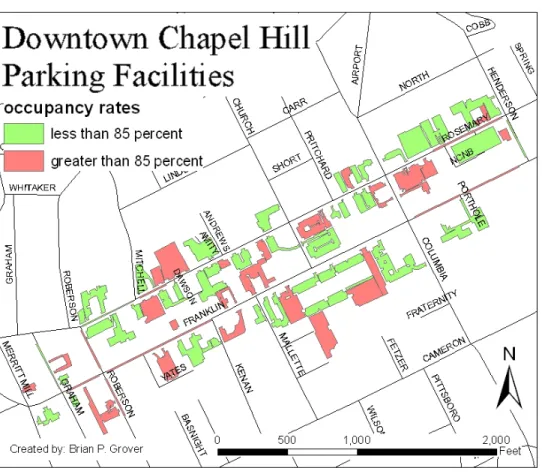
Among all 77 parking facilities in downtown Chapel Hill, there are a total of 3,093 parking spaces. Currently, 2,292 of these spaces are being utilized at peak periods, yielding a peak occupancy rate of 74.1 percent. Looking at each facility individually, Figure 5 identifies which ones fall above or below the 85 percent peak occupancy threshold. In conjunction, Figure 6 identifies the number of empty spaces at each parking facility during the peak period. Relative to Figure 5, the Figure 6 viewpoint is looking southeast toward the University of North Carolina. In terms of scale, the extruded Wallace Deck (upper left corner of Figure 6) represents 131 empty spaces.
FIGURE 5: Occupancy Rates
PERFORMANCE-BASED PRICING RESULTS
The results of performance-based pricing in downtown Chapel Hill are shown in Appendix E. Figure 7 (looking northeast) summarizes these results graphically for the 22 parking facilities.
FIGURE 7: Change in Price as a Result of Performance-Based Pricing
ON-STREET HOURLY-RATE FACILITIES
Before After OFF-STREET HOURLY-RATE FACILITIES
Before After
OFF-STREET MONTHLY-RATE FACILITIES
On-street hourly-rate facilities, most of which are already above the 85 percent occupancy threshold, tend to see increased rates. This is rather intuitive, as these are often the most convenient and visible parking spaces for downtown patrons. Many of the on-street facilities immediately downtown experienced $0.25 price increases, while the less convenient on-street parking on West Rosemary Street and North Graham Street was decreased from $1.00 per hour to $0.75 per hour. Overall, the new pricing scheme for on-street hourly-rate facilities decreases the occupancy rate from 94 percent to 86 percent and is projected to make available 14 additional on-street parking spaces during peak periods.
Off-street hourly-rate facilities do not follow the same trend as their on-street counterparts. As a whole, the current occupancy rate in these facilities is just above 75 percent. While some of these facilities – such as Lot 3, Lot 5, and the Rosemary Parking Lot – are currently overutilized, the Wallace Deck and the Bank of America Parking Deck are highly underutilized. This is possibly because the spots in these facilities are less visible than on-street parking spots or parking spots in exposed lots. Regardless, the underutilization of these two decks leaves a cumulative 203 empty spaces during peak periods. Even more striking is the fact that both of these facilities are located in the heart of downtown Chapel Hill. Under performance-based pricing, the hourly rate at the Wallace Deck will decrease considerably, from $1.30 to $0.25, and the Bank of America Parking Deck will experience a $0.50 hourly decrease from $2.00 to $1.50. The end result is an increase in the occupancy rate (from 75 percent to 85 percent) and the utilization of 83 previously empty parking spaces.
PERFORMANCE-BASED PRICING ECONOMIC ANALYSIS
Based on the findings, performance-based pricing in the context of downtown Chapel Hill results in the utilization of 126 additional parking spaces. The cost of this increased efficiency, however, must not be overlooked. Appendix F contains an economic analysis of the pricing program and its implications for revenue. A summary of the findings is shown in Table 7.
TABLE 7: Economic Analysis Results
Facility Current Yearly Revenue New Yearly Revenue Current Revenue/Space New Revenue/Space
On-street hourly $312,000.00 $325,000.00 $18.80 $19.58
Off-street hourly $1,857,800.00 $1,457,000.00 $22.06 $17.47
Off-street monthly $215,220.00 $156,240.00 $6.83 $4.96
TOTALS $2,385,020.00 $1,938,240.00
YEARLY REVENUE LOSS: $446,780.00
The findings suggest that the previously overutilized facilities (on-street hourly-rate) will generate increased revenue under performance-based pricing, while the previously underutilized facilities (off-street hourly-rate and off-street monthly-rate) will generate decreased revenue compared to current conditions. The program as a whole results in a yearly revenue loss of $446,780.00, which can be applied to the 126 newly-utilized parking spaces to yield a cost of $3,545.87 per space.
While $3,545.87 might sound expensive for a parking space, the Literature Review reveals that parking spaces in downtown areas generally cost upwards of $10,000 per space. If the Town of Chapel Hill is concerned purely with maximizing revenue, it would be best off implementing the on-street performance-based pricing program and leaving off-street facilities as they are. In this case, the program would result in a yearly revenue increase of $13,000, which could be used to help fund local infrastructure improvements.
SHARED PARKING
Figure 8 shows the 34 private parking facilities initially selected as potential shared parking candidates, based on their location within 200 feet of another facility. Just as before, the green facilities are those that are below 85 percent occupancy, while the red facilities are those above 85 percent occupancy. Of these facilities, those used for residential, loading zones, or hotels were taken out of the analysis because these uses can have varying peak parking demands and are thus not conducive to a shared parking program. The remaining 31 facilities are identified in Figure 9 by their land use. Figure 10 indicates the number of empty (or available) spaces in each facility. In terms of scale, the extruded Baptist Church (east of University Square) represents 33 empty spaces.
FIGURE 9: Lot Uses – Shared Parking
The shared parking analysis reveals that there are indeed opportunities for shared parking among private facility users in downtown Chapel Hill. Importantly, as in the case of Wetlands Dance Hall and Bub O’Malley’s, the analysis indicates that even two facilities serving the same use can still be shared if one facility tends to have a much lower occupancy rate than the other. In much the same way, Breadman’s restaurant, while it experiences a similar peak demand to Avalon Dance Club, can share some of its spaces with the club because its peak occupancy is still low. A more conventional application of shared parking opportunities is evidenced by the sharing of the facility at University Baptist Church with University Square. The two parking facilities serving University Square directly adjacent to the church contain a cumulative 101 parking spaces. At peak periods, each of these facilities is 100 percent full. On the other hand, the Baptist Church, which has a total of 100 spaces, is only 67 percent full at peak periods. However, because these two uses have quite different peak parking demands (see Table 2), the percentages can be ignored to a certain extent. In other words, it is quite possible that during a weekday, all 100 spaces (or nearly all) at the church could be used by University Square employees and patrons, since the church experiences peak demands on weekends.
VI. LIMITATIONS
AND
FUTURE RESEARCH
PERFORMANCE-BASED PRICING ANALYSIS
Several important assumptions were made to simplify the analysis. For example, defining a “peak” occupancy was difficult because the LSA data was only collected for an arbitrary weekday afternoon and a Friday evening. It was thus necessary to assume that the peak occupancy was the greater of these two values. This limits the analysis by failing to consider weekend rates; in fact, the entire analysis has been simplified to weekdays and does not consider weekend parking. Further, invariable rates and unlimited parking times were assumed. While these two characteristics are standard in some cities’ parking programs (i.e. Redwood City), they are not consistent with current parking policies in downtown Chapel Hill. For example, on-street parking rates are invariable, however most limit parking to a 2 hour time limit. Off-street parking rates are often free of time restrictions, but daylong rates tend to be discounted over hourly rates.
Another related assumption is that priced parking facilities are priced 24 hours a day, 7 days a week. In reality, most on-street parking becomes free after 6 pm, and some of the off-street facilities have similar policies. Lastly, the parking price elasticity of -0.541 is assumed to accurately depict the travel behavior of downtown patrons and employees in Chapel Hill. This is perhaps the most important assumption that has been made, and future research on this topic would benefit greatly by deriving parking price elasticities specific to Chapel Hill. By assuming this elasticity, it is expected that the demand for these parking spaces already exists. If this were not the case, increasing or decreasing prices will not produce the expected occupancy rates.
A final limitation of this analysis is that rounding hourly and monthly parking rates rather than charging the calculated rate can yield inaccurate results, assuming that the parking price elasticity is accurate. This limitation is assumed to be of minor consequence for the purposes of the analysis, however future research might benefit from assuming the use of technologies such as advanced metering systems, where users can swipe a credit card and thus be charged exact rates.
SHARED PARKING ANALYSIS
This analysis is quite limited, mostly because a strategy of shared parking requires cooperation among local businesses and property owners. Because the willingness of these parties to take part in such a strategy is unknown, a basic exploratory analysis is the most that can be done to assess the increased efficiency that can result from shared parking in downtown Chapel Hill. While the analysis has shown shared parking to be capable of increasing the efficiency of parking downtown, the degree to which this is achieved will ultimately be determined by those who decided to take part in it.
VII. CONCLUSION
The results of this study suggest that both performance-based pricing and shared parking have the potential to increase the efficiency of downtown Chapel Hill’s existing parking facilities. Performance-based pricing results in the utilization of 126 additional parking spaces by pricing facilities to meet market demands. Shared parking serves to further increase the efficiency of downtown facilities as a whole by allowing nearby uses to combine their parking needs.
The economic analysis of the pricing program indicates that increased efficiency is not achieved without incurring costs. It shows that facilities with high occupancy rates (greater than 85 percent), such as on-street parking, will tend to be generate increased revenue streams as compared to current conditions, while facilities with low occupancy rates (less than 85 percent) will generate decreased revenue. This might seem rather intuitive, but it is highly dependent on the price elasticity of demand. For example, the hourly price to park in the Bank of America Deck is currently $2.00, and this yields a total of 213 occupied spaces at peak periods. This particular analysis has found that decreasing the hourly price to $1.50 an hour will result in 242 occupied spaces (85 percent occupancy rate), however that particular facility is losing more than $60.00 per hour as a result. Had a different elasticity been used and the rate been dropped from $2.00 per hour to only $1.75 per hour with the same change in occupancy, the program would be making almost exactly what it was making before ($426.00 per hour), with the added bonus of increasing occupancy to the desired rate.
and making a net profit. Many cities have done just this, increasing on-street parking prices and leaving all other facilities as they are, regardless of occupancy. Ultimately, the Town is responsible for making the final decision regarding implementation.
The shared parking analysis was limited by the fact that decisions regarding facility sharing are ultimately made by businesses and property owners. Nonetheless, it serves as a preliminary study for downtown Chapel Hill and identifies potential opportunities for joint use. Interestingly, the Town’s Land Use Management Ordinance does not identify any minimum parking requirements for places of worship, and yet this land use tends to have the most inefficient parking facilities. Churches, especially the University Baptist Church at the corner of Franklin Street and Columbia Street, are prime targets for shared parking because their parking facilities are used so infrequently. With its central location in downtown Chapel Hill, downtown parking would benefit considerably by utilizing this church’s facilities during off-peak hours.
APPENDIX B: LSA Downtown Parking Inventory
Weekday Afternoon Friday Night
Lot ID Street Lot Type Lot Use Neighborhood
Total Spaces
Occupied
Spaces % Full
Occupied
Spaces % Full
Occupied
Spaces % Full
1 Franklin On-street Parking On-street Parking Established 28 26 92.9% 27 96.4% 27 96.4%
2 Franklin On-street Parking On-street Parking Established 11 11 100.0% 11 100.0% 11 100.0%
3 Franklin Surface Parking Lot Public Parking Established 34 14 41.2% 20 58.8% 20 58.8%
4 Franklin Surface Parking Lot Private Parking Emerging 100 67 67.0% 67 67.0% 67 67.0%
5 Franklin Surface Parking Lot Private Parking Emerging 27 28 103.7% 8 29.6% 28 103.7%
6 Franklin Surface Parking Lot Private Parking Emerging 7 5 71.4% - 5 71.4%
7 Franklin Surface Parking Lot Private Parking Emerging 74 74 100.0% 9 12.2% 74 100.0%
8 Franklin Surface Parking Lot Private Parking Emerging 31 16 51.6% 19 61.3% 19 61.3%
9 Franklin Surface Parking Lot Private Parking Emerging 16 13 81.3% 10 62.5% 13 81.3%
10 Franklin Surface Parking Lot Private Parking Emerging 95 95 100.0% 77 81.1% 95 100.0%
11 Franklin Surface Parking Lot Private Parking Emerging 89 78 87.6% 10 11.2% 78 87.6%
12 Franklin Surface Parking Lot Private Parking Emerging 21 16 76.2% 15 71.4% 16 76.2%
13 Franklin Surface Parking Lot Private Parking Emerging 43 12 27.9% 33 76.7% 33 76.7%
14 Franklin Surface Parking Lot Private Parking Emerging 42 19 45.2% 13 31.0% 19 45.2%
15 Franklin Surface Parking Lot Private Parking Emerging 36 29 80.6% - 29 80.6%
16 Franklin Surface Parking Lot Private Parking Emerging 15 2 13.3% - 2 13.3%
17 Franklin Surface Parking Lot Private Parking Emerging 64 39 60.9% 61 95.3% 61 95.3%
18 Franklin Surface Parking Lot Private Parking Emerging 28 28 100.0% 6 21.4% 28 100.0%
19 Franklin Surface Parking Lot Private Parking Emerging 14 7 50.0% 14 100.0% 14 100.0%
20 Franklin Surface Parking Lot Private Parking Emerging 11 7 63.6% 9 81.8% 9 81.8%
21 Franklin Surface Parking Lot Private Parking Emerging 13 9 69.2% 10 76.9% 10 76.9%
22 Franklin Surface Parking Lot Private Parking Emerging 31 16 51.6% 15 48.4% 16 51.6%
23 Franklin On-street Parking On-street Parking Emerging 54 29 53.7% 54 100.0% 54 100.0%
24 Franklin Surface Parking Lot Private Parking Emerging 10 10 100.0% 8 80.0% 10 100.0%
25 Franklin Surface Parking Lot Public Parking Emerging 71 3 4.2% 71 100.0% 71 100.0%
26 Franklin On-street Parking On-street Parking Emerging 10 1 10.0% 10 100.0% 10 100.0%
27 Franklin On-street Parking On-street Parking Future 11 6 54.5% 11 100.0% 11 100.0%
28 Franklin On-street Parking On-street Parking Emerging 14 6 42.9% 12 85.7% 12 85.7%
29 Franklin Surface Parking Lot Private Parking Emerging 32 32 100.0% 5 15.6% 32 100.0%
30 Franklin Surface Parking Lot Private Parking Emerging 6 1 16.7% - 1 16.7%
31 Franklin Surface Parking Lot Private Parking Future 6 2 33.3% 3 50.0% 3 50.0%
32 Franklin Surface Parking Lot Private Parking Future 5 4 80.0% 5 100.0% 5 100.0%
33 Franklin On-street Parking On-street Parking Future 8 1 12.5% 6 75.0% 6 75.0%
34 Franklin Surface Parking Lot Private Parking Emerging 15 10 66.7% 12 80.0% 12 80.0%
35 Franklin Surface Parking Lot Private Parking Future 12 9 75.0% 12 100.0% 12 100.0%
36 Rosemary On-street Parking On-street Parking Established 3 2 66.7% 3 100.0% 3 100.0%
37 Rosemary On-street Parking On-street Parking Established 18 15 83.3% - 15 83.3%
38 Rosemary Surface Parking Lot Private Parking Established 8 7 87.5% 2 25.0% 7 87.5%
39 Rosemary Surface Parking Lot Private Parking Established 108 57 52.8% 44 40.7% 57 52.8% 40 Rosemary Surface Parking Lot Private Parking Established 20 18 90.0% 15 75.0% 18 90.0% 41 Rosemary Parking Structure Public Parking Established 301 170 56.5% 108 35.9% 170 56.5% 42 Rosemary Surface Parking Lot Private Parking Established 87 48 55.2% 15 17.2% 48 55.2% 43 Rosemary Parking Structure Public Parking Established 285 213 74.7% 57 20.0% 213 74.7% 44 Rosemary Surface Parking Lot Public Parking Established 108 79 73.1% 103 95.4% 103 95.4%
45 Rosemary Surface Parking Lot Private Parking Established 11 10 90.9% 6 54.5% 10 90.9%
46 Rosemary Surface Parking Lot Private Parking Established 10 8 80.0% - 8 80.0%
47 Rosemary Surface Parking Lot Private Parking Future 5 5 100.0% 2 40.0% 5 100.0%
48 Rosemary Surface Parking Lot Private Parking Future 49 32 65.3% 4 8.2% 32 65.3%
49 Rosemary Surface Parking Lot Private Parking Future 18 7 38.9% 2 11.1% 7 38.9%
50 Rosemary Surface Parking Lot Private Parking Future 20 11 55.0% 4 20.0% 11 55.0%
51 Rosemary Surface Parking Lot Private Parking Future 22 19 86.4% 5 22.7% 19 86.4%
52 Rosemary Surface Parking Lot Private Parking Future 28 14 50.0% - 14 50.0%
53 Rosemary Surface Parking Lot Private Parking Future 10 5 50.0% 8 80.0% 8 80.0%
54 Rosemary Surface Parking Lot Private Parking Future 28 5 17.9% 6 21.4% 6 21.4%
55 Rosemary Surface Parking Lot Public (Monthly) Future 104 82 78.8% 30 28.8% 82 78.8%
56 Rosemary Surface Parking Lot Public Parking Future 69 12 17.4% 77 111.6% 77 111.6%
57 Rosemary Surface Parking Lot Private Parking Future 42 26 61.9% 10 23.8% 26 61.9%
58 Rosemary Surface Parking Lot Private Parking Future 22 9 40.9% 3 13.6% 9 40.9%
59 Rosemary Surface Parking Lot Private Parking Future 20 12 60.0% 20 100.0% 20 100.0%
60 Rosemary Surface Parking Lot Private Parking Future 44 31 70.5% 7 15.9% 31 70.5%
61 Rosemary Surface Parking Lot Private Parking Future 4 4 100.0% 6 150.0% 6 150.0%
62 Rosemary Surface Parking Lot Private Parking Future 14 6 42.9% 7 50.0% 7 50.0%
63 Rosemary Surface Parking Lot Private Parking Future 62 15 24.2% 27 43.5% 27 43.5%
64 Rosemary Surface Parking Lot Private Parking Future 61 32 52.5% 27 44.3% 32 52.5%
65 Rosemary Surface Parking Lot Private Parking Future 136 135 99.3% 21 15.4% 135 99.3%
66 Rosemary Surface Parking Lot Private Parking Future 10 5 50.0% 1 10.0% 5 50.0%
67 Rosemary Surface Parking Lot Private Parking Future 26 12 46.2% 2 7.7% 12 46.2%
68 Rosemary Surface Parking Lot Private Parking Future 25 22 88.0% - 22 88.0%
69 Rosemary On-street Parking On-street Parking Future 3 3 100.0% 2 66.7% 3 100.0%
70 Rosemary Surface Parking Lot Private Parking Future 48 42 87.5% 17 35.4% 42 87.5%
71 Rosemary Surface Parking Lot Private Parking Future 42 33 78.6% 10 23.8% 33 78.6%
72 Rosemary Surface Parking Lot Private Parking Future 13 5 38.5% - 5 38.5%
73 Rosemary On-street Parking On-street Parking Future 9 7 77.8% 1 11.1% 7 77.8%
74 Rosemary Surface Parking Lot Private Parking Future 30 25 83.3% 24 80.0% 25 83.3%
75 Rosemary Surface Parking Lot Private Parking Future 35 10 28.6% 3 8.6% 10 28.6%
76 Rosemary Surface Parking Lot Private Parking Future 25 6 24.0% - 6 24.0%
77 Rosemary Surface Parking Lot Private Parking Future 26 3 11.5% - 3 11.5%
Peak
APPENDIX C: Updated Downtown Parking Inventory
id st type use nghbd spcs wkocc prcfulwk friocc prcfulfr pkocc prcfulpk price descr
1 Franklin On-street Parking On-street Parking Established 28 26 92.9% 27 96.4% 27 96.4% $1.00E Franklin row 2 Franklin On-street Parking On-street Parking Established 11 11 100.0% 11 100.0% 11 100.0% $1.00E Franklin row 3 Franklin Surface Parking Lot Public Parking Established 34 14 41.2% 20 58.8% 20 58.8% Porthole Alley Area 4 Franklin Surface Parking Lot Private Parking Emerging 100 67 67.0% 67 67.0% 67 67.0% University Bapt Ch 5 Franklin Surface Parking Lot Private Parking Emerging 27 28 103.7% 8 29.6% 28 103.7% University Square 6 Franklin Surface Parking Lot Private Parking Emerging 7 5 71.4% - 5 71.4% University Square 7 Franklin Surface Parking Lot Private Parking Emerging 74 74 100.0% 9 12.2% 74 100.0% University Square 8 Franklin Surface Parking Lot Private Parking Emerging 31 16 51.6% 19 61.3% 19 61.3% University Square 9 Franklin Surface Parking Lot Private Parking Emerging 16 13 81.3% 10 62.5% 13 81.3% University Square 10 Franklin Surface Parking Lot Private Parking Emerging 95 95 100.0% 77 81.1% 95 100.0% University Square 11 Franklin Surface Parking Lot Private Parking Emerging 89 78 87.6% 10 11.2% 78 87.6% University Square 12 Franklin Surface Parking Lot Private Parking Emerging 21 16 76.2% 15 71.4% 16 76.2% University Square 13 Franklin Surface Parking Lot Private Parking Emerging 43 12 27.9% 33 76.7% 33 76.7% University Square 14 Franklin Surface Parking Lot Private Parking Emerging 42 19 45.2% 13 31.0% 19 45.2% University Square 15 Franklin Surface Parking Lot Private Parking Emerging 36 29 80.6% - 29 80.6% Panera Restaurant 16 Franklin Surface Parking Lot Private Parking Emerging 15 2 13.3% - 2 13.3% Old Video Shop 17 Franklin Surface Parking Lot Private Parking Emerging 64 39 60.9% 61 95.3% 61 95.3% W Franklin Bike Shop 18 Franklin Surface Parking Lot Private Parking Emerging 28 28 100.0% 6 21.4% 28 100.0% Franklin Hotel 19 Franklin Surface Parking Lot Private Parking Emerging 14 7 50.0% 14 100.0% 14 100.0% Old Trail Shop 20 Franklin Surface Parking Lot Private Parking Emerging 11 7 63.6% 9 81.8% 9 81.8%
21 Franklin Surface Parking Lot Private Parking Emerging 13 9 69.2% 10 76.9% 10 76.9% Mexican Restaurant 22 Franklin Surface Parking Lot Private Parking Emerging 31 16 51.6% 15 48.4% 16 51.6% McDonald's 23 Franklin On-street Parking On-street Parking Emerging 54 29 53.7% 54 100.0% 54 100.0% $1.00W Franklin row 24 Franklin Surface Parking Lot Private Parking Emerging 10 10 100.0% 8 80.0% 10 100.0% UNC 440 W Franklin 25 Franklin Surface Parking Lot Public Parking Emerging 71 3 4.2% 71 100.0% 71 100.0% $1.00Pking Lot #3 26 Franklin On-street Parking On-street Parking Emerging 10 1 10.0% 10 100.0% 10 100.0% $1.00S Roberson row 27 Franklin On-street Parking On-street Parking Future 11 6 54.5% 11 100.0% 11 100.0% $1.00N Roberson row 28 Franklin On-street Parking On-street Parking Emerging 14 6 42.9% 12 85.7% 12 85.7% $1.00W Franklin row 29 Franklin Surface Parking Lot Private Parking Emerging 32 32 100.0% 5 15.6% 32 100.0% Visitor Center 30 Franklin Surface Parking Lot Private Parking Emerging 6 1 16.7% - 1 16.7% N & O, W Franklin 31 Franklin Surface Parking Lot Private Parking Future 6 2 33.3% 3 50.0% 3 50.0% Chinese Take Out 32 Franklin Surface Parking Lot Private Parking Future 5 4 80.0% 5 100.0% 5 100.0% Graham St Shops 33 Franklin On-street Parking On-street Parking Future 8 1 12.5% 6 75.0% 6 75.0% $1.00N Graham row 34 Franklin Surface Parking Lot Private Parking Emerging 15 10 66.7% 12 80.0% 12 80.0% Jiffy Lube 35 Franklin Surface Parking Lot Private Parking Future 12 9 75.0% 12 100.0% 12 100.0%
36 Rosemary On-street Parking On-street Parking Established 3 2 66.7% 3 100.0% 3 100.0% E Rosemary row 37 Rosemary On-street Parking On-street Parking Established 18 15 83.3% - 15 83.3% $1.00Henderson row 38 Rosemary Surface Parking Lot Private Parking Established 8 7 87.5% 2 25.0% 7 87.5% Post Office Pking 39 Rosemary Surface Parking Lot Private Parking Established 108 57 52.8% 44 40.7% 57 52.8%
40 Rosemary Surface Parking Lot Private Parking Established 20 18 90.0% 15 75.0% 18 90.0% E Rosemary Pking 41 Rosemary Parking Structure Public Parking Established 301 170 56.5% 108 35.9% 170 56.5% $1.30Wallace Deck 42 Rosemary Surface Parking Lot Private Parking Established 87 48 55.2% 15 17.2% 48 55.2% Rental Pking Lot 43 Rosemary Parking Structure Public Parking Established 285 213 74.7% 57 20.0% 213 74.7% $2.00Bk of Amer Pk Deck 44 Rosemary Surface Parking Lot Public Parking Established 108 79 73.1% 103 95.4% 103 95.4% $1.30Parking Lot #2 45 Rosemary Surface Parking Lot Private Parking Established 11 10 90.9% 6 54.5% 10 90.9% Rear Lot Pking 46 Rosemary Surface Parking Lot Private Parking Established 10 8 80.0% - 8 80.0% Bank Pking 47 Rosemary Surface Parking Lot Private Parking Future 5 5 100.0% 2 40.0% 5 100.0%
48 Rosemary Surface Parking Lot Private Parking Future 49 32 65.3% 4 8.2% 32 65.3% W Rosemary Corner Pk 49 Rosemary Surface Parking Lot Private Parking Future 18 7 38.9% 2 11.1% 7 38.9% Shelter Pking 50 Rosemary Surface Parking Lot Private Parking Future 20 11 55.0% 4 20.0% 11 55.0% Shelter Pking 51 Rosemary Surface Parking Lot Private Parking Future 22 19 86.4% 5 22.7% 19 86.4% Dirt Parking Lot 52 Rosemary Surface Parking Lot Private Parking Future 28 14 50.0% - 14 50.0% Dirt Parking Lot 53 Rosemary Surface Parking Lot Private Parking Future 10 5 50.0% 8 80.0% 8 80.0% Dirt Rental Pking 54 Rosemary Surface Parking Lot Private Parking Future 28 5 17.9% 6 21.4% 6 21.4% Walkers Funeral 55 Rosemary Surface Parking Lot Public (Monthly) Future 104 82 78.8% 30 28.8% 82 78.8% Parking Lot #5 56 Rosemary Surface Parking Lot Public Parking Future 69 12 17.4% 77 111.6% 77 111.6% $1.00Parking Lot #5 57 Rosemary Surface Parking Lot Private Parking Future 42 26 61.9% 10 23.8% 26 61.9% Pantana Bob's 58 Rosemary Surface Parking Lot Private Parking Future 22 9 40.9% 3 13.6% 9 40.9% Pharmacy Assoc 59 Rosemary Surface Parking Lot Private Parking Future 20 12 60.0% 20 100.0% 20 100.0% 208 W Franklin 60 Rosemary Surface Parking Lot Private Parking Future 44 31 70.5% 7 15.9% 31 70.5% Dirt Parking Lot 61 Rosemary Surface Parking Lot Private Parking Future 4 4 100.0% 6 150.0% 6 150.0% Dance Club Pking 62 Rosemary Surface Parking Lot Private Parking Future 14 6 42.9% 7 50.0% 7 50.0% 7-11 W Rosemary 63 Rosemary Surface Parking Lot Private Parking Future 62 15 24.2% 27 43.5% 27 43.5% Breadmans 64 Rosemary Surface Parking Lot Private Parking Future 61 32 52.5% 27 44.3% 32 52.5% Hams Restaurant 65 Rosemary Surface Parking Lot Private Parking Future 136 135 99.3% 21 15.4% 135 99.3%
66 Rosemary Surface Parking Lot Private Parking Future 10 5 50.0% 1 10.0% 5 50.0% Doctors Office 67 Rosemary Surface Parking Lot Private Parking Future 26 12 46.2% 2 7.7% 12 46.2% Doctors Office 68 Rosemary Surface Parking Lot Private Parking Future 25 22 88.0% - 22 88.0% W Rosemary Pk Lot 69 Rosemary On-street Parking On-street Parking Future 3 3 100.0% 2 66.7% 3 100.0% $1.00W Rosemary row 70 Rosemary Surface Parking Lot Private Parking Future 48 42 87.5% 17 35.4% 42 87.5% UNC 440 W Franklin 71 Rosemary Surface Parking Lot Private Parking Future 42 33 78.6% 10 23.8% 33 78.6% Mitchell Ln 72 Rosemary Surface Parking Lot Private Parking Future 13 5 38.5% - 5 38.5% Restaurant Pk Lot 73 Rosemary On-street Parking On-street Parking Future 9 7 77.8% 1 11.1% 7 77.8% $1.00W Rosemary row 74 Rosemary Surface Parking Lot Private Parking Future 30 25 83.3% 24 80.0% 25 83.3%
75 Rosemary Surface Parking Lot Private Parking Future 35 10 28.6% 3 8.6% 10 28.6% Church Pk Lot 76 Rosemary Surface Parking Lot Private Parking Future 25 6 24.0% - 6 24.0%
APPENDIX D: Pricing Analysis Calculations
id spaces peak occup.
% full at peak occup. empty spaces adjusted peak occup. (85%) adjusted peak occup. (rounded)
% full at adjusted peak occup.
prcnt. change in # spaces
prcnt. change in price to obtain this
new price old price descr
1 28 27 96.43% 1 23.8 24 85.71% -11.11% 20.54% $1.21 $1.00 E Franklin Row
2 11 11 100.00% 0 9.35 9 81.82% -18.18% 33.61% $1.34 $1.00 E Franklin row
3 34 20 58.82% 14 28.9 29 85.29% 45.00% -83.18% Porthole Alley Area
4 100 67 67.00% 33 85 85 85.00% 26.87% -49.66% University Baptist Church
5 27 28 103.70% 0 22.95 23 85.19% -17.86% 33.01% University Square
6 7 5 71.43% 2 5.95 6 85.71% 20.00% -36.97% University Square
7 74 74 100.00% 0 62.9 63 85.14% -14.86% 27.48% University Square
8 31 19 61.29% 12 26.35 26 83.87% 36.84% -68.10% University Square
9 16 13 81.25% 3 13.6 14 87.50% 7.69% -14.22% University Square
10 95 95 100.00% 0 80.75 81 85.26% -14.74% 27.24% Granville Towers
11 89 78 87.64% 11 75.65 76 85.39% -2.56% 4.74% University Square
12 21 16 76.19% 5 17.85 18 85.71% 12.50% -23.11% University Square
13 43 33 76.74% 10 36.55 37 86.05% 12.12% -22.41% University Square
14 42 19 45.24% 23 35.7 36 85.71% 89.47% -165.39% University Square
15 36 29 80.56% 7 30.6 31 86.11% 6.90% -12.75% Panera
16 15 2 13.33% 13 12.75 13 86.67% 550.00% -1016.64% Old VisArt Building
17 64 61 95.31% 3 54.4 54 84.38% -11.48% 21.21% W. Franklin Bike Shop
18 28 28 100.00% 0 23.8 24 85.71% -14.29% 26.41% Franklin Hotel
19 14 14 100.00% 0 11.9 12 85.71% -14.29% 26.41% Old Trail Shop
20 11 9 81.82% 2 9.35 9 81.82% 0.00% 0.00% Shop Rear Lot Pkg
21 13 10 76.92% 3 11.05 11 84.62% 10.00% -18.48% Mexican Restaurant
22 31 16 51.61% 15 26.35 26 83.87% 62.50% -115.53% McDonalds
23 54 54 100.00% 0 45.9 46 85.19% -14.81% 27.38% $1.27 $1.00 W Franklin Row
24 10 10 100.00% 0 8.5 9 90.00% -10.00% 18.48% UNC 440 W Franklin
25 71 71 100.00% 0 60.35 60 84.51% -15.49% 28.64% $1.29 $1.00 Pking Lot #3
26 10 10 100.00% 0 8.5 9 90.00% -10.00% 18.48% $1.18 $1.00 S Roberson row
27 11 11 100.00% 0 9.35 9 81.82% -18.18% 33.61% $1.34 $1.00 N Roberson row
28 14 12 85.71% 2 11.9 12 85.71% 0.00% 0.00% $1.00 $1.00 W Franklin row
29 32 32 100.00% 0 27.2 27 84.38% -15.63% 28.88% OC Skills Dev. Center
30 6 1 16.67% 5 5.1 5 83.33% 400.00% -739.37% N & O, W Franklin
31 6 3 50.00% 3 5.1 5 83.33% 66.67% -123.23% Chinese Take Out
32 5 5 100.00% 0 4.25 4 80.00% -20.00% 36.97% Graham St Shops
33 8 6 75.00% 2 6.8 7 87.50% 16.67% -30.81% $0.69 $1.00 N Graham row
34 15 12 80.00% 3 12.75 13 86.67% 8.33% -15.40% Jiffy Lube
35 12 12 100.00% 0 10.2 10 83.33% -16.67% 30.81% Abundant Life Outreach Min.
36 3 3 100.00% 0 2.55 3 100.00% 0.00% 0.00% Loading Zone - Rosemary
37 18 15 83.33% 3 15.3 15 83.33% 0.00% 0.00% $1.00 $1.00 Henderson row
38 8 7 87.50% 1 6.8 7 87.50% 0.00% 0.00% Post Office parking
39 108 57 52.78% 51 91.8 92 85.19% 61.40% -113.50% Dentist parking + permit
40 20 18 90.00% 2 17 17 85.00% -5.56% 10.27% Bub O'Malleys/Wetlands/Hell
41 301 170 56.48% 131 255.85 256 85.05% 50.59% -93.51% $0.08 $1.30 Wallace Deck
42 87 48 55.17% 39 73.95 74 85.06% 54.17% -100.12% Rental Parking Lot
43 285 213 74.74% 72 242.25 242 84.91% 13.62% -25.17% $1.50 $2.00 Bk of America Pk Deck 44 108 103 95.37% 5 91.8 92 85.19% -10.68% 19.74% $1.56 $1.30 Rosemary parking lot
45 11 10 90.91% 1 9.35 9 81.82% -10.00% 18.48% Rear Lot Parking
46 10 8 80.00% 2 8.5 9 90.00% 12.50% -23.11% RBC Centura
47 5 5 100.00% 0 4.25 4 80.00% -20.00% 36.97% Investor's Title Co.
48 49 32 65.31% 17 41.65 42 85.71% 31.25% -57.76% Investor's Title Co.
49 18 7 38.89% 11 15.3 15 83.33% 114.29% -211.25% Shelter Parking
50 20 11 55.00% 9 17 17 85.00% 54.55% -100.82% Rental Parking
51 22 19 86.36% 3 18.7 19 86.36% 0.00% 0.00% Rental Parking
52 28 14 50.00% 14 23.8 24 85.71% 71.43% -132.03% Investor's Title Co.
53 10 8 80.00% 2 8.5 9 90.00% 12.50% -23.11% Business (Brown and Bunch)
54 28 6 21.43% 22 23.8 24 85.71% 300.00% -554.53% Walker's Funeral Home
55 104 82 78.85% 22 88.4 88 84.62% 7.32% -13.53% Parking Lot #5
56 69 77 111.59% 0 58.65 59 85.51% -23.38% 43.21% $1.43 $1.00 Parking Lot #5
57 42 26 61.90% 16 35.7 36 85.71% 38.46% -71.09% Pantana Bob's
58 22 9 40.91% 13 18.7 19 86.36% 111.11% -205.38% Pharmacy Assoc
59 20 20 100.00% 0 17 17 85.00% -15.00% 27.73% 208 W Franklin
60 44 31 70.45% 13 37.4 37 84.09% 19.35% -35.78% Private Lot
61 4 6 150.00% 0 3.4 3 75.00% -50.00% 92.42% Avalon Parking
62 14 7 50.00% 7 11.9 12 85.71% 71.43% -132.03% Key Food Mart
63 62 27 43.55% 35 52.7 53 85.48% 96.30% -178.00% Breadman's
64 61 32 52.46% 29 51.85 52 85.25% 62.50% -115.53% Hams Restaurant
65 136 135 99.26% 1 115.6 116 85.29% -14.07% 26.01% UNC 440 N W. Franklin
66 10 5 50.00% 5 8.5 9 90.00% 80.00% -147.87% CH-Carrboro City Schools
67 26 12 46.15% 14 22.1 22 84.62% 83.33% -154.04% CH-Carrboro City Schools
68 25 22 88.00% 3 21.25 21 84.00% -4.55% 8.40% UNC 440 N W. Franklin
69 3 3 100.00% 0 2.55 3 100.00% 0.00% 0.00% $1.00 $1.00 W Rosemary row
70 48 42 87.50% 6 40.8 41 85.42% -2.38% 4.40% UNC 440 W Franklin
71 42 33 78.57% 9 35.7 36 85.71% 9.09% -16.80% Tate Realty
72 13 5 38.46% 8 11.05 11 84.62% 120.00% -221.81% Restaurant Pk Lot
73 9 7 77.80% 2 7.65 8 88.89% 14.29% -26.41% $0.74 $1.00 W Rosemary row
74 30 25 83.33% 5 25.5 26 86.67% 4.00% -7.39% La Potosina Parking
75 35 10 28.57% 25 29.75 30 85.71% 200.00% -369.69% First Baptist Church
76 25 6 24.00% 19 21.25 21 84.00% 250.00% -462.11% Church Lot
APPENDIX E: Analysis Results for Performance-Based Pricing
Fac ility C urr e nt price N ew price Cur re n t o ccu p anc y rate Ne w occ upanc y rat e # Occ upie d s p aces N e w # oc cu pie d s p ac es # emp ty s aces Ne w # e m pty s p p aces On-s tre e t ho ur ly E F rank lin Row $1.00 $1 .25 96% 8 6% 27 24 1 4 E F rank lin r o w $1.00 $1 .25 100% 8 2% 11 9 0 2 W F rank lin Row $1.00 $1 .25 100% 8 5% 54 46 0 8 S R ober s on r ow $1.00 $1 .25 100% 9 0% 10 9 0 1 N R ober s on r ow $1.00 $1 .25 100% 8 2% 11 9 0 2 W F rank lin r ow $1.00 $1 .00 86% 8 6% 12 12 2 2 N Gr aham r o w $1.00 $0 .75 7 5% 8 8 % 6 7 2 1 H ender s on r ow $1.00 $1 .00 83% 8 3% 15 15 3 3 W R o s e m a ry r o w $1.00 $1 .00 1 00% 1 00 % 3 3 0 0 W R o s e m a ry r o w $1.00 $0 .75 78% 8 9 % 7 8 2 1 Off-s tre e t ho ur ly P ar king Lot #3
$1.00 $1 .25 100% 8 5% 71 60 0 11 W allac e D eck $1.30 $0 .25 56% 8 5% 170 256 13 1 45 Bk of Am er ic a Pk De ck $2.00 $1 .50 75% 8 5 % 213 242 7 2 4 3 Ros em a ry par k ing lot $1.30 $1 .50 95% 8 5% 103 92 5 16 P ar k
ing Lot #5
$1.00 $1 .50 112% 8 6% 77 59 0 10 Off-s tre e t monthl y R ental Par k ing Lot $85.00 $25 .00 55% 8 5% 48 74 3 9 13 Inves tor 's T itle Co. $85.00 $115 .00 100% 8 0% 5 4 0 1 Inves tor 's T itle Co. $85.00 $35 .00 65% 8 6% 32 42 1 7 7 R ental Par k ing $85.00 $25 .00 55% 8 5% 11 17 9 3 R ental Par k ing $85.00 $85 .00 86% 8 6% 19 19 3 3 Inves tor 's T itle Co. $85.00 $25 .00 50% 8 6% 14 24 1 4 4 P ar k
ing Lot #5
APPENDIX F: Pricing Economic Analysis
Facility Current price New price # Occupied
spaces
New # occupied spaces
# empty spaces
New # empty spaces Current hourly revenue New hourly revenue On-street hourly
E Franklin Row $1.00 $1.25 27 24 1 4 $27.00 $30.00
E Franklin row $1.00 $1.25 11 9 0 2 $11.00 $11.25
W Franklin Row $1.00 $1.25 54 46 0 8 $54.00 $57.50
S Roberson row $1.00 $1.25 10 9 0 1 $10.00 $11.25
N Roberson row $1.00 $1.25 11 9 0 2 $11.00 $11.25
W Franklin row $1.00 $1.00 12 12 2 2 $12.00 $12.00
N Graham row $1.00 $0.75 6 7 2 1 $6.00 $5.25
Henderson row $1.00 $1.00 15 15 3 3 $15.00 $15.00
W Rosemary row $1.00 $1.00 3 3 0 0 $3.00 $3.00
W Rosemary row $1.00 $0.75 7 8 2 1 $7.00 $6.00
$156.00 $162.50
Yearly revenue $312,000.00 $325,000.00
revenue/space $1,879.52 $1,957.83
Facility Current price New price # Occupied
spaces
New # occupied spaces
# empty spaces
New # empty spaces Current hourly revenue New hourly revenue Off-street hourly
Parking Lot #3 $1.00 $1.25 71 60 0 11 $71.00 $75.00
Wallace Deck $1.30 $0.25 170 256 131 45 $221.00 $64.00
Bk of America Pk Deck $2.00 $1.50 213 242 72 43 $426.00 $363.00
Rosemary parking lot $1.30 $1.50 103 92 5 16 $133.90 $138.00
Parking Lot #5 $1.00 $1.50 77 59 0 10 $77.00 $88.50
$928.90 $728.50
Yearly revenue $1,857,800.00 $1,457,000.00
revenue/space $2,206.41 $1,747.00
Facility Current price New price # Occupied
spaces
New # occupied spaces
# empty spaces
New # empty spaces Current monthly revenue New monthly revenue Off-street monthly
Rental Parking Lot $85.00 $25.00 48 74 39 13 $4,080.00 $1,850.00
Investor's Title Co. $85.00 $115.00 5 4 0 1 $425.00 $460.00
Investor's Title Co. $85.00 $35.00 32 42 17 7 $2,720.00 $1,470.00
Rental Parking $85.00 $25.00 11 17 9 3 $935.00 $425.00
Rental Parking $85.00 $85.00 19 19 3 3 $1,615.00 $1,615.00
Investor's Title Co. $85.00 $25.00 14 24 14 4 $1,190.00 $600.00
Parking Lot #5 $85.00 $75.00 82 88 22 16 $6,970.00 $6,600.00
$17,935.00 $13,020.00
Yearly revenue $215,220.00 $156,240.00
revenue/space $683.24 $496.00
REFERENCES
City of Redwood City. (2007). Redwood City Website: Downtown Parking. Retrieved March 24, 2007 from http://www.redwoodcity.org/redevelopment/downtown/parking.html/
Clinch, P.J. & Kelly, A. (2003). Temporal Variance of Revealed Preference On-Street Parking Price Elasticity. Department of Environmental Studies, University College Dublin.
Dougherty, Connor. (2007, February 3). The Parking Fix. The Wall Street Journal. Retrieved March 16, 2007 from http://www.transalt.org/press/media/2007/769.html/
Downtown Parking Citizens Committee. (2007, February 26). Report to the Town Council.
Downtown Parking. (2005, June). Municipal Research and Services Center of Washington. Retrieved January 19, 2007 from http://www.mrsc.org/
Hensher, D.A. & King, J. (2001, March). Parking Demand and Responsiveness to Supply, Price and Location in Sydney Central Business District. Transportation Research A, Vol. 35, No. 3, pp. 177-196.
Kuzmyak, R.J., Weinberger, R., Levinson, H.S. (2003). Parking Management and Supply: Traveler Response to Transport System Changes. Chap. 18, Report 95, Transit Cooperative Research Program; Transportation Research Board.
Litman, Todd. (2006a). Parking Management: Strategies, Evaluation and Planning. Victoria Transport Policy Institute. Retrieved February 5, 2007 from
http://www.vtpi.org/park_man.pdf/
LSA Associates. (2004). Appendix C – Downtown Parking Study: Town of Chapel Hill, North Carolina.
Manville, M. & Shoup, D. (2004). People, Parking, and Cities. Access 25, pp. 2-8.
Shoup, Donald. (1999, September). The Trouble with Minimum Parking
Requirements.Transportation Research A, Vol. 33, No. 7/8, pp. 549-574.
Shoup, Donald. (2005). The High Cost of Free Parking. Planners Press.
Shoup, Donald. (2006, July). The High Cost of Free Parking. Lecture conducted at the San Diego Parking Symposium, San Diego, CA.
Town of Chapel Hill. (2007). Town of Chapel Hill Website: Municipal Parking. Retrieved April 3, 2007 from http://www.ci.chapel-hill.nc.us/
U.S. Census. (2000). U.S. Census Bureau Official Website. Retrieved February 25, 2007 from http://www.census.gov/