Identification of specific gene expression after
exposure to low dose ionizing radiation revealed
through integrative analysis of cDNA microarray data
and the interactome
INTRODUCTION
According to the ICRP (International Commission on Radiological Protection), the incidence rate of cancer is proportional to the dose of radiation exposure, with no safety threshold (1, 2). In contrast, low dose ionizing
radiation (LDIR) effects, such as the adaptive response, the bystander effect, and genome instability are accepted, meaning that the LNT (the linear no threshold) model may not be correct for LDIR (3-6). The concept of an adaptive response refers to the idea that pre-exposure to
LDIR can increase cellular tolerance to
J.C. Son
1, H.O. Jeong
1, E.K. Lee
1, 2, S.G. No
1, D. Park
3,4, H.Y. Chung
1,2*1Interdisciplinary Research Program of Bioinformatics and Longevity Science, Pusan National University, Busan,
Republic of Korea
2Molecular Inflammation Research Center for Aging Intervention (MRCA), College of Pharmacy, Pusan National
University, Busan 46241, Republic of Korea
3Department of Predictive Toxicology, Korea Institute of Toxicology, Daejeon, Republic of Korea 4Center for Convergent Research of Emerging Virus Infection, Korea Research Institute of Chemical Technology,
141, Gajeong-ro, Yuseong-gu, Daejeon 34114, Republic of Korea
ABSTRACT
Background: Accumulating reports suggest that the biological effects of low- and high- dose ionizing radiation (LDIR and HDIR) are qualitatively different and might cause different effects in human skin. Materials and Methods: To better understand the potential risks of LDIR, we analyzed three cDNA microarray datasets from the Gene Expression Omnibus database. Results: A pathway analysis showed that genes in immune-associated pathways were upregulated while those in cancer-associated pathways were downregulated in skin exposed to LDIR as compared with non-irradiated control skin. Consistently, according to a comparative gene ontology analysis, “antigen presentation and processing” was the most different gene ontology between the LIDR and HDIR transcriptomes. To identify key molecules regulated by LDIR, we constructed a protein-protein interaction network analysis using topological metrics. One of the key molecules with a high network scores was E1A binding protein p300 (EP300), which is a potential target of a new therapeutic strategy to promote anti-tumor immunity. Conclusion: Our results showed that LDIR exposure mainly induced the upregulation of immune-related genes including chemokines (CXCL1, CXCL2, and CXCL5) and interleukins (IL1B, IL11, IL6, IL15, and IL7). Additionally, LDIR induced the upregulation of antigen processing and presentation-related genes including CIITA, HLA-DQB1, and KIF26A, but these genes were downregulated in HDIR-exposed skin. Our protein network interaction results indicated that EP300 is downregulated by the immune response in skin after LDIR exposure.
Keywords: LDIR, cDNA microarray, transcriptome, Bioinformatics, EP300. *Corresponding authors:
Hae Young Chung, PhD., Fax: +82 51 5188 2821 E-mail: [email protected]
Revised: August 2017 Accepted: October 2017
Int. J. Radiat. Res., January 2019; 17(1): 15-23
►
Original article
DOI: 10.18869/acadpub.ijrr.17.1.15
subsequent radiation exposure through a hormetic mechanism and may thereby result in
such consequences as life span prolongation (7, 8), reduced tumor growth (9), improvement in degenerative disorders (10-12), and immune activation (13). Thus, LDIR-induced DNA damage
below a certain threshold of severity could stimulate DNA repair systems, yielding a net long-term benefit to cellular functionality (14). Epigenetic modification (15) or differential gene expression (16) after LDIR exposure may contribute to this effect. Therefore, more studies need to be conducted to elucidate the effects of LDIR.
With the progression of high-throughput genomic technologies, global mRNA expression data is the most advanced current method for
obtaining information about the cellular response to ionizing radiation. The use of gene
ontology (GO) classifications of genes with statistically significant expression changes is a
common procedure and a powerful tool for a deeper understanding of transcriptomics data. Functional genomic analysis contributes to the analysis of gene expression on a global scale. Therefore, we implemented a web application called Comparative GO to enable the comparison of the distribution of GO terms across multiple datasets (17). Although there were many previously existing web applications for GO analysis, none were suitable for the comparison of data from different sources. The collation of a tabular report containing a list of increased or decreased genes/proteins sorted with respect to their GO term contributes to understanding the effects of stimuli on biological pathways and the mechanisms of pathogenesis.
The purpose of this report was to assess the global cDNA expression profile of human skin samples exposed to LDIR and high dose ionizing radiation (HDIR) using cDNA microarray data sets. Using the result of microarray, we aimed to compare biological pathways and comparative GO terms between the skin samples exposed to LDIR and those exposed to HDIR. Skin is the first point of contact for radiation in most external exposure scenarios and skin samples can easily be obtained by biopsy to assess the biomolecular damage and biological response caused by LDIR.
16
The significance of this study is that immune-related and cancer-related biological
pathways were meaningfully distinguishable between skin samples exposed to LDIR and those exposed to HDIR. Our integrative analysis of high-throughput gene expression data and subsequent construction of a protein-protein interaction (PPI) network provide evidence that
contributes to a better understanding LDIR-induced immune enhancement.
MATERIALS AND METHODS
Microarray gene expression datasetsTo identify differentially expressed genes
(DEGs) through comparing skin samples exposed to LDIR with those exposed to HDIR, we
screened publicly available microarray datasets and found the datasets GSE23807, GSE59861, and GSE29344 (total n = 25 subjects), which
were retrieved from the Gene Expression Omnibus (GEO). In those three datasets, human
skin samples (EpiDermFT-400, EPI-200, and AG01522 cells) were exposed to different total doses of radiation at dose rates between 10.5–50 cGy/min using a clinical X-ray irradiator. We defined LDIR as a total dose ≤ 10 cGy and HDIR as a total dose ≥ 100 cGy. The samples were harvested to obtain RNA 3–4 h after the radiation exposure.
Preprocessing for identification of genes with significant differences in expression
Before analyzing the microarray datasets, the gene expression values were log2 transformed, followed by normalization across all samples. Microarray gene expression values from samples representing different conditions (control vs. LDIR and control vs. HDIR) were compared by a two-class unpaired test using the Significance Analysis of Microarray tool (http:// statweb.stanford.edu/~tibs/SAM) to find DEGs. The DEGs in the LDIR and HDIR datasets were selected by an absolute fold-change of 1.5 (as compared with the control dataset) and a false discovery rate of 0.05. We then combined the DEGs obtained from the selected datasets.
Kyoto encyclopedia of genes and genomes (KEGG) pathway analysis
KEGG terms for biological pathways were
used as provided by the Database for Annotation, Visualization, and Integrated Discovery (DAVID version 6.7) (https://
david.ncifcrf.gov/). Further, we conducted Fisher’s exact t-test to detect the enrichment of DEGs within KEGG pathways (p < 0.05).
Comparative GO analysis
To compare GO terms between the LDIR and HDIR transcriptomes, we conducted an analysis
using Comparative GO (http://
www.comparativego.com). Other GO web applications can compare a single sample to another reference sample and present differentially regulated GOs with p-values. However, Comparative GO can compare the distribution of GO terms among gene expression
datasets from several different sources and provides a tabular report of the number of genes
exceeding the fold-change threshold among treatment groups, enabling the identification of the GO terms that contain the most DEGs.
Analysis of PPI Network
To identify proteins that acted as hubs in the PPI network, we used the HPRD (Human Protein
Reference Database) release 9 and IntAct molecular interaction database) version 2.0. Cytoscape (http://www.cytoscape.org/) was used for visualizing the interaction network. The degree and betweenness centrality were calculated for each node in the PPI network (18).
The degree is classified as the number of interacting partners that connect each protein to
its neighbors, while betweenness centrality represents the number of short paths between
one protein and other proteins. These two topological parameters have been known to assist the detection of functionally important genes. Clustering analysis was also conducted to distinguish groups that have high degrees and betweenness centralities compared with the other groups.
RESULTS
Identification of DEGs Associated with LDIR and HDIR Exposure Levels
To identify radiation-regulated DEGs using three human skin datasets from investigations in
which different radiation doses were administered, we selected three cDNA microarray datasets representing LDIR exposure, HDIR exposure, and non-irradiated
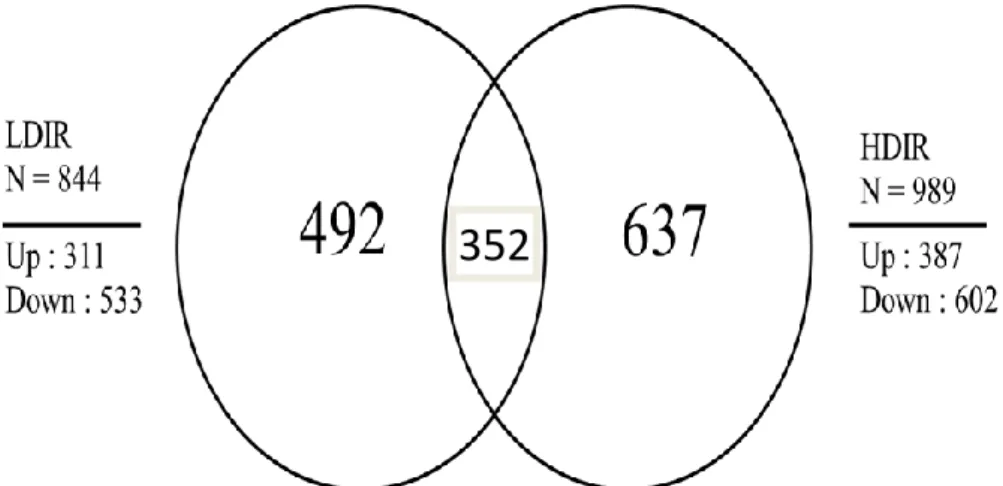
control skin. As a result, we obtained 1,833 DEGs, which we collectively termed the LDIR and HDIR transcriptomes. There were 844 DEGs in the LDIR dataset and 989 DEGs in the HDIR dataset relative to the non-irradiated control (figure 1). In the LDIR transcriptome, 311 genes were increased and 533 were decreased. In the HDIR transcriptome, 387 genes were increased and 602 were decreased. A total of 352 DEGs
were shared between the LDIR and HDIR transcriptomes.
Sample clustering analysis
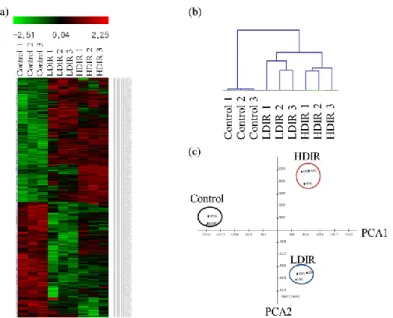
In order to compare the gene expression patterns among samples, we utilized MeV software (19). As illustrated in figure 2, we used
hierarchical link clustering (HLC) and principal component analysis (PCA) methods. Based on HLC analysis, the samples were divided into two clusters: control and radiation. Furthermore, the
radiation samples were divided into two clusters: LDIR and HDIR (figures 2a & b). PCA
was employed to determine the gene specificity among different groups. Irradiated samples were clearly separated from the control group and
LDIR samples showed distinct expression patterns from those of HDIR samples (figure 2c).
These results suggested that high-throughput
gene expression profiling can differentiate between LDIR and HDIR exposure.
Pathway Enrichment Analysis of the LDIR and HDIR Transcriptomes
We performed a KEGG pathway enrichment analysis using the DAVID database, which showed that the upregulated genes in the LDIR
17
Int. J. Radiat. Res., Vol. 17 No. 1, January 2019transcriptome were mainly related to immune-associated pathways such as “cytokine-cytokine receptor interaction”,
“apoptosis”, and “NOD-like receptor signaling pathway”. In addition, LDIR exposure caused the down-regulation of pathways related to the process of skin cancer, such as “melanogenesis”, “basal cell carcinoma”, “hedgehog signaling pathway”, and “pathways in cancer” (table 1).
In the HDIR transcriptome, the pathways associated with upregulated genes were largely
cancer-related, including “p53 signaling pathway”, “ErbB signaling pathway”, “VEGF signaling pathway”, “focal adhesion”, “ECM-receptor interaction”, and several cancer
pathways. In addition, downregulated genes related to cell proliferation presented a bias toward pathways such as “cell cycle”, “meiosis”, and “DNA replication” (table 2).
Comparative GO analysis of LDIR and HDIR transcriptomes
We applied the Comparative GO web application to compare the lists of GO terms between the LDIR and HDIR transcriptomes. As shown in Figure 3, immune-related biological processes, such as antigen processing and presentation (101.5 times), immune response (24.5 times), and regulation of tumor necrosis factor super family cytokine production (8.6 times) showed differences between the
upregulated genes in LDIR and HDIR transcriptomes. The specific genes responsible
for antigen processing and presentation that
were upregulated by LDIR exposure but downregulated by HDIR transcriptomes were
major histocompatibility complex class II, DQ
beta 1 (HLA-DQB1), class II major histocompatibility complex transactivator
(CIITA), and kinesin family member 66 A (KIF26A). Target molecules in the PPI network
To determine key molecules that regulate the
immune response to LDIR exposure, we conducted a PPI network analysis because the
PPI network has been widely used to develop drug targets, disease genes, and essential genes in organisms ranging from yeast to humans. In this study, information on human PPI networks
was obtained from the HPRD and IntAct databases. As a result, the PPI network of the
significantly expressed genes in the LDIR transcriptome was composed of 184 genes (77
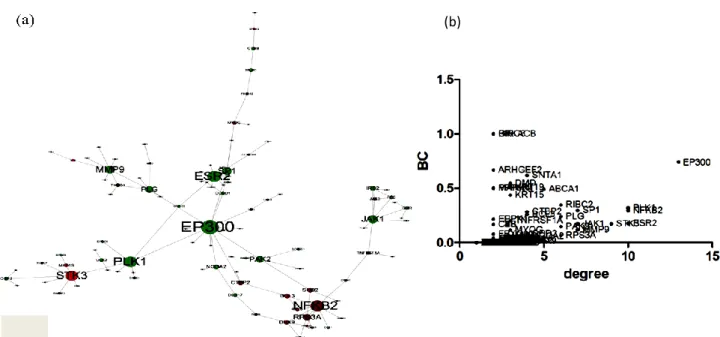
upregulated genes and 107 downregulated genes), as shown in Figure 4a. To identify target
molecules in the PPI network, we then performed a clustering analysis using the degree
and betweenness centrality as the topological parameters. As a result, E1A binding protein p300 (EP300) was predicted as a target molecule because it had a higher degree and betweenness centrality than the other nodes (figure 4b).
Figure 1. Differentially expressed genes (DEGs) in the low-dose ionizing radiation (LDIR)- and high-dose ionizing radiation (HDIR)-exposed skin transcriptomes. The DEGs were selected using the absolute cut-off criteria of a fold-change > 1.5 and a false discovery rate < 0.05. As a result, we obtained 1,833 DEGs from the LDIR and HDIR transcriptomes (844 in LDIR and 989 in HDIR).
18
352
19
Int. J. Radiat. Res., Vol. 17 No. 1, January 2019Figure 2. Visualizations of cDNA microarray gene expression profiles of the LDIR- and HDIR-exposed skin transcriptomes.
(a) Analysis of microarray data shown as a heat map comparing global gene expression patterns among the control, LDIR, and HDIR transcriptomes. Red and green colors indicate differentially up- or down-regulated genes, respectively (fold-change > 2).
(b) Hierarchical link clustering and (c) principal component analysis plot. Two-dimensional scatter plots for dividing the samples based on two principal components are shown in (c).
Category Term Count p -value
Upregulated KEGG_PATHWAY
KEGG_PATHWAY KEGG_PATHWAY
Cytokine-cytokine receptor interaction Apoptosis
NOD-like receptor signaling pathway
17 8 6
1.53E-04 2.7E-03 1.1E-02 Downregulated
KEGG_PATHWAY KEGG_PATHWAY KEGG_PATHWAY KEGG_PATHWAY KEGG_PATHWAY KEGG_PATHWAY
Complement and coagulation cascades Melanogenesis
Nitrogen metabolism Basal cell carcinoma Hedgehog signaling pathway
Pathways in cancer
7 8 4 5 5 14
5.4E-03 8.5E-03 1.6E-02 3.9E-02 4.2E-02 4.4E-02
Table 1. KEGG pathway analysis of up- or down-regulated DEGs in LDIR
Category Term Count p-value
Upregulated KEGG_PATHWAY KEGG_PATHWAY KEGG_PATHWAY KEGG_PATHWAY KEGG_PATHWAY KEGG_PATHWAY KEGG_PATHWAY KEGG_PATHWAY
p53 signaling pathway ErbB signaling pathway VEGF signaling pathway
Focal adhesion Non-small cell lung cancer
Small cell lung cancer ECM-receptor interaction
Pathways in cancer
8 8 6 10
5 6 6 13
5.3E-04 2.3E-03 2.1E-02 2.6E-02 2.7E-02 3.2E-02 3.2E-02 4.4E-02 Downregulated
KEGG_PATHWAY KEGG_PATHWAY KEGG_PATHWAY
Cell cycle Oocyte meiosis DNA replication
20 13 6
7.58E-07 2.0E-03 1.6E-02
Table 2. KEGG pathway analysis of up- or down-regulated DEGs in HDIR.
20
Figure 3. Comparison between the gene ontology (GO) terms associated with upregulated genes in the LDIR and HDIR transcriptomes. Protein enrichment values were normalized based on the number of genes in each sample. The enrichment values
of the smaller samples are scaled higher to be comparable to those of the bigger samples. Among the DEGs in the LDIR and HDIR transcriptomes, those whose protein enrichment value underwent a rate of change > 2 were selected and categorized according to
their biological process. The rate of change reflects the geometric average of the enrichment value fold-change among samples in that GO group.
(b)
Figure 4. Protein-protein interaction network composed of DEGs in the LDIR transcriptome. (a) The network, in which the nodes indicate proteins and the edges indicate the interactions between the proteins inferred from the IntAct and HPRD databases. A
total of 77 proteins that were upregulated in the LDIR transcriptome are represented in red, and 107 proteins that were downregulated in the LDIR are represented in green. (b) The degree is correlated with the number of interacting partners and BC
(betweenness centrality) represents the number of short paths between one protein and other proteins.
21
Int. J. Radiat. Res., Vol. 17 No. 1, January 2019DISCUSSION
Even though the molecular mechanisms underlying the LDIR-induced immune response
are still unknown, low dose radiotherapy is considered as an alternative option for the treatment of inflammatory diseases and degenerative joint disorders in Germany and other European countries (20-23). Interestingly,
LDIR has been reported to decrease the incidence rates of several cancers, including B16
melanoma (24).
In accordance with these findings, our results showed that among the DEGs identified in the
LDIR transcriptome, most of them were upregulated immune response genes including
chemokines (CXCL1, CXCL2, and CXCL5) and interleukins (IL1B, IL11, IL6, IL15, and IL7). Chemokines have important functions in wound healing, lymphocyte homing, chemotactic activity for lymphocytes, and influencing the overall type 1/type 2 balance of an immune response (25, 26). Akira et al. found that after a single low dose exposure (1.0 cGy), chemokines (CXCL1, CXCL2, and CXCL6) were significantly upregulated in normal human fibroblasts (27). Interleukins are mediator of inflammation, the immune system, and cancer. The increases of
IL1B and IL6 caused by 4.5 Gy can contribute to the enhancement of immune responses (28). Furthermore, an increased expression level of
IL15 was reported following irradiation; this interleukin acts through the selective inhibition of tumor-promoting molecules, and has been considered as a potential new compound for use in cancer treatment (29). The T cell lymphocyte
development-related cytokine IL3 was upregulated in low dose exposed mice (30). These
data imply that LDIR-induced immune responses are likely to be activated to eliminate
damaged cells as part of a tumor inhibition, and
this might lead to decreases in several cancer-related pathways as indicated by our
KEGG analysis (table 1).
Comparative GO analysis revealed that LDIR
induced the up-regulation of antigen processing- and presentation-related genes including CIITA, HLA-DQB1, and KIF26A, but HDIR was associated with the down-regulation
of these genes. Efficient antigen presentation and processing is important for inducing potent anti-tumor immune responses because the function of the MHC class molecules is critical in some cancers (31-34). Kinesin is a motor protein that is related to the transport of MHC class II containing complexes along microtubules to the late endosomal compartment. Recently, many reports have revealed that aberrant gene expression of kinesins plays a key role in a variety of human cancers, suggesting that kinesins may represent new molecular targets
for cancer therapy (35-37). MHC class II is important for the activation of helper T cells. It is
well documented that helper T cells contribute
to anti-tumor immunity (38). Several solid cancers do not express MHC class II, and the involvement of helper T cells depends on infiltrating antigen-presenting cells. CIITA, the
master regulator of MHC class II transcription, is a non-DNA binding protein and has also been found to be increased during immune responses. Therefore, we propose that KIF22A, HLA-DQB1, and CIITA play important roles in the LDIR induced effects on antigen presentation and processing.
An analysis of the hub genes among the DEGs in the LDIR dataset (figure 4a) revealed that
EP300 had the highest connective degree. EP300
is involved in several processes including proliferation, apoptosis, and DNA damage (39, 40). Yujie et al. reported that EP300 plays an important role in anti-tumor immunity (41), and
inhibitors of EP300 were well-established caloric restriction mimetics (42). Acetyl coenzyme
A induces autophagy through a transcription-independent process related to the
reduction of acetyltransferase EP300 (43).
In summary, our findings show differences in signaling pathways and biological processes between the transcriptomes of human skin samples exposed to LDIR and those exposed to HDIR. Our findings are as follows: (1) the molecular response after LDIR involves the up-regulation of the immune response by the secretion of immune-related cytokines; (2) “antigen presentation and processing” is the GO term with the greatest difference between the LDIR and HDIR transcriptomes; and (3) the
down-regulation of EP300 caused by LDIR could lead to an inhibition of cancer development through anti-tumor immunity. These results provide a better understanding of the risks of using LDIR in the clinical setting and specifically highlight its effects on the human immune system.
ACKNOWLEDGEMENT
This work was supported by the National Research Foundation of Korea (NRF) grant funded by the Korea government (MSIP) (2009-0083538). In addition, this work was supported by the National Research Foundation of Korea Grant funded by the Korea Government (NRF-2015M3A9B8029074). The authors are grateful to the Aging Tissue Bank (Busan, Korea) for supplying the research informations used in this work.
Conflicts of interest: Declared none.
REFERENCES
1. Huang L, Snyder AR, Morgan WF (2003) Radiation-induced genomic instability and its implications for radiation car-cinogenesis. Oncogene, 22(37): 5848-5854.
2. Little J (1998) Radiation-induced genomic instability. Int J Radiat Biol, 74(6): 663-671.
3. Wall B, Kendall G, Edwards A, Bouffler S, Muirhead C, Meara J (2014) What are the risks from medical X-rays and other low dose radiation? The British Journal of Radiology. 4. Hoffmann G and Stempsey W (2008) The hormesis
con-cept and risk assessment: are there unique ethical and policy considerations? Human & Experimental Toxicology,
27(8): 613-620.
5. Matsumoto H, Tomita M, Otsuka K, Hatashita M (2009) A new paradigm in radioadaptive response developing from microbeam research. Journal of Radiation Research, 50
(Suppl A): A67-A79.
6. Lorimore SA, Coates PJ, Wright EG (2003) Radiation
-induced genomic instability and bystander effects: inter
-related nontargeted effects of exposure to ionizing radia-tion. Oncogene, 22(45):7058-7069.
7. Moskalev A, Plyusnina E, Shaposhnikov M (2011) Radiation hormesis and radioadaptive response in Drosophila mela-nogaster flies with different genetic backgrounds: the role
of cellular stress-resistance mechanisms. Biogerontology ,
12(3): 253-263.
8. Seong KM, Kim CS, Seo S-W, Jeon HY, Lee B-S, Nam SY, Yang KH, Kim J-Y, Kim CS, Min K-J (2011) Genome-wide analysis of low-dose irradiated male Drosophila melano-gaster with extended longevity. Biogerontology, 12(2): 93-107.
9. Shin SC, Lee KM, Kang YM, Kim K, Lim SA, Yang KH, Kim JY, Nam SY, Kim HS (2011) Differential expression of immune
-associated cancer regulatory genes in low-versus high
-dose-rate irradiated AKR/J mice. Genomics, 97(6): 358-363.
10.Micke O, Seegenschmiedt MH, Diseases GCGoRfB (2004) Radiotherapy in painful heel spurs (plantar fasciitis)— results of a national patterns of care study. Int J Radiat Oncol Biol Phys,58(3): 828-843.
11.Niewald M, Fleckenstein J, Naumann S, Ruebe C (2007) Long-term results of radiotherapy for periarthritis of the shoulder: a retrospective evaluation. Radiat Oncol, 2: 34. 12.Adamietz B, Schulz-Wendtland R, Alibek S, Uder M, Sauer
R, Ott O, Keilholz L (2010) Calcifying Tendonitis of the Shoulder Joint. Strahlentherapie und Onkologie, 186(1): 18 -23.
13.Ina Y and Sakai K (2005) Activation of immunological net-work by chronic low-dose-rate irradiation in wild-type mouse strains: analysis of immune cell populations and surface molecules. Int J Radiat Biol, 81(10): 721-729. 14.Rödel F, Kamprad F, Sauer R, Hildebrandt G (2002)
Func-tional and molecular aspects of anti-inflammatory effects of low-dose radiotherapy. Strahlentherapie und Onkolo-gie, 178(1): 1-9.
15.Ma S, Liu X, Jiao B, Yang Y, Liu X (2010) Low-dose radiation
-induced responses: focusing on epigenetic regulation. Int J Radiat Biol,86(7): 517-528.
16.Rodel F, Frey B, Gaipl U, Keilholz L, Fournier C, Manda K, Schollnberger H, Hildebrandt G, Rodel C (2012) Modula-tion of inflammatory immune reacModula-tions by low-dose ioniz-ing radiation: molecular mechanisms and clinical applica-tion. Current Medicinal Chemistry, 19(12): 1741-1750. 17.Fruzangohar M, Ebrahimie E, Ogunniyi AD, Mahdi LK,
Pa-ton JC, Adelson DL (2013) Comparative GO: a web applica-tion for comparative gene ontology and gene ontology
-based gene selection in bacteria. PloS one, 8(3): e58759. 18.Newman ME (2005) A measure of betweenness centrality
based on random walks. Social Networks, 27(1): 39-54. 19.Saeed A, Sharov V, White J, Li J, Liang W, Bhagabati N,
Braisted J, Klapa M, Currier T, Thiagarajan M (2003) TM4: a free, open-source system for microarray data manage-ment and analysis. Biotechniques, 34(2):374.
20.Hildebrandt G, Radlingmayr A, Rosenthal S, Rothe R, Jahns J, Hindemith M, Rödel F, Kamprad F (2003) Low-dose radi-otherapy (LD-RT) and the modulation of iNOS expression in adjuvant-induced arthritis in rats. Int J Radiat Biol, 79
(12): 993-1001.
21.Seegenschmiedt MH, Micke O, Willich N (2004) Radiation therapy for nonmalignant diseases in Germany. Strahlen-therapie und Onkologie, 180(11): 718-730.
22
22.Heyd R, Tselis N, Ackermann H, Röddiger SJ, Zamboglou N (2007) Radiation therapy for painful heel spurs. Strahlen-therapie und Onkologie, 183(1): 3-9.
23.Hildebrandt JJ, Hindemith M, Spranger S, Sack U, Kinne RW, Madaj-Sterba P, Wolf U, Kamprad FG (2000) Effects of low dose radiation therapy on adjuvant induced arthritis in rats. Int J Radiat Biol, 76(8): 1143-1153.
24.Lugade AA, Moran JP, Gerber SA, Rose RC, Frelinger JG, Lord EM (2005) Local radiation therapy of B16 melanoma tumors increases the generation of tumor antigen-specific effector cells that traffic to the tumor. The Journal of Im-munology, 174(12): 7516-7523.
25.D'Ambrosio D, Panina-Bordignon P, Sinigaglia F (2003) Chemokine receptors in inflammation: an overview. Jour-nal of Immunological Methods, 273(1): 3-13.
26.Rossi D and Zlotnik A (2000) The biology of chemokines and their receptors. Annual Review of Immunology, 18(1): 217-242.
27.Fujimori A, Okayasu R, Ishihara H, Yoshida S, Eguchi-Kasai K, Nojima K, Ebisawa S, Takahashi S (2005) Extremely low dose ionizing radiation up-regulates CXC chemokines in normal human fibroblasts. Cancer Research, 65(22): 10159
-10163.
28.Hosoi Y, Miyachi H, Matsumoto Y, Enomoto A, Nakagawa K, Suzuki N, Ono T (2001) Induction of interleukin-1β and interleukin-6 mRNA by low doses of ionizing radiation in macrophages. International Journal of Cancer, 96(5): 270-276.
29.Shanmugham L, Petrarca C, Frydas S, Donelan J, Castellani M, Boucher W, Madhappan B, Tete S, Falasca K, Conti P (2006) IL-15 an immunoregulatory and anti-cancer cyto-kine. Recent advances. Journal of Experimental & Clinical Cancer Research: CR, 25(4): 529-536.
30.Van Roon J, Glaudemans K, Bijlsma J, Lafeber F (2003) Interleukin 7 stimulates tumour necrosis factor α and Th1 cytokine production in joints of patients with rheumatoid arthritis. Annals of the Rheumatic Diseases, 62(2): 113-119.
31.Steidl C, Shah SP, Woolcock BW, Rui L, Kawahara M, Farinha P, Johnson NA, Zhao Y, Telenius A, Neriah SB (2011) MHC class II transactivator CIITA is a recurrent gene
fusion partner in lymphoid cancers. Nature, 471(7338): 377-381.
32.Poschke I, Mougiakakos D, Kiessling R (2011) Camouflage and sabotage: tumor escape from the immune system.
Cancer Immunology, Immunotherapy, 60(8): 1161-1171. 33.Corthay A, Skovseth DK, Lundin KU, Røsjø E, Omholt H,
Hofgaard PO, Haraldsen G, Bogen B (2005) Primary anti-tumor immune response mediated by CD4+ T cells. Im-munity, 22(3): 371-383.
34.Nakanishi Y, Lu B, Gerard C, Iwasaki A (2009) CD8+ T lym-phocyte mobilization to virus-infected tissue requires CD4+ T-cell help. Nature, 462(7272): 510-513.
35.Yu Y and Feng YM (2010) The role of kinesin family pro-teins in tumorigenesis and progression. Cancer, 116(22): 5150-5160.
36.Rath O and Kozielski F (2012) Kinesins and cancer. Nature Reviews Cancer, 12(8): 527-539.
37.Huszar D, Theoclitou ME, Skolnik J, Herbst R (2009) Kinesin motor proteins as targets for cancer therapy. Cancer and Metastasis Reviews, 28(1-2): 197-208.
38.Quezada SA and Peggs KS (2011) Tumor-reactive CD4+ T cells: plasticity beyond helper and regulatory activities.
Immunotherapy,3(8): 915-917.
39.Chan HM and La Thangue NB (2001) p300/CBP proteins: HATs for transcriptional bridges and scaffolds. Journal of Cell Science, 114(13): 2363-2373.
40.Goodman RH and Smolik S (2000) CBP/p300 in cell growth, transformation, and development. Genes & Development,
14(13): 1553-1577.
41.Liu Y, Wang L, Predina J, Han R, Beier UH, Wang L-CS, Ka-poor V, Bhatti TR, Akimova T, Singhal S (2013) Inhibition of p300 impairs Foxp3+ T regulatory cell function and pro-motes antitumor immunity. Nature Medicine, 19(9): 1173-1177.
42.Pietrocola F, Pol J, Vacchelli E, Rao S, Enot DP, Baracco EE, Levesque S, Castoldi F, Jacquelot N, Yamazaki T (2016) Caloric restriction mimetics enhance anticancer immuno-surveillance. Cancer Cell, 30(1): 147-160.
43.Mariño G, Pietrocola F, Eisenberg T, Kong Y, Malik SA, Andryushkova A, Schroeder S, Pendl T, Harger A, Niso
-Santano M (2014) Regulation of autophagy by cytosolic acetyl-coenzyme A. Molecular Cell, 53(5): 710-725.