Alison M. Shields. Current Priorities and Future Directions: A Content Analysis of Active Strategic Planning Goals of Public Libraries in the United States. A Master’s Paper for the M.S. in L.S degree. November, 2007. 71 pages.Advisor: Paul Solomon
A strategic plan articulates an organization’s strategy for coping with future change. This study is a content analysis of the goals in 100 active strategic plans from public libraries in the United States. The results show that priorities in the present and in the near future of the public libraries are, in order of importance: providing the services and resources that meet patron needs, infrastructure maintenance and improvement, outreach to community groups and individuals, encouraging lifelong learning and recreation for all ages, becoming an information lifeline for the community, and meeting the needs of underserved populations. Chi-square analysis was also performed to identify associations between the prevalence of a given goal type and community demographic variables. The results provide insight into these libraries’ priorities for serving patrons now and in the near future.
Headings:
Strategic planning
Public libraries—Strategic planning
UNITED STATES
by
Alison M. Shields
A Master’s paper submitted to the faculty of the School of Information and Library Science of the University of North Carolina at Chapel Hill
in partial fulfillment of the requirements for the degree of Master of Science in
LibraryScience.
Chapel Hill, North Carolina
November 2007
Approved by
Table of Contents
Introduction ...3
Literature Review...5
Methodology ...15
Results ...18
Discussion ...42
Further Research ...46
Conclusion ...47
References ...49
Appendix A. Libraries, Plan Dates, Locations, and Plan Websites ...53
Appendix B. Factor Loadings for Goal Clusters (Principal Components Analysis) ....57
Appendix C. Library Demographics for Total Population of Communities Served ....58
Appendix D. Library Demographics for Median Age of Communities Served ...61
Appendix E. Library Demographics for Diversity of Community Served ...64
List of Tables and Figures
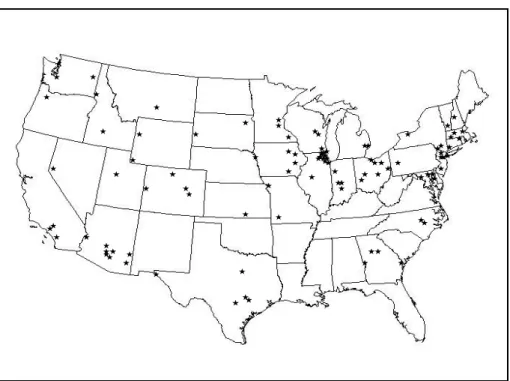
Figure 1: Geographic Distribution of Libraries ...18
Table 1: Frequency of Goal Types ...20
Table 2: Goal Clusters ...30
Figure 2: Frequency of Goal Clusters ...32
Figure 3: Proportion of Library Plans Containing Goal in Cluster, by Size of Community ...34
Table 3: Proportion of Library Plans Containing Goal, by Size of Community ...35
Figure 4: Proportion of Library Plans Containing Goal in Cluster, by Median Age ....36
Table 4: Proportion of Library Plans Containing Goal, by Median Age ...37
Figure 5: Proportion of Library Plans Containing Goal in Cluster, by Community Diversity ...39
Table 5: Proportion of Library Plans Containing Goal, by Community Diversity ...40
Figure 6: Proportion of Library Plans Containing Goal in Cluster, by Per Capita Income...41
Introduction
As librarian Milo Nelson noted in his 1984 critique of ALA’s strategic planning
initiative, “Since the time that frontiersmen mounted trees in eighteenth-century America
to gain a keener appreciation of the geography ahead, it has been a singularly American
habit to attempt to see beyond the present” (p. 1). We are very future-oriented in this
country, Nelson continues. The very hallmark of maturity, he says, is the ability to plan;
therefore, individuals buy cemetery plots and life insurance, check the weather forecast,
and carry a calendar.
The desire to control and predict not only what is, but what is to come, can also be
observed in organizations, when leaders engage in strategic planning. Strategic planning
is a formalized process that helps an organization identify priorities and set appropriate
goals, based on where it is and where it is going. Indeed, public library leaders frequently
use strategic planning as a way to “climb trees,” that is, to predict and chart courses into
the future. In today’s climate of constant change, especially, information professionals
feel compelled to predict and control the future as much as possible. Librarians for
several decades have watched changing trends—technological and otherwise—influence
and even at times threaten the practice of librarianship (Herring, 2001). Despite Nelson’s
somewhat cynical tone on the subject, strategic planning can help libraries prepare to
cope with changes, challenges, and innovations. It has been embraced as a way to help
libraries control their future impact on communities and survive and flourish (Jacob,
The strategic planning process is important because it identifies community
values and priorities. A strategic plan based on an understanding of community values
helps library leaders make appropriate budget decisions. Setting budgetary priorities can
be a difficult task for library managers; however, successful management depends on the
ability to develop acceptable goals within the value framework of the community served,
acquire the necessary resources to support the goals, and continue to refine the goals and
adjust resources as needed (Jacob, 1990, p. 86). Strategic planning allows libraries to
adjust for changing community values over time, as managers reassess past budgetary
practices, based on a better understanding of community trends, the past roles of the
institution in the community, and the desired future roles for the institution.
Many libraries have made their current, approved strategic plans public online.
Published plans are typically active for three to five years. The content of the plans vary,
but many contain library mission statements, vision statements, history of the library,
community demographics, budgetary reviews, and a description of the process by which
the strategic plan was conceived. The element common to all plans is a list of strategic
goals (where a library wants to be) and objectives (how it is going to get there).
Strategic goals are concise statements that summarize the intentions of a library.
Goals represent the commonly shared values, desires, and ambitions of a library’s staff,
administration, and patrons, but, most of all, they describe what a library plans to do.
They often begin with words such as “improve,” “ensure,” or “increase.” By looking at
the strategic goals of a library, one can get a sense of what that library sees as important
As library planners look at levels of patron satisfaction, assess community needs,
gather ideas for innovation, and find areas in which to improve, they are able to develop
goals for achieving their desired future. This research examines goals from currently
active strategic plans of public libraries in the United States. Plans available in the public
domain were identified and their goals were compiled and compared. Identification of
common priorities in the strategic goals provides a glimpse into which areas of library
operations and services are of greatest concern to public library professionals,
paraprofessionals, and patrons. The analysis, therefore, provides insight into the current
priorities of these public libraries and their plans to solve problems, allocate funding, and
ultimately improve services for their communities currently and in the future. Further
analysis sought to identify associations between strategic goals and the demographic
composition of the communities in which the libraries operate. Finally, a distribution of
those libraries that have both engaged in strategic planning recently and made their plans
available online is presented. This study paints a picture of the effect that strategic
planning is likely to have on these libraries and their communities in the coming years by
describing key goal areas identified by libraries through the strategic planning process.
Literature Review
Definitions and Beginnings of Strategic Planning
David Ewing reflects, in the 1972 of edition of Long Range Planning for
Management, that as he set out to write the first edition of the book two decades earlier,
he found himself almost completely alone in his serious, scholarly consideration of
become a main interest of academic research and business management. Business
journals, management teachers and students, big business, small companies, government
organizations, and even churches had become preoccupied with planning (Ewing, p.
ix-x). Among the influential publications was Igor Ansoff’s Corporate Strategy, published
in 1965. Corporate Strategy combined the concepts of management and strategy (Ansoff,
1965, p. vii), and is the best-known early strategic planning book (Mintzberg, 1994b, p.
39).
Strategic planning is a form of long-range planning. The terms “strategic
planning” and “long-range planning” are often used interchangeably; however, a slight
distinction can be made based on assumed environment: strategic planning generally
anticipates a changing, dynamic environment, while long-range planning sets out to
accomplish goals under the assumption that the environment will remain stable over the
duration of the plan (What is strategic planning?, 2004). Furthermore, strategic planning
can be defined as “a formalized procedure” meant “to produce an articulated result in the
form of an integrated system of decisions” (Mintzberg, 1994b, p. 7-19). Put simply,
strategic planning is a system-wide determination of “where an organization is going over
the next year or more and how it's going to get there” (McNamara, 2007). Strategic
planning had become very popular by 1973, when Louis Gerstner wrote: “Except for the
so-called computer revolution, few management techniques have swept through corporate
and governmental enterprises more rapidly or completely.”
Administrators expect the strategic planning process to help them control the
variable future because it helps them analyze their situation rationally, clarify their goals,
7-19). Managers hope that having a strategic plan will reduce the potential for “panic
reactions” in unforeseen circumstances (Boyne, 2001).
History of Differing Views in Strategic Planning
Varying opinions regarding strategic planning began to emerge almost as soon as
the concept became popular (Gerstner Jr., 1973). In the sixties and seventies, the merits
of “rational” planning were debated against the merits of just “muddling through”
(Boyne, 2001). In 1978, Paul and Donovan credited the rapid acceptance of strategic
planning to its conceptual simplicity and intuitive appeal, but warned that accurate
long-term forecasts of the future are almost always impossible to make, and companies that
base day-to-day managerial procedures on such forecasts are dooming themselves to
failure. Henry Mintzberg published a two-part article in Long Range Planning in which
he claimed that the term “strategic planning” is an oxymoron—because the act of
planning itself might generate climates hostile to strategy making (Mintzberg, 1994a).
George Boyne (2001) narrows the critiques of planning to two areas: the possible
technical problems (intellectual limitations of planners, for example), and the potential
political difficulties that arise when change is mandated by those in power. Boyne
examines the data provided by numerous empirical studies that have been published on
the topic. In a comprehensive meta-analysis of the available empirical studies, generally
done in the private sector, Boyne examines the link between planning and commercial
success. He finds a statistically significant relationship between strategic planning and
measures of commercial success, such as profitability, market share, and sales growth.
The “mean level of support for the positive impact of planning” was 55 percent (p. 79).
goes much further to say that organizations with continuous, integrated, long-term
strategies outperform contemporaries by 1500 percent (Isom-Rodriguez, 2005).
This contrasts with the conclusion of another meta-analysis published ten years
earlier by Brian Boyd, who found the average effect of strategic planning on financial
success measures (such as profitability, return on assets) to be only slightly positive, with
some studies even reporting a negative effect. Boyd points out, however, that several
individual firms have reported great benefits as a result of planning (Boyd, 1991).
Although the discussion about the utility of strategic planning continues
(Mintzberg, Ahlstrand, & Lampel, 2005, p. 2), it has gained general acceptance as a managerial tool. Lucy Kellaway lately promoted strategic planning as an approach to
weight loss, though perhaps metaphorically: “…every CEO needs a plan—Bill Gates
needed a business plan to build Microsoft and we need one to lose weight” (Kellaway,
2005). Henry Mintzberg, despite his two-part article questioning the value of strategic
planning (Mintzberg, 1994a), never advocated complete abandonment of the concept; he
advocated a more informal approach to planning and awareness of the situational
appropriateness of strategy formation (Mintzberg, 1994b, p. 416). In addition, he helped
to author a collection of essays, criticizing planning for being boring and promoting
better and more interesting planning (Mintzberg, Ahlstrand, & Lampel, 2005, p. 2).
The Process of Strategic Planning
Strategic planning is a detailed, involved process and usually requires many hours
of work (Gerstner Jr., 1973). Organizations usually start by conducting a SWOT analysis
(determining an organization's Strengths and Weaknesses in relation to the external
environment as well as the organization itself (Dougherty, 2002). Strategic plans are
strongest when they are based on an understanding of the organization at all levels. The
planning process can be overseen by internal management or by external consultants, but
all staff should be involved on some level in order to ensure a shared vision (Dougherty,
2002). Using this information, the strategic plan—a description of how the organization
is going to get from its present position to its future desired position—is drafted (Gerstner
Jr., 1973).
Strategic planning in a library is a complex process as well. A step-by-step model
for the strategic planning process in public libraries is available in a manual written by M.
E. L. Jacob (1990). One of the first steps for managers and planners is the appointment of
a core planning team. This team takes responsibility for assigning task forces to complete
specific duties within the planning process (p. 15). Managers must also establish a budget
and schedule for planning (p. 22), present to staff a brief overview of what to anticipate
(p. 20), gather data from the community (p. 21), establish objectives for the planning
process itself (p. 20), and gather broad input from all those who are affected by the
strategic planning process (p. 23). A library’s past and present roles are carefully
analyzed, (p. 13) along with its environment, a process called “environmental scanning.”
Environmental scanning is a critical part of the process, where managers and planners
identify environmental trends affecting the library and the library’s place in the
environment in order to understand the strengths and weaknesses, threats to success, and
opportunities for change and growth (p. 59). Input from advisory committees, such as
This approach should result in the identification of a possible and most likely future (p.
60).
After planners have gathered and analyzed this information, they can draft the
plan by developing the following: a vision and a mission for the organization, goals and
objectives to support the vision and mission, and schedules and resource allocations for
achieving the goals (Jacob, 1990, p. 61-87). The plan must be published and
communicated to a primary audience identified by the organization (p. 89-99). After the
plan is published, the goals are implemented and later evaluated in terms of the broad
vision (p. 101). Finally, planners must incorporate a mechanism for continual evaluation
of the plan and its impact on the environment (p. 105). Managers must remain aware of
the library’s progress and changes in the environment that will affect the mission and
goals. Monitoring helps ensure the success of the plan; as Jacob concludes, “Planning
without monitoring is wishful thinking, not true planning” (p. 105).
The Durham County Library of North Carolina provides an example of the role of
environmental scanning and other research in the strategic planning process. Before
drafting the plan, library management (with the help of consultants) generated a wealth of
ideas through several different forums—staff meetings, community bus trips to other
libraries, and a future search conference, in which a cross-section of the community was
consulted. A wiki was created for the community to share ideas. Thorough analysis of
data gathered from these modalities gave library leadership the information needed to
understand the climate and desires of the community. Four key goals were identified
from re-analysis of the data, administrative discussion, and community and staff input.
service, more family literacy, better IT resources, and the preservation of Durham’s
cultural heritage (DCL strategic plan wiki, 2007).
Strategic Planning in Professional Library Organizations
Organizations such as the American Library Association have been employing
planning processes since the late sixties (Jacob, 1990, p. 4), and the debate about the
benefits of strategic planning is present in the library literature. A recent article featured
on ALA’s website on strategic planning in the field, by Gordon Aamot, begins
pessimistically:
Strategic planning is viewed by some with skepticism and even trepidation. It not only requires a significant amount of organizational time and energy, but the relationship between the planning process and the creation of new strategies is not always apparent. When used thoughtlessly, obsessively, or with excessive formality it can drive out precisely the kind of strategic thinking, acting, and learning it was supposed to promote (2007, p. 1).
This echoes the ideas of critic Henry Mintzberg’s, especially the critiques of what
he saw as the extreme formality of strategic planning (Mintzberg, Ahlstrand, & Lampel,
2005, p. 2). However, Aamot’s main point is that strategic planning has great potential to
promote “strategic thinking” in a library system—strategic thinking being characterized
as “synthetic,” “iterative,” “divergent,” and “creative” (2007).
A proponent of strategic planning is Lachance, “For library and information
associations to create a healthy future they must devise flexible and forward-looking
strategies that connect the individual member with goals of the organization” (2006).It
was said in another way more than a decade earlier by Sutton: “planners transform
features of a complex social organization into a model that gives the organization a shape
In 1984, librarian Milo Nelson questioned the need for ALA to use fifteen staff
members, outside consultants, and $80,000 on a strategic plan: “Mice and men not only
make plans that oftentimes go astray, they often go astray in the making of plans. In the
absence of a compelling need for a long-range plan, the best plan might be not to
undertake a plan” (Nelson, 1984).
Despite Nelson, the ALA created its plan, and continues to engage in strategic
planning. The current plan, created two years ago, is entitled “ALAhead to 2010”
(ALAhead to 2010: Strategic plan, 2005). It includes statements on the founding purpose
of ALA, a mission statement, a vision statement, key action areas, and six broad goals
accompanied by more specific objectives. It also includes an appendix with two sections:
“Desired Future” and “Organizational Values.” Many organizations within ALA have
published their own strategic plans as well, including the Association for Library Service
to Children (ALSC strategic plan, 2006-2011: Core ideology & envisioned future, 2006),
the Association of College and Research Libraries (Charting our future: ACRL strategic
plan 2020, 2006), the Public Library Association (Tecker Consultants, 2005), and even
the ALA Public Programs Office (ALA Public Programs Office strategic plan January
2002--January 2006, 2002). Like the general ALA plan, most include introductory
information such as a value statement, a core purpose, a statement of vision, etc., but the
most common element is a list of stated goals, with accompanying objectives or
strategies.
Strategic Planning in Libraries
Since today’s libraries are heavily influenced by many rapidly changing trends, it
technological changes (Balasubramanian, Rangaswamy, & Kanthimathi, 2006) and the
aging generation of Baby Boomers (Joseph, 2006).
Change is anticipated by all kinds of libraries. Public libraries, for example, are
becoming social meeting places and hubs of technology and communication, are in need
of more space, are developing relationships with higher-education facilities, and are
changing their architecture to accommodate these and many other functional changes
(Focke, 1997).It is hard to forecast trends, and which trends will endure and which will
not (Schachter, 2007). Since it can seem intuitive that planning can help organizations to
accommodate and prepare for future changes, it may be surprising that one writer
advocates less planning in the face of change. Although she acknowledges that “acute
discontinuities in trends are occurring…causing businesses to experience jarring,
large-scale shifts in orientation and practice,” she says that planning will only bog information
organizations down in the face of this continual whitewater (Lettis, 1998).
Debbie Schachter would agree that we live in a turbulent, changing environment.
She points out the life cycle of ideas is shrinking; however, contrary to Lettis, she argues
that organizations need to be cautious about jumping on emerging trends “without careful
analysis of their true value” (2007). If she is right, then libraries without plans may be in
danger of being drawn in too many directions. Balas believes that libraries need to write
clear mission statements in order to maintain organizational identity in the face of change
(Balas, 2007). Mark Herring argues that without planning, librarians will continue to
stand still while change slowly puts them out of jobs. He urges libraries to start planning
their own futures before other organizations (big businesses, etc.) plan their futures for
kind of data to collect and how to collect it, information professionals must be clear about
their libraries’ purposes, goals, and strategic initiatives. (2005)
Many library managers seem to agree that planning is a productive way to spend
money and time, because so many of them have created strategic plans. The majority of
the literature seems to suggest that information professionals believe the strategic
planning process will be helpful for libraries. Perry and Woodsworth even contend that
libraries can do strategic planning better than the corporate world. Libraries, they say,
have an advantage over the private sector because library employees tend to be
comfortable in a cooperative environment, which promotes discussion towards a
consensus, which then contributes to a more open environment where shared missions,
values, and visions can be created (1995).
The success stories, of course, speak for themselves. Two examples are the
Linebaugh Library System, which received a School Library Journal/Thomson Gale
Giant Step award for its service to youth (Kenney, 2006), and the Ann Arbor District
Library, which became Library Journal’s 1997 Library of the Year (Dougherty, 2002).
Both libraries thank strategic planning for their accomplishments.
In summary, the literature seems to make a strong case for the ability of strategic
planning to help organizations identify priorities and plan for and adjust to an
ever-changing environment. This study, therefore, recognizes strategic plans as a source by
which to identify the current needs, priorities, and changes that public libraries are
currently addressing across the United States. It attempts to answer the questions (to use
some of the words of Sutton and Lachance), “What shape and meaning are public library
strategies are public library professionals initiating in an effort to create healthy futures
for their organizations?”
Methodology
Strategic plans published online were identified via a systematic search process
using Google (www.google.com). Initial searches confirmed that dozens of libraries have
completed a strategic planning process and published their strategic plans online. To
identify plans from public libraries in the United States, fifty-one searches were
systematically run for each state and the District of Columbia using the combined search
terms “name of state” (and) “strategic plan” (and) “public library.” Results of each
search were culled to eliminate retrieved items, which were entirely irrelevant or
redundant, or had nothing to do with strategic planning. Inclusion criteria for the strategic
plans were as follows: origination from a public library (single library or community
library system) in the United States, publication in on-line format, current as of 2007 or
later, and clear identification as a strategic plan from the title of the plan or Webpage.
Exclusion criteria included plans for academic libraries, state libraries, and public library
cooperatives, associations, networks, or advocacies; format with security measures
prohibiting copying and pasting; plans with an end date earlier than January, 2007; and
plans unavailable online.
In all, 100 plans from thirty-five states met the inclusion and exclusion criteria
and were included in the analysis. The text of the goals and objectives from these 100
plans formed the body of data for analysis. One plan with security measures prohibiting
excluded. All plans that were clearly active were included, as well as two library plans
that were undated: the Tacoma, WA and Tripoli, IA Public Libraries. These two plans
were included to bring the total number of plans to a round number.
A list of strategic goals was the only element found universally in all plans.
Furthermore, goals were action-oriented and representative of what a library was
specifically working on, or planning to work on—presumably representative of
organizational transformation and priorities. Therefore, goals were recognized as the
most appropriate element to analyze. Goals were identified by the presence of the
following headings: “goals” or “strategic initiatives.” The goals were analyzed using
MAXQDA2007 for Windows (VERBI software, 2007), content analysis software which
supports coding. Based on the priority areas identified in the goals, goals were assigned
codes representing the concept with which the goal was most closely associated.
A system to assign codes based on the main areas of interest of the goals was
needed. This system was developed via a two-phase content analysis process. In the first
phase, goals were read and given tentative classifications based on their main ideas or
objectives. As the number of goals classified increased, it became clear that some
classifications were redundant and needed to be combined, whereas others needed to be
separated. By the time all goals were read and given tentative classifications,
twenty-three distinct codes had emerged that adequately and uniquely described the main ideas
of the goals. In the second phase of content analysis, each goal was revisited and assigned
to at least one of the twenty-three codes. Frequency distributions for each code were
strategic goals. Finally, factor analysis was performed to identify clusters of related goal
codes.
Two special situations encountered during the coding process necessitate
explanation. First, some goals were compound and clearly contained more than one main
idea. In these cases, the goal was assigned more than one code. Therefore, while each
plan had at least two goals, the number of total codes found in the strategic goals of a
plan was sometimes greater than the number of total goals. Second, many strategic plans
include a list of objectives, best described as the specific actions a library plans to take to
reach its goals, to accompany the list of goals. Objectives were listed following the goals
and provided a fleshed-out explanation of the action and evaluation initiatives of each
goal. Although goals were the unit of analysis, objectives were used to clarify the
meaning and intent of the goal for goal coding purposes. On occasion, an objective would
be directed tangentially to the main idea of the goal. In these cases, no additional code
designations were made, but reference to these objectives is made in the descriptions of
the twenty-three code areas below. By this method, goal codes were assigned based on
key ideas explicitly stated in the goal text, with objectives providing supporting
information.
To obtain demographic data, the physical location of each library was determined
either through the community government site or through the mailing address of the
library. Demographics variables included population, racial composition, median age,
and per-capita income. Data was accessed through the U.S. Census Bureau Website (U.S.
Census Bureau, 2000) and compiled. Gathering data from one place—the Census 2000—
associations between library service population demographic variables and the presence
or absence of specific goal codes and goal code clusters.
Statistical analysis of data was performed using SPSS 16.0 for Windows (SPSS,
Inc., 2007). Frequency distributions are presented, along with results from bivariate
analysis. Statistical significance was based on the Chi-square test. Tests of significance
were two-tailed, with significance based on the 0.05 level.
Results
Libraries
Plans were gathered from 100 libraries (see Appendix A). The geographic distribution of
the libraries can be seen below in Figure 1. Each star represents a library. Geographic
clustering occurred in some regions, especially in the Chicago area in northeastern
Illinois, which had ten libraries with plans, or 10 percent of total plans.
Types of Goals
A casual perusal of the list of goals in a strategic plan would show that goals are
directed towards specific areas of interest, for example, goals may be related to children’s
services, staffing, or outreach. The coding system outlined in the methods section
represents a systematic way of classifying a goals’ area of interest. Content analysis of
the goals identified twenty-three primary areas of interest. These represent the current
priorities for change and improvement of public libraries.
As stated in the methods section, some goals were related to more than one of the
main topic areas. In these cases, goals were assigned more than one code. For example,
the Chattahoochee Valley (GA) Regional Library’s third goal was “Adults will have
access to materials and services to improve their ability to read, write, and speak
English.” This goal was assigned to both the “Services for Adults” and “Literacy” codes.
The Pawtucket (RI) Public Library had as its second goal, “To raise community
awareness and improve access to library services.” This goal was two-fold and received
the codes “access” and “promotion.” Another example of can be found in the Multnomah
County (OR) Library Strategic Plan’s first goal: “People of all ages and backgrounds will
find welcoming, inviting neighborhood spaces where they can interact with others and
participate in public discussion.” Based on its emphasis on “spaces” as well on “public
discussion,” this goal received the codes “facilities/environment” as well as “information
destination/gathering place.”
The codes are presented in Table 1. They are defined below and are listed in order
accompanied by lists of objectives, these objectives were reviewed for supporting
information, which is also included below.
Table 1: Frequency of Goal Types
Goal Types % of
libraries
rank
Collections/Resources 61% 1
Facilities/Environment 59% 2
Marketing/Promotion 48% 3
Programming/Outreach 47% 4
Technology 47% 4
Access/Use 45% 6
Staff/Training 44% 7
Customer Service 42% 8
Finances/Funding/Advocacy 41% 9
Information Destination/Gathering Place 41% 9
Support Education 41% 9
Collaboration/Partnerships 29% 12
Language and Information Literacy 26% 13 Services: Children 25% 14 Support Recreation 25% 14
Community 24% 16
Diversity/Culture 22% 17
Services: Teens 16% 18
Continued Evaluation/Change 15% 19 Support Career/Life Events 12% 20
Services: Adults 11% 21
Stewardship of the Public Trust 9% 22
Services: Seniors 6% 23
1. Collections/Resources: found in 61 percent of plans.
The most commonly identified goals related to library collections—resources
available for public use, including books, periodicals, audio-visual items, and electronic
resources. Specific objectives described plans to increase the size of library collections
and improve the quality of resources offered by the library. Less commonly mentioned
collection, increasing holdings in specific collections (such as foreign language, online,
and audio-visual), and collaborating with other libraries to increase the size of offerings.
2. Facilities/Enviroment: found in 59 percent of plans.
Facilities/environment goals usually included strategies to improve the functional
setup and décor of the library. Plans stated objectives to improve book drops, increase
security, build coffee shops, provide more parking spaces, and hire designers and
architects to improve the functional and visual appeal of their libraries. Less often, but
still frequently, libraries were planning for building construction or remodeling. A
handful of libraries interpreted improving facilities to mean extending their physical
presence into the virtual world by improving remote access to their catalog, such as
through cell phones or PDAs.
3. Marketing/Promotion: found in 48 percent of plans.
Nearly half of public library strategic plans contained goals for promoting the
library with a fresh image. Hancock County (IN) Library, for example, set an interesting
goal to move away from the term “library.” The plan authors wrote that the term did not
adequately communicate the wide array of services available to the public, and planned to
investigate words like “connectivity,” “portal,” and “resource” instead.
Objectives listed with these goals concerned branding, public relations, and
market research. They planned to attract new populations, investigate unique methods of
advertising such as radio and television, improve their Websites, analyze library use
statistics, and generally promote community awareness of the public library and its
4. Programming/Outreach: found in 47 percent of plans.
Another common goal related to programming—library-sponsored activities
aimed to support community education, recreation, or skill development—and outreach,
defined as library-sponsored efforts to promote use of library by populations less likely to
use library resources. Libraries very commonly developed objectives to bring their
programs to as broad a range of participants as possible. Goshen (NY) Public Library’s
second goal of “Reaching out to the community,” for example, had objectives to offer
off-site book clubs, off-site computer instruction, offer outreach to group homes, and to
continue to offer excellent programs for children and their families. Iowa City (IA)
Library’s second goal of “PROGRAMS/SERVICES: Offer high quality programs and
services that reflect community interests and needs” included the objective “Develop and
improve programs and services to reach out to those who cannot or do not come to the
Library.” Many strategic plans also had objectives to expand the topics of their programs
in order to increase participation, and many planned to collaborate with outside groups,
such as business entities, cultural institutions, and schools, in developing programs.
5. Technology: found in 47 percent of plans.
A separate category was created for technology-specific goals, as many plans had
developed specific goals to improve, increase, and expand their technological resources.
For example, the Arkansas City (KS) Library’s fifth goal was to “Provide advanced
computing technology resources and services to the community.” Many libraries had
objectives to provide more computers or Wi-Fi, while others planned to improve their
online offerings such as Website features and databases. Many libraries proposed to train
make the technologies as usable as possible. In addition, some strategic plans, such as the
Youngstown (OH) Library plan, stated objectives to locate technology to improve the
efficiency of library operations.
6. Access/Use: found in 45 percent of plans.
A fair number of libraries set goals to globally increase community utilization of
library resources and programming, such as “Deliver informational resources to all”
(Berkeley Heights, NJ), and “Improve community participation by three (3) to five (5)
percent annually” (Brownburg, IN). Common objectives for these types of goals included
surveying the public to assess needs and wants and measuring library use over a period of
time. In order to attain the desired numbers, libraries sometimes proposed objectives to
improve facilities and services to make the library more usable and convenient and to
target specific populations such as homebound elders or Spanish speakers for services
and marketing.
7. Staff/Training: found in 44 percent of plans
Investing in library staff and volunteers was identified as a high priority in the
goals of many library strategic plans. Objectives stated a need for higher numbers of
diverse, skilled employees with adequate training and good customer-service skills.
Strategies for obtaining excellent staff varied: most wanted to benefit from existing staff
by improving internal recognition and training policies, but some wanted to develop and
improve recruiting to attract new talent.
8. Customer Service: found in 42 percent of plans
Promoting customer service and becoming more helpful to patrons was a
staff to be more welcoming and reference questions to be answered more accurately.
Libraries included plans to train staff in these areas. Improving lending and other policies
was also a common objective, as was conducting research to gauge the level of customer
satisfaction and identify areas for improvement.
9. Finances/Funding/Advocacy: found in 41 percent of plans.
Many strategic plans included goals related to money management. Goals in this
category were diverse, with the majority planning to increase funding and fewer planning
to manage existing funds differently. Funding objectives included improving library
Friends groups and Foundations, engaging in fundraising, and recruiting and training
advocates—especially those who could help bring in funds from private and government
entities.
10. Information Destination/Gathering Place: found in 41 percent of plans.
Many of the libraries had goals to become the information portal for the
community, and also to become a “town square” fixture as a center for public discourse.
An example is the Howe (NH) Public Library’s plan, which included the goal to
“Enhance and expand Howe Library’s role as a community gathering place.” Objectives
included plans to draw people to the library by providing space to support meetings and
supplying information on community issues. Plans also mandated measurement of library
use in this capacity as a center for community involvement and discourse.
11. Support Education: found in 41 percent of plans.
Libraries with education-related goals were interested in enhancing the
intellectual lives of everyone—not just school-aged patrons. “Lifelong learning,” and
goals were: increased collaboration with, and support of, schools and teachers; increased
educational resources, technological and otherwise; and increased educational
programming. Objectives under this goal that showed interest in increasing support of
home schooling were not found very frequently—only in the Oro Valley (AZ),
Tuscarawas (OH), and Wayne County (OH) Libraries.
12. Collaboration/Partnerships: found in 29 percent of plans.
Collaboration goals were focused on developing partnerships with various
institutions in communities—particularly business, educational, and cultural partnerships.
Several of the libraries planned to develop partnerships with other local libraries.
Objectives revealed a hope for improved funding, services, and publicity via these
partnerships, along with an improved ability to reach underserved populations.
13. Language and Information Literacy: found in 26 percent of plans.
Literacy goals in strategic plans were diverse. Goals were coded in the literacy
category if they promoted reading or patrons’ ability to access and evaluate information.
Goals were directed at those who were learning to read, those who were learning to speak
English, those who needed to improve their ability to use computers and technology,
those who needed to learn how to use the library and access and evaluate information
more effectively, and children learning to read. Objectives for improving literacy
included improved literacy programming and services (such as ESL classes), improved
special collections (such as foreign language collections), and improved library usage
14. Services for Children: found in 25 percent of plans.
Some of the libraries had goals directed at specific age groups such as children,
adults, teens, or seniors. The service population most often targeted—by a quarter of the
libraries—was children. Goals were coded in this category if the goal explicitly identified
children as the target service population. In order to better serve children, libraries had
objectives to improve their children’s programming and materials, increase participation
by children in library-sponsored events, and provide support to parents and teachers.
15. Support Recreation: found in 25 percent of libraries.
Goals to support recreation were not as common as goals to support education,
although education and recreation were often mentioned in the same goal and were
therefore often assigned both codes. Goals were assigned the “Support Recreation” code
when they specifically mentioned popular materials, the love of reading, or programs for
leisure and enjoyment or when these materials were predominant in the supporting
objectives. One-quarter of strategic plans contained goals related to supporting recreation.
Objectives related to this goal included plans to purchase more new materials and see
high circulation thereof, and to increase the overall recreational possibilities and
experiences at the library.
16. Community: found in 24 percent of libraries.
Goals about community were goals about local life. The most common type of
“community” goal was to preserve and support local history—mostly through collections
and documents, but also though genealogy resources and programs. For example, the
Austin (TX) Public Library’s fourth goal: “Preserve the collective memory of the Austin
History Center. Other “community” goals were directed toward providing
community-specific information. They included objectives to provide services such as bus schedules
and directories, and support local businesses, government, or community interest groups.
17. Diversity/Culture: found in 22 percent of libraries.
Goals to celebrate diversity and culture were found in libraries that recognized
and promoted cultural diversity as a priority, and addressed the interests of all groups,
especially minority groups, in their communities. The majority of goals in this category
sought to celebrate all cultures and minority groups served by the library. Two goals
related to the arts were included in this category because they spoke about promoting art
from diverse sources to educate and enrich the community. Objectives for achieving this
goal included improving cultural programs, diversifying collections, seeking out a wider
variety of partnerships, hiring more diverse staff and volunteers, and using more
marketing techniques such as handouts and displays about artifacts and books, and
alerting the community of available multicultural resources.
18. Services for Teens: found in 16 percent of libraries.
Teens were the third most frequently targeted service population after children
and minorities, and were often mentioned in conjunction with children. DeKalb County
(GA) Library, however, is a good example of a library that recognized teens as a distinct
group. DeKalb called teens their “greatest resource and largest service challenge” and
expressed concern that non-homework library use declined at age 13 in their system. Like
DeKalb, libraries with teen-oriented goals often included objectives to not only improve
the education and literacy of their teens, but also the recreational reading and program
19. Continued Evaluation/Change: found in 15 percent of libraries.
Although strategic plans are often based on data gathered from surveys,
circulation statistics, and market-based research, most of the libraries did not make
continued data-collection a part of their strategic goals. However, fifteen of the libraries
demonstrated their commitment to gathering data and feedback in the future by setting a
separate goal to do so. Objectives relating to this goal were oriented around assessing
change and planning on an ongoing basis.
20. Support Career/Life Events: found in 12 percent of libraries.
Twelve percent of libraries included goals to support the practical aspects of
patrons’ lives. Goals were coded in this category if they focused on enhancing or
supporting career, marriage, parenting, tax preparation, or other life issues. These goals
most often included objectives to support job-searching and life events by improving
information literacy—equipping patrons with the ability to find career-appropriate
information at the right time. Objectives for this type of goal were similar to the
objectives for goals in support of education and recreation—to improve collections and
programs, and increase the use of resources related to these subjects.
21. Services for Adults: found in 11 percent of libraries.
Strategic goals were coded in this category if they specifically targeted adult
populations. These goals were often discussed in conjunction with children when talking
about family literacy or in response to the need for basic literacy in adults (whether the
adults were new readers or learning English as a second language). Objectives related to
22. Stewardship of the Public Trust: found in 9 percent of libraries.
Some of the libraries stated goals for accountability to their communities and
taxpayers. In the Anoka County (MN) Library’s fifth goal, for example, the authors speak
of being a sustainable, accountable resource for their community, “Sustainability: We
will plan, partner and provide for the future of our libraries.” Common objectives were:
to spend tax dollars wisely, to manage finances in such a way that the library would be
sustainable, to compensate employees fairly, to make sure that facilities are safe for staff
and customers, to follow the law, to engage in best practices, and to conduct surveys in
order to gauge library impact on community life.
23. Services for Seniors: found in 6 percent of libraries.
Only six libraries had goals directly targeting seniors as a service population. The
objectives for serving senior citizens were mainly directed toward improving collections
and services. They also included outreach to home-bound patrons and offering
senior-oriented computer classes.
Factor Analysis of Goals
Factor analysis is an exploratory method used to study the patterns of relationship
among many variables. To understand the relationship between the types of goals
included in library strategic plans, a factor analysis was performed. In the library strategic
plans, priority areas were identified and goals for improvement in those areas were set.
Factor analysis answers the question “how are these priority areas related?” by examining
a correlation matrix between the libraries and their goals. The factors are not a
comprehensive description of the library priorities, but they do identify the areas that
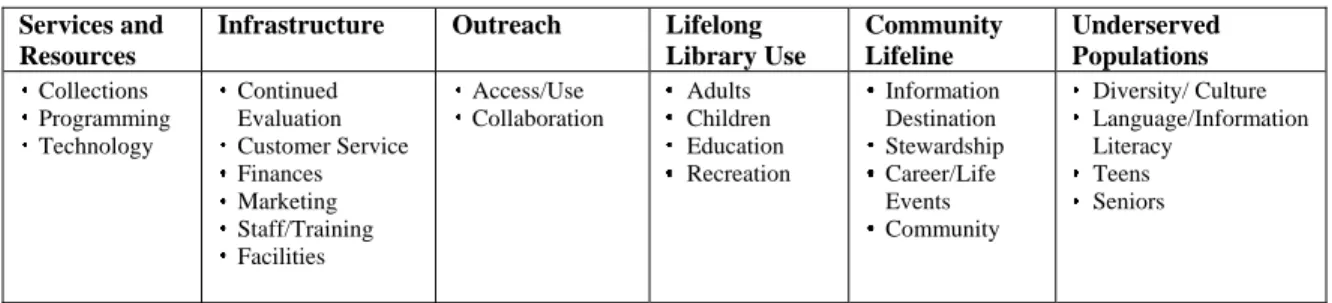
Factor analysis identified six clusters among the twenty-three goal codes, which
were labeled, based on a logical analysis discussed below of covered goals, Services and
Resources, Infrastructure, Outreach, Lifelong Library Use, Community Lifeline, and
Underserved Populations. Factor loadings, which inform the clustering of goals, are listed
in Appendix B. A large factor loading value for a given goal code indicates a higher
degree of correlation with a goal cluster; thus, goal codes were assigned to the goal
cluster within which the factor loading value was largest. The six goal clusters are listed
in Table 2 with their associated goal codes listed underneath and explained below.
Table 2: Goal Clusters Services and
Resources
Infrastructure Outreach Lifelong Library Use Community Lifeline Underserved Populations Collections Programming Technology Continued Evaluation Customer Service Finances Marketing Staff/Training Facilities Access/Use Collaboration Adults Children Education Recreation Information Destination Stewardship Career/Life Events Community Diversity/ Culture Language/Information Literacy Teens Seniors
The first goal cluster contained the goal codes “Collections,” “Programming,” and
“Technology.” These were labeled “Services and Resources,” because they represent
some of the most common services that bring customers to the library. The second goal
cluster contained the goal codes “Continued Evaluation,” “Customer Service,”
“Finances,” “Marketing,” “Staff,” and “Facilities.” These were given the heading
“Infrastructure,” because these goal codes all dealt with building a framework for library
operations including physical facilities, employing qualified staff, using balanced
finances, evaluating continually, and building community awareness through marketing.
The third goal cluster, “Outreach,” contained the goal codes, “Access/Use,” and
community. The fourth goal cluster contained the goal codes “Services for Adults,”
“Services for Children,” “Support Education,” and “Support Recreation.” This cluster
was labeled “Lifelong Library Use,” although “Services to Families” was also considered
as a heading choice. Goals to make the library an “Information Destination,” to “Support
Career and Life Events,” to “Support the Community” (primarily meaning, as defined
above, to preserve the community’s local history), and to have “Stewardship of the
Public’s Trust” were found together and given the heading “Community Lifeline,” as
these goals seemed to demonstrate a desire to become an indispensable part of the
community served. Finally, goals supporting “Diversity,” “Language and Information
Literacy,” “Services for Teens,” and “Services for Seniors” were given the heading
“Underserved Populations,” since groups such as teenagers and speakers of languages
other than English are commonly fewer in number in the community overall, and
sometimes provided with fewer services and resources in United States Public Libraries
than larger customer groups such as children or English-speaking adults.
Figure 2 presents the prevalence of goal clusters in the strategic plans. To
determine which goal clusters were most common, frequency distributions for each goal
code were calculated and the average number of plans that contained a goal in the goal
cluster was calculated. This controlled for the fact that some goal clusters contained more
goal codes than others.
Goals relating to “Services and Resources” were most commonly identified in the
plans at 52.00%. Goals relating to “Infrastructure,” and “Outreach,” were found in
41.50% and 37.00% of strategic plans, respectively. Least commonly found in the plans,
(25.50%)”, “Community Lifeline (21.50%), and “Underserved Populations (17.50%)”
goal clusters.
Figure 2: Frequency of Goal Clusters
Frequency of Goal Clusters
52.00% 41.50% 37.00% 25.50% 21.50% 17.50% 0 0.1 0.2 0.3 0.4 0.5 0.6 Serv ices and Res our ces Infra stru cture Ou trea ch Life long Libr ary U
se Commu nity Life line Unde rser
ved P opu latio ns A ver age % of Li br ar y P lans w ith a G o a l in th e C lu s te r Demographics
In order to elucidate associations between the population characteristics of a
community and the distribution of goals, goal codes were analyzed with respect to
demographic variables. Data for each community served by the libraries with plans
included in the final analysis, as well for the U.S. as a whole, were obtained from 2000
U.S. Census data (U.S. Census Bureau, 2000). Demographic variables selected for
analysis included size of community, median age in community, ethnic diversity, and per
variables were performed using two-tailed Chi-square tests, with results deemed
significant at the 0.05 level and marginally significant at the 0.10 level.
Community Size
Library service communities ranged in size from 1,216 people (Harnett County,
NC) to 2,896,016 (Chicago, IL). The median community size was 57,499 and the mean
community size within the sample was 179,131. In all, thirty-eight of the total libraries
served communities with a population greater than 100,000 people, while sixty-two of the
total libraries served populations less than 100,000 people. (See Appendix C for a
complete listing of each library and the size of the community it serves).
The goal clusters were examined for differences in libraries serving communities
with populations over 100,000 versus those with populations under 100,000 (Figure 3).
There were no significant differences in the percent of plans containing at least one goal
in the libraries serving communities with populations over 100,000 in the area of
“Outreach” (63.1% vs. 53.2%), “Lifelong Library Use” (47.4% vs. 59.7%), “Services and
Resources” (81.6% vs. 82.3%), “Community Lifeline” (63.2% vs. 64.5%), and
“Underserved Populations” (44.7% vs. 41.9%). However, libraries serving communities
with populations over 100,000 had significantly more goals related to the “Infrastructure”
Figure 3: Proportion of Library Plans Containing Goal in Cluster, by Size of Community.
Goal Clusters According to Population Size
0 20 40 60 80 100 120 Outre ach Infras truc ture Life long Libr ary U
se
Serv ices a
nd Re sour
ces
Com mun
ity L ifelin
e
Unde rser
ved P opu latio ns % L ibr ar ie s w it h a Go a l in th e C lu s te r Population>100,000 Population<100,000 * * p-value<0.05
Chi-square analysis was also performed comparing the percentage of plans
containing individual goals in plans serving communities with populations over 100,000
with those serving populations under 100,000 (Table 3). Libraries serving communities
smaller than 100,000 had more plans with goals related to Community (31% vs. 13%,
p=.06) and Programming/Outreach (55% vs. 34%, p=.06), and this difference was
marginally significant. No statistically significant differences between libraries serving
Table 3: Proportion of Library Plans Containing Goal, by Size of Community. Goal Type Pop.>100,000
# of plans % of plans
Pop.<100,000
# of plans % of plans
p-value
Access/Use 18 0.47 27 0.44 0.84
Collaboration/Patnerships 20 0.53 41 0.66 0.21
Collections/Resources 14 0.37 15 0.24 0.18
Community 5 0.13 19 0.31 0.06
Ctd. Evaluation/Change 5 0.13 10 0.16 0.78
Customer Service 17 0.45 25 0.40 0.68
Diversity/Culture 10 0.26 12 0.19 0.46
Facilities/Environment 20 0.53 39 0.63 0.40
Finances/Funding/Advocacy 18 0.47 23 0.37 0.40
Information Destination 14 0.37 27 0.44 0.54
Language/Info Literacy 12 0.32 14 0.23 0.35
Marketing/Promotion 20 0.53 28 0.45 0.54
Programming/Outreach 13 0.34 34 0.55 0.06
Services: Adults 3 0.08 8 0.13 0.53
Services: Children 9 0.24 16 0.26 1.00
Services: Seniors 3 0.08 3 0.05 0.67
Services: Teens 8 0.21 8 0.13 0.40
Staff/Training 20 0.53 24 0.39 0.22
Stewards of the Public Trust 4 0.11 5 0.08 0.73
Support Career/Life Events 2 0.05 10 0.16 0.13
Support Education 13 0.34 28 0.45 0.30
Support Recreation 8 0.21 17 0.27 0.64
Technology 20 0.53 27 0.44 0.41
Community Median Age
The national median age as of the year 2000 was 35.3 years (U.S. Census Bureau,
2000). The median age of the communities served by the libraries in the sample was 34.9
years. (See Appendix D for a complete list of each library and the median age of the
population it serves.) The median ages ranged from 22.8, in a small community served by
the Howe Public Library (Hanover, NH), to 45.4 in the Lincolnwood Public Library
community (Lincolnwood, IL). Forty-eight of the libraries served a community with a
Fifty-two of the libraries served a community with a median age below the national
average, referred to below in as “younger communities.”
The percentage of plans with goals in each goal cluster was compared in older
versus younger communities (Figure 4). A chi square test revealed that libraries serving
younger communities were significantly more likely to have goals related to “Outreach”
(67.3% vs. 45.8%, p=0.043). There were no significant differences between younger and
older communities for the other goal clusters: Infrastructure (83.3% vs. 90.3%), Lifelong
Library Use (58.3% vs. 51.9%), Services and Resources (85.4% vs. 78.8%), Community
Lifeline (66.7% vs. 53.8%), and Underserved Populations (41.7% vs. 44.2%).
Figure 4: Proportion of Library Plans Containing Goal in Cluster, by Median Age.
Goal Clusters According to Median Age
0 0.1 0.2 0.3 0.4 0.5 0.6 0.7 0.8 0.9 1 Outre ach Infras truct ure Lifel ong Libr ary U
se Serv ices an d R eso urce s Comm unity Lifel ine Unde rser
ved P opu latio ns Age>35.3 Age<35.3 * * p-value<0.05
Individual goal codes were also subjected to Chi-square analysis to compare goal
frequency in libraries serving younger and older communities (Table 4). A significantly
Access/Use (57.7% vs. 31.3%, p=0.009) and Services for Seniors (11.5 vs. 0%, p=.027),
and a marginally significant increased proportion of goals relating to Services for Teens
(23.1% vs. 8.3%, p-value .057). On the other hand, libraries serving communities with a
higher median age had a significantly higher proportion of plans with Technology goals
(66.7% vs. 28.8%, p<.0001). None of the other goal codes were significantly different for
library plans serving younger and older communities.
Table 4: Proportion of Library Plans Containing Goal, by Median Age. Goal Type Median Age>35.3
# of plans % of plans
Median Age<35.3
# of plans % of plans
p-value
Access/Use 15 0.31 30 0.58 0.01
Collaboration/Patnerships 27 0.56 34 0.65 0.41
Collections/Resources 12 0.25 17 0.33 0.51
Community 14 0.29 10 0.19 0.35
Ctd. Evaluation/Change 9 0.19 6 0.12 0.40
Customer Service 21 0.44 21 0.40 0.84
Diversity/Culture 8 0.17 14 0.27 0.24
Facilities/Environment 30 0.63 29 0.56 0.55
Finances/Funding/Advocacy 21 0.44 20 0.38 0.69
Information Destination 24 0.50 17 0.33 0.10
Language and Information Literacy
11 0.23 15 0.29 0.65
Marketing/Promotion 24 0.50 24 0.46 0.84
Programming/Outreach 25 0.52 22 0.42 0.42
Services: Adults 5 0.10 6 0.12 1.00
Services: Children 10 0.21 15 0.29 0.49
Services: Seniors 0 0.00 6 0.12 0.03
Services: Teens 4 0.08 12 0.23 0.06
Staff/Training 23 0.48 21 0.40 0.55
Stewards of the Public Trust 6 0.13 3 0.06 0.31
Support Career/Life Events 8 0.17 4 0.08 0.22
Support Education 21 0.44 20 0.38 0.69
Support Recreation 14 0.29 11 0.21 0.37
Technology 32 0.67 15 0.29 0.00
Community Diversity
For the purpose of this analysis, ethnically diverse communities were defined as
communities with either a Caucasian population lower than the national average
than the national average: 12.5 percent for Hispanics, 12.3 percent for African
Americans, and 0.9 percent for Native Americans (U.S. Census Bureau, 2000). See
Appendix E for a breakdown of communities’ racial makeup. The mean percentage of
Caucasians in the communities in the sample was 81.66%. The mean percentage of
African Americans was 7.85%. Native Americans made up, on average, 0.94% of the
communities in the sample, and Hispanics made up 9.31%.
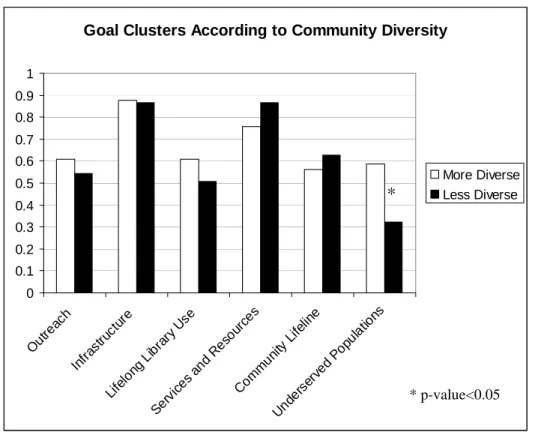
Using the definition above, 41 libraries were classified as less diverse, whereas 59
libraries were classified as more diverse. The percentage of library plans containing goals
for each goal cluster was compared with Chi-square tests to identify differences in more
diverse versus less diverse communities. In more diverse communities, a significantly
higher proportion of plans had goals relating to the “Underserved Populations” cluster
compared to less diverse communities (58.5% vs. 32.2%, p=0.013). No other cluster was
found to be significantly different across the two types of communities (more diverse vs.
less diverse); “Outreach” (61.0% vs. 54.2%), “Infrastructure” (87.8% vs. 86.4%),
“Lifelong Library Use” (61.0% vs. 50.8%), “Services and Resources” (75.6% vs. 86.4%),
Figure 5: Proportion of Library Plans Containing Goal in Cluster, by Community Diversity.
Goal Clusters According to Community Diversity
0 0.1 0.2 0.3 0.4 0.5 0.6 0.7 0.8 0.9 1 Outr eac h Infras truc ture Lifel ong Libr ary U
se
Serv ices a
nd R eso
urce s
Com mun
ity L ifelin
e
Unde rserv
ed P opu latio ns More Diverse Less Diverse * * p-value<0.05
Chi-square analysis was also performed comparing the percentage of plans
containing individual goals in plans serving more diverse communities with those serving
less diverse communities (Table 5). Libraries serving more diverse communities were
found to have significantly more plans that cited goals concerning Services to Teens
(26.8% vs. 8.5%, p=0.024). Literacy goals were also marginally significantly more
common in plans from libraries serving more diverse communities (36.6% vs. 18.6%,
p=0.063).The libraries serving less diverse communities were found to have significantly
more plans with goals concerning Marketing (49.1% vs. 46.3%, p=0.024), and
Programming and Outreach (57.6% vs. 31.7%, p=0.014). In the remaining goal codes, no
Table 5: Proportion of Library Plans Containing Goal, by Community Diversity. Goal Type More Diverse
# of plans % of plans
Less Diverse
# of plans % of plans
p-value
Access/Use 21 0.51 24 0.41 0.32
Collaboration/Patnerships 9 0.22 20 0.34 0.26
Collections/Resources 22 0.54 39 0.66 0.22
Community 10 0.24 14 0.24 1.00
Ctd. Evaluation/Change 4 0.10 11 0.19 0.27
Customer Service 16 0.39 26 0.44 0.68
Diversity/Culture 12 0.29 10 0.17 0.22
Facilities/Environment 22 0.54 37 0.63 0.41
Finances/Funding/Advocacy 15 0.37 26 0.44 0.54
Information Destination 14 0.34 27 0.46 0.30
Language and Information Literacy
15 0.37 11 0.19 0.06
Marketing/Promotion 19 0.46 29 0.49 0.04
Programming/Outreach 13 0.32 34 0.58 0.01
Services: Adults 6 0.15 5 0.08 0.35
Services: Children 13 0.32 12 0.20 0.34
Services: Seniors 4 0.10 2 0.03 0.22
Services: Teens 11 0.27 5 0.08 0.02
Staff/Training 8 0.20 26 0.44 1.00
Stewards of the Public Trust 2 0.05 7 0.12 0.30
Support Career/Life Events 4 0.10 8 0.14 0.76
Support Education 17 0.41 24 0.41 1.00
Support Recreation 11 0.27 14 0.24 0.82
Technology 20 0.49 27 0.46 0.84
Community Per-Capita Income
Per-capita incomes in the study communities ranged from $12,896 (Pima, AZ) to
$88,059 (Glencoe, IL) per year. Median per-capita income for the one hundred study
communities was $22,468 per year. Forty-seven libraries served communities with per
capita incomes less than the national average ($21,587 per year), while fifty-three
libraries served communities with per capita incomes greater than the national average.
See Appendix F for a breakdown of each library and the per capita income of the
The percentage of plans with goals in each goal cluster was compared in
communities with median per-capita income greater than the national average versus
communities with income less than the national average, (Figure 6). Libraries serving
communities with per-capita incomes above the national average had no significant
difference in the proportion of plans containing goals within any goal cluster. Specific
data is as follows (income above the national average vs. income below the national
average): “Outreach” (58.5% vs. 55.3%), “Infrastructure” (90.6% vs. 83.0%), “Lifelong
Library Use” (56.6% vs. 53.2%), “Services and Resources” (85.0% vs. 78.7%),
“Community Lifeline” (62.3% vs. 57.4%), and “Underserved Populations” (47.2% vs.
38.3%).
Figure 6: Proportion of Library Plans Containing Goal in Cluster, by Per Capita Income.
Goal Clusters According to Mean Per-Capita Income
0 0.1 0.2 0.3 0.4 0.5 0.6 0.7 0.8 0.9 1 Ou trea ch Infras truc ture Lifel ong Li
brar y Us
e Serv ices and Res ourc es Comm unity L
ifelin e Unde rse rved Pop ulat ions Income<21,587 Income>21,587
When the percentages of plans containing individual goal codes were compared in