Caregiver Super-humanization: The downside of being strong By
Lillian Dillard
Senior Honors Thesis
Department of Psychology and Neuroscience University of North Carolina at Chapel Hill
April 27, 2018
Approved:
Acknowledgements
First and foremost, I would like to thank the members of my committee. I have had continuous support throughout the completion of my thesis from my faculty advisor, Dr. Kurt Gray, as well as my graduate mentor Dr. Chelsea Schein. Throughout my time at UNC-CH Dr. Schein and Dr. Gray have provided me with guidance and support in all areas of my life. Thank you especially to Dr. Schein who always believed in me and encouraged me throughout my undergraduate career. I would not have grown to love research as much as I do without either of these two amazing people.
Second, I would like to thank my friends and family who have read this document a concerning number of times and have helped me to overcome my comma-phobia. Thank you for always believing in me and encouraging me during those late nights running data-analysis on SPSS in Davis Library. Also, thank you to the friends I made in my beautiful honors thesis class that helped me to laugh even when the going got tough.
Finally, I would like to acknowledge the financial support for this work from the Tom and Elizabeth Long Excellence Fund for Honors. I would like to thank the Well Spouse
Abstract
Caregiver Super-humanization: The downside of being strong
In the United States alone, there was an estimated 43.5 million informal caregivers in 2015 or approximately one in seven people who were taking care of the ill, disabled, or elderly (National Alliance for Caregiving and AARP, 2015). The value of labor provided by informal caregivers equated to 470 billion dollars in 2013, and as the baby boomer generation continues to age this number will only increase (AARP Public Policy Institute, 2015). On average that is $13,103 worth of unpaid labor per year for each of those informal caregivers. Beyond the economic cost, caregiving comes at a steep personal toll. One study compared the scores of non-caregivers to non-caregivers on the Mental Health Index, and found that non-caregivers scored
significantly worse on the MHI than the non-caregiver counterparts (Willette et al., 2006). Caregivers scored significantly higher in terms of depression and anxiety, as well as having significantly lower scores regarding feelings of belonging and positive affect, compared to the non-caregiver control group (Willette et al., 2006). These caregivers are put under intense physical stress in the form of lost sleep, as well as the physical exertion required to perform everyday tasks required to take care of their loved one.
According to moral typecasting theory, moral interactions involve two parties: moral agents and moral patients (Gray & Wegner, 2009). The moral agents make right or wrong choices and the moral patients receive the consequences of these choices. People who are ascribed more agency are then also perceived as having more self-control and more strength, both physically and emotionally (Gray, 2010). Conversely, moral patients are seen as having a greater capacity for suffering. In the case of a caregiver, she or he is consistently in the role of the moral agent, while the person being cared for is the moral patient. Because a caregiver is seen as a moral agent in this scenario they are more likely to be perceived as a moral agent throughout other areas of their life (Gray, 2010). Caregivers are moral agents that do a considerable amount of good, and because of this they are ascribed more agency.
Caregivers’ overwhelming need for help itself might also contribute to
super-humanization of caregivers. One reason that caregivers might be stripped of their individuality and lumped into an idolized crowd of saints may be due to the fact that it would be too
emotionally exhausting for the general public to acknowledge the suffering that this stigmatized group is experiencing (Cameron et al., 2015). The belief that caregivers are a different subset of humanity may inoculate the general public from feelings of guilt and compassion. If caregivers are not like the rest of us, but are rather super strong, and saint like, then they do not experience the same type of emotional or physical exhaustion. In continuation, if caregivers are not like the rest of us, then there is less need to offer support and empathy.
caregivers are assumed to not need the level of social support a typical person would receive if he or she were in a short term caregiver role.
Society has turned a blind eye to the needs of long-term, informal caregivers, and millions of people in the United States are suffering because of it. Caregivers themselves have attested to the fact there is a lack of information, communication, service provision, and support from healthcare and community services (Aoun et al., 2005). With direct intervention that seeks to improve social support for caregivers, significant improvements can be made effectively in the lives of this burgeoning population (Drentea et al., 2006). Society must recognize the error in its ways and hopefully this will sheds light on the need for social support and moral-typecasting reframing within the informal-caregiver community. This research also informs the larger theoretical contribution illustrating that super-humanization, ascribing more agency to a person, comes at a steep cost.
A review of the literature suggests that 1) people super-humanize caregivers since caregivers are continually in the moral agent role, and empathy is exhausting; and 2) this super-humanization translates into decreased perceived need for help. This paper focuses primarily on the first part of the first claim– that people super-humanize caregivers. In the pilot study and Study 1, I examine what caregivers are frequently told, exploring whether caregivers are often cast by others as super-human. In Study 2, I examine the language that non-caregivers use to describe caregivers, and I contrast that with the language caregivers use for themselves. I predict that people will super-humanize caregivers, ascribing them super strength, and associating them with saints.
To assess whether our theoretical predications for society’s super-humanization of long-term caregivers coordinated with real life experiences of caregivers, we first ran a pilot study asking caregivers to recall people’s reactions when they find out about their caregiver role. The pilot consisted of thirteen caregivers recruited through the Well Spouse Association, a non-profit support group for spousal caregivers (Mage = 60.53, 77% female). Out of concern for identifiability since the sample size was small, we did not collect detailed demographics. To reduce the likelihood that participants were discussing their responses with each other, the survey was sent out via email two weeks before a support group meeting, and all participants completed the study online.
To analyze the qualitative data we utilized an inductive procedure to extract themes from each collected statement. Common themes were then combined to create a master list of fourteen themes presented in Table 1. Without any sort of prompting or suggestions, around a quarter of participants stated that people call them saints or “mensches.” Additionally, the repeated phrase of “I couldn’t do that” also implies that many non-caregivers depict caregiving as super-human, capable of doing something beyond the capacity of everyday people. These percentages might seem low, but recall that this was a free-response paradigm. We predict that if asked specifically, a greater percentage of caregivers will report hearing super-humanization phrases.
Table 1. Inductive themes from self-reported caregiver responses heard from society regarding caregiver position
Themes Example % Participants
Sorry "I'm so sorry" 85
Similar situation "my ___ has been in a similar situation" 38
Curiosity about disability "what happened" 38
Questions about caregiver "how are you doing" 31
Questions about spouse "how is he doing" 23
I couldn’t do that "I could never do that" 23
Must be hard "it must be hard" 23
Offer prayers "I'll send prayers your way" 15
Offer general help "Is there anything I can do to help you" 15 Provide Specific Suggestion "have you thought about getting help at
home" 15
Do you have help "Do you have help" 15
Minimizing Challenges "everything will work out the way it's
supposed" 15
Marital Commitment “now you have to […] live up to those vows" 8
Study 1: What caregivers hear most often and its perceived helpfulness In our first full study, we expanded the pilot study to a larger group of Well Spouse Association caregivers. The survey was distributed to the Well Spouse Association newsletter, which consists of people with at least a baseline interest in receiving support for their role as a caregiver. We predicted that caregivers will report frequently hearing phrases consistent with super-humanization.
Participants
Participants consisted of 150 Well Spouse Association long-term, informal caregivers (Mage = 61.89, 82% female, Mtime as caregiver = 10.42 years). Participant’s time as caregivers ranged from 6 months to 34 years. On average, these were adults who spent multiple years of their lives caring for a spouse, and started caring for them in their mid-adulthood. Breakdown of spousal disease is presented in Table 2.
Table 2. Caregiver spouse disease demographics
Disease Total Percent
Multiple Sclerosis 31 20.7
Other 26 17.3
Stroke 21 14
Dementia/Alzheimers 21 14
Parkinson's 21 14
Spinal Cord 10 6.67
Lung Disease 7 4.7
Kidney Disease 6 4
Procedures
Participants were first asked to list up to 5 response they received when someone learned about their role as a caregiver. Participants then rated on a 5-point Likert scale how frequently they received these responses (1 = once a year or less, 5 = daily). Next, participants were presented with examples from each of the 14 themes extracted from the pilot data consisting of: How can I help you?, You must be so strong, You are such a saint, God only gives us what we
can handle, I could never do what you do, That must be really hard, Sorry to hear that, Can I
help you with ___, Can I bring over ___, When can I stay with ___ to give you a break, You are
such a good person, I had a relative/friend who had___ and he___, Have you considered
trying___ (referring to a treatment/ suggestion for whomever you are caring for), Are you
taking care of yourself?, Do you ever get a break?, Let me know what I can do to help (and the
person follows through), Let me know what I can do (and the person does not follow through), I
guess this is what’s meant by “for better or worse”, Everything will work out in the end, and Do
you have help?. Participants were then asked to rate on a 5-point Likert scale how helpful each statement is (1 = not at all, 5 = very). Participants were also asked to rate on a 5-point Likert scale how frequently they hear each statement (1 = once a year or less, 5 = daily). Next,
describing themselves in light of their role as a caregiver. Additional surveys, unrelated to the current question were included after these measures.
Results
Regarding frequency of help offered and need for help, only 2.2% (3 of 139) of
participants said that they are offered help frequently or all the time (4 or 5 on a 5-point scale), with 33.1% claiming that they never get offered help, 43.2% rarely getting offered help, and 21.6% occasionally getting offered help. In contrast to the amount of help offered, 95.7% of participants said that they occasionally, frequently, or always need help.
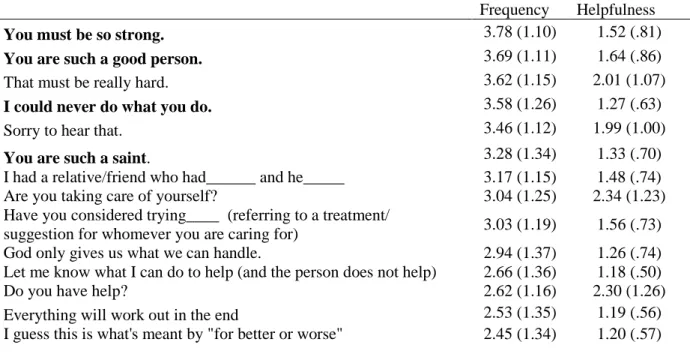
Frequency of Super-humanization. Table 2 shows the average frequency with which each statement is heard. Consistent with the claim that people super-humanize caregivers, the four super-humanization statements all appear at or near the top of the list. At the bottom of the list are the four statements regarding offering of specific help. “You must be so strong” was heard occasionally or more (responses 3-5) by 87.1% of caregivers, “you are such a good person” by 87.7%, “I could never do what you do” by 79.7%, and “you are such a saint” by “73.7%.” Table 2. Frequency of hearing each statement and perceived helpfulness. Item sorted by frequency of hearing each statement. Bolded statements indicate superhumanization.
Frequency Helpfulness
You must be so strong. 3.78 (1.10) 1.52 (.81)
You are such a good person. 3.69 (1.11) 1.64 (.86)
That must be really hard. 3.62 (1.15) 2.01 (1.07)
I could never do what you do. 3.58 (1.26) 1.27 (.63)
Sorry to hear that. 3.46 (1.12) 1.99 (1.00)
You are such a saint. 3.28 (1.34) 1.33 (.70)
I had a relative/friend who had______ and he_____ 3.17 (1.15) 1.48 (.74)
Are you taking care of yourself? 3.04 (1.25) 2.34 (1.23)
Have you considered trying____ (referring to a treatment/
suggestion for whomever you are caring for) 3.03 (1.19) 1.56 (.73) God only gives us what we can handle. 2.94 (1.37) 1.26 (.74) Let me know what I can do to help (and the person does not help) 2.66 (1.36) 1.18 (.50)
Do you have help? 2.62 (1.16) 2.30 (1.26)
Do you ever get a break? 2.42 (1.24) 2.15 (1.15)
How can I help you? 2.11 (.95) 3.24 (1.24)
Let me know what I can do to help (and the person actually helps) 1.77 (.95) 4.04 (1.35)
Can I help you with _____. 1.70 (.80) 3.34 (1.34)
Can I bring over_____. 1.49 (.73) 3.49 (1.37)
When can I stay with_____ to give you a break. 1.30 (.61) 3.64 (1.46)
Although the super-humanization phrases were heard often, they were on average not viewed as particularly helpful, with the mean helpfulness ratings for all those statements below 2. Overall, there was a strong inverse correlation at the item level between frequency of each statement, and the helpfulness of each statement, r(19) = -.75, p < .01. The statements heard most frequently, on average were found to be the least helpful as portrayed in Figure 3.
Figure X. Helpfulness vs. Frequency Heard of Caregiver Response Statements Discussion
This first study found that a majority of caregivers are told statements indicating super-humanization, but these statements are not found to be particularly helpful. When asked what they would like to hear in an open-ended response, the single most prevalent theme, present in 66% of responses, was offers of specific help. Caregivers reported wanting to hear phrases like, “I'm bringing dinner tomorrow night, so don't cook. / I'll stay with ___ tomorrow afternoon, so
1 3 5
1 3 5
He
lpfune
ss
you can shop,” and “I’ll be over at —— bringing——.” This repeated desire for additional help was also reflected in response to survey questions, where the vast majority of participants reported that they receive insufficient help.
There were statements that were non-super-humanizing that acknowledged the difficulty of the caregiving role, such as the statement “That must be really hard.” Even statements such as this were found to be relatively unhelpful, which begs the question why do caregivers still find this acknowledgement of difficulty unhelpful? There is a distinct possibility that non-caregivers are experiencing sincere sympathy for the difficulty of caregiving. However, there is the chance that non-caregivers are simply providing superficial sympathy and mimicking a sense of caring because that is the socially acceptable response to a person in need. This postulation is supported by the previously stated finding that only 2.2% of caregivers are frequently offered helped. If people were truly sympathetic to the caregiving situation and the amount of strength required for the role, and believe that caregivers are just like themselves, it would be logical that they would offer help. Since this is not seen, it is more likely that non-caregivers are instead providing superficial sympathy in their responses. Although this study cannot show that
superhumanization leads to reduced offering of help, it does strongly suggest that caregivers are often told phrases consistent with superhumanization, and that caregivers are an underserved population.
Study 2: Society’s perception of caregivers vs. self-perception
caregivers, the majority of the terms would be negative in nature and primarily related to the rigorous and isolating nature of the informal-caregiver role.
Method Participants
Non-Caregivers: 153 participants completed the study through Amazon Mechanical Turk (mTurk), though 26 reported being an informal caregiver1, and so the final sample was 127 (Mage = 35, gender not collected).
Caregivers: The caregiver population was the same as in Study 1. Procedure
Non-caregiver participants read one of three vignettes that described the daily life of a caregiver in a factual manner and were asked to write five adjectives that describe the caregiver. All vignettes used in this paper describe real caregivers, with names changed to preserve
anonymity. The first vignette described a veteran who was taking care of her spouse who was injured in war; the second describe a wife taking care of her husband who has multiple sclerosis; and the final vignette described a husband taking care of his wife who has Lou Gehrig’s Disease (for full vignettes, see appendix). For the sake of analysis, spelling mistakes were corrected, and similar words were combined (e.g. hard worker with hardworking). One adjective was
undecipherable, leaving 634 adjectives in total.
The caregiver sample were asked to write five adjectives that describe themselves in light of their role as caregivers. This question was presented after the recall and rating task described
in Study1. Spelling mistakes were corrected and analogous words were combined. A total of 639 adjectives were collected and analyzed.
Results
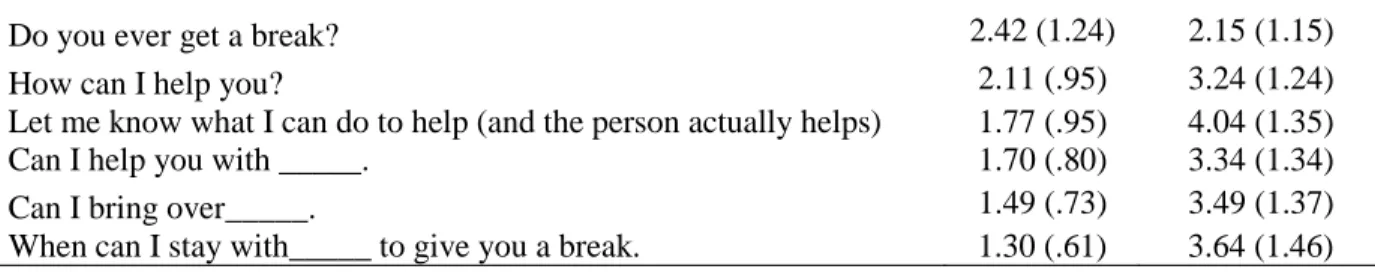
As predicted, in the non-caregiver group, 575 of the 634 analyzed adjectives reported by society were positive, which equates to 90.7% of the total terms regarding the caregiver
Figure 1. Wordle with caregiver adjectives sized proportional to reported frequency. A full frequency list is located in the Appendix
In comparison, for the caregivers, 389 of the 639 adjectives reported by caregivers were negative, which equates to 60.88% of the total adjectives reported. The top five reported
adjectives were all negative and included: tired, lonely, depressed, stressed, and sad. Positive adjectives comprised 30.2% of the total adjectives, with the most frequently reported positive adjective being loving with 17 reports. This is in comparison to the most frequently reported negative adjective, tired, at 46 reports. Neutral words (e.g. conservative, primary, nurse, etc.) totaled 57 and made up 8.92% of the total reported words. Figure 2 provides a visual
Figure 2. WordItOut with caregiver adjectives describing themselves in-light of their role as a caregiver. A full frequency list is located in the Appendix.
We compared the positive, negative, and neutral reported adjectives between the Well Spouse Association caregiver group to the mTurk non-caregiver group using a Chi-square test of independence. There was a significant relationship between adjective proportions and caregiver verses non-caregiver groups, X2 (2, N = 1273) = 497.6409, p < 0.00001. Thus, the null
hypothesis of independence between categories was rejected.
Table 3. Chi-square test of independence reported and expected proportions Negative Neutral Positive Total mTurk 36 (211.67) 23 (39.84) 575 (382.49) 634 Well Spouse Association 389 (213.33) 57 (40.16) 193 (385.51) 639
Total 425 80 768 1273
Discussion
is statistically signficant, and that reported caregiver descriptives is dependent on the caregiver or non-caregiver status of the participant. This study shows that the caregiver status results in a dichotomy of perception between society and caregivers. Society casts the caregiving role and caregiver as a distinctly positive position, whereas caregivers themselves suffer from and describe major drawbacks due to their role. This major difference in perception may lead to caregivers feeling isolated by their typcasted super-humanized moral agent role.
Discussion
The results of studies 1 and 2 support the hypothesis that society super-humanizes caregivers. This is seen through the chi-square test of independence analysis that found a significant relationship between the caregiver and non-caregiver categories in relation to difference in the proportion of adjectives in the neutral, negative, and positive categories.
Specifically, it was found that non-caregivers ascribe a significantly larger proportion of positive adjectives describing the caregiver role, compared to the proportion of positive adjectives
each vignette character. This would allow for a more direct comparison between the potential inverse relationship between help perceptions and super-humanization.
The presented studies were limited to a caregiver population from the Northeastern part of the United States, therefore perceptions of caregivers and offered support may vary across the cultural divides that preside in the United States. The caregiver population surveyed was limited to healthy individuals taking care of an ill or disabled spouse. The actual caregiver population includes those that are not necessarily entirely healthy spouse, as well as including caregiver relationships outside of just spouse-to-spouse. As persons in the United States continue to wait until later in life to have children it will be important to assess perceptions and support offered to those that are children taking care of elderly parents.
Regarding the implications of these findings there are two main outlets that may be utilized to effect change. First, the findings that the caregiver population is super-humanized, as well under supported by society’s response to their unique situations, can have policy
implications. Government implemented social support systems that offer financial and emotional support, would allow caregivers to be less isolated and exhausted by their role. This would also serve the purpose of legislatively recognizing that caregivers are under and misrepresented in comparison to the general, non-caregiver population. Second, government support of caregivers may also translate to general society recognizing and redefining the idealized image of a
Future research in relation to the caregiver population has a variety of avenues that may be pursued. This study found that caregivers are super-humanized, which in turn may reduce frequency of offered help. Research has found that super-humanization results in reduced perceptions of suffering, as well as increased perception of pain tolerance (Gray & Wegner, 2009). Despite the hardships of the caregiver role previous research has found that caregiving behaviors results in decreased mortality rates (Brown et al., 2009). Studying what allows
caregivers to overcome this opposition and out-live their non-caregiver counterparts may provide a window into effective coping mechanisms as well as the biological benefits of caregiving. This study specifically explores the self-perception of spousal caregivers regarding their role as caregivers, however there is a wide variety when it comes to caregiver relationships. Future studies may explore self-perceptions of parent-to-child caregivers or child-to-parent caregivers, as well as society’s potentially varied perceptions of these different parent-caretaker dyads. Another potential exploration is the perception of caregivers regarding other caregivers, for example how do spousal caregivers views on parent-to-child caregivers differ, and vice versa. There may be different in-groups and out-groups within the umbrella group of caregivers. The motive behind the non-caregiver population super-humanizing caregivers could offer a potential look into society’s coping mechanism regarding situations viewed as unpleasant or undesirable, yet morally compelling.
include stephanie brown, caregivers live longer for future research discussion
References
AARP Public Policy Institute. (2015). Valuing the Invaluable: 2015 Update.
Aoun, S. M., Kristjanson, L. J., Currow, D. C., & Hudson, P. L. (2005). Caregiving for the
doi:10.1191/0269216305pm1053oa
Brown SL, Smith DM, Schulz R, et al. Caregiving Behavior Is Associated With Decreased
Mortality Risk. Psychological science. 2009;20(4):488-494. doi:10.1111/j.1467-
9280.2009.02323.x.
Cameron, C. D., Harris, L. T., & Payne, B. K. (2015). The Emotional Cost of Humanity. Social
Psychological and Personality Science,7(2), 105-112. doi:10.1177/1948550615604453
Drentea, P., Clay, O. J., Roth, D. L., & Mittelman, M. S. (2006). Predictors of improvement in
social support: Five-year effects of a structured intervention for caregivers of spouses
with Alzheimers disease. Social Science & Medicine,63(4), 957-967.
doi:10.1016/j.socscimed.2006.02.020
Gray, K. (2010). Moral Transformation. Social Psychological and Personality Science,1(3), 253-
258. doi:10.1177/1948550610367686
Gray, K., & Wegner, D. M. (2009). Moral typecasting: Divergent perceptions of moral agents
and moral patients. Journal of Personality and Social Psychology,96(3), 505-520.
doi:10.1037/a0013748
Iacopino, V., & Xenakis, S. N. (2011). Neglect of Medical Evidence of Torture in Guantánamo
Bay: A Case Series. PLoS Medicine,8(4). doi:10.1371/journal.pmed.1001027
National Alliance for Caregiving and AARP. (2015). Caregiving in the U.S.
Waytz, A., Hoffman, K. M., & Trawalter, S. (2014). A Superhumanization Bias in Whites’ Perceptions of Blacks. Social Psychological and Personality Science,6(3), 352-359. doi:10.1177/194855061455364
Mental Health Nursing,27(8), 837-852. doi:10.1080/01612840600840711
Appendix Study 1
Vignette 1:
Maria is a 42 year old woman caring for her 42 year old husband Dillon. When both Maria and Dillon were stationed with the Army overseas, Dillon suffered a combat injury and is now
paraplegic. Maria had to retire from the military in order to take care of him because the veteran's benefits cover health care but not at-home assistance. Maria must complete all household chores as well as run all the errands. Maria has to help her husband with eating, moving him both in and out of the bathtub, and bringing him to all his doctors appointments.
Vignette 2:
Jim is a 41 year old man who cares for his 41 year old wife Briana. Two years after the couple married, Briana was diagnosed with Lou Gehrig's Disease. She is bedridden but can remain home alone while her husband is at work. Jim is responsible for all household tasks and for her personal care. He assists Briana with her everyday care, from brushing her teeth to bringing her meals.
Vignette 3:
Samantha is a 37 year old woman caring for her 39 year old husband Bill who was diagnosed with multiple sclerosis three years ago. They have three school-aged sons and Samantha works full-time. Bill is in a wheelchair and needs assistance with dressing, bathing, and feeding. Samantha is responsible for taking care of both him and their children.
Frequency Tables
Positive Word Frequency Percentage Cumulative Percent
caring 92 14.51 14.51
loving 70 11.04 25.55
responsible 30 4.73 30.28
kind 28 4.42 34.70
hardworking 28 4.42 39.12
strong 27 4.26 43.38
compassionate 27 4.26 47.63
dedicated 26 4.10 51.74
selfless 25 3.94 55.68
loyal 23 3.63 59.31
helpful 22 3.47 62.78
determined 16 2.52 65.30
devoted 12 1.89 67.19
patient 8 1.26 70.19
thoughtful 7 1.10 71.29
nice 7 1.10 72.40
brave 7 1.10 73.50
honorable 5 0.79 74.29
honest 5 0.79 75.08
giving 5 0.79 75.87
nurturing 4 0.63 76.50
good 4 0.63 77.13
generous 4 0.63 77.76
faithful 4 0.63 78.39
amazing 4 0.63 79.02
warm 3 0.47 79.50
understanding 3 0.47 79.97
trustworthy 3 0.47 80.44
supportive 3 0.47 80.91
resilient 3 0.47 81.39
dependable 3 0.47 81.86
calm 3 0.47 82.33
wonderful 2 0.32 82.65
reliable 2 0.32 82.97
proud 2 0.32 83.28
persistent 2 0.32 83.60
organized 2 0.32 83.91
energetic 2 0.32 84.23
endearing 2 0.32 84.54
diligent 2 0.32 84.86
capable 2 0.32 85.17
attentive 2 0.32 85.49
there-for-you 1 0.16 85.65
trusting 1 0.16 85.80
tolerant 1 0.16 85.96
thorough 1 0.16 86.12
thankful 1 0.16 86.28
sweet 1 0.16 86.44
sincere 1 0.16 86.59
saintly 1 0.16 86.75
respectable 1 0.16 86.91
productive 1 0.16 87.07
girl-power 1 0.16 87.22
motivated 1 0.16 87.54
moral 1 0.16 87.70
independent 1 0.16 87.85
humble 1 0.16 88.01
heroic 1 0.16 88.17
kind-hearted 1 0.16 88.33
happy 1 0.16 88.49
great 1 0.16 88.64
gentle 1 0.16 88.80
experienced 1 0.16 88.96
empathic 1 0.16 89.12
driven 1 0.16 89.27
disciplined 1 0.16 89.43
courageous 1 0.16 89.59
confident 1 0.16 89.75
charming 1 0.16 89.91
affectionate 1 0.16 90.06
adoring 1 0.16 90.22
admirable 1 0.16 90.38
accommodating
1 0.16 90.54
able 1 0.16 90.69
smart 2 0.32 91.01
self-sacrificing 1 0.16 91.17
sacrificial 1 0.16 91.32
Total 575 91.01 91.32
Negative Word Frequency Percentage Cumulative Percentage
busy 12 1.89 1.89
stressed 4 0.63 2.52
tired 3 0.47 3.00
exhausted 3 0.47 3.47
overworked 3 0.47 3.94
sad 2 0.32 4.26
weary 1 0.16 4.42
tireless 1 0.16 4.57
self sacrificing 1 0.16 4.73
sacrificial 1 0.16 4.89
poor 1 0.16 5.05
pity 1 0.16 5.21
lonely 1 0.16 5.52
no-life 1 0.16 5.68
Total 36 5.68 5.68
Neutral Word Frequency Percentage Cumulative Percentage
old 3 0.47 0.47
tough 1 0.16 0.63
retired 2 0.32 0.95
motherly 2 0.32 1.26
family 2 0.32 1.58
female 1 0.16 1.74
working 1 0.16 1.89
women 1 0.16 2.05
wife 1 0.16 2.21
solider 1 0.16 2.37
veteran 1 0.16 2.52
transporter 1 0.16 2.68
mother 2 0.32 3.00
caretaker 1 0.16 3.15
caregiver 2 0.32 3.47
alive 1 0.16 3.63
Total 23 3.63 3.63
Study 2
Frequency Tables
Negative Word Frequency Percentage Cumulative Percentage
tired 46 7.20 7.20
lonely 32 5.01 12.21
depressed 24 3.76 15.96
stressed 24 3.76 19.72
sad 20 3.13 22.85
frustrated 16 2.50 25.35
overwhelmed 16 2.50 27.86
anxious 15 2.35 30.20
angry 14 2.19 32.39
exhausted 12 1.88 34.27
worried 12 1.88 36.15
resentful 9 1.41 37.56
trapped 8 1.25 40.06
bored 6 0.94 41.00
resigned 5 0.78 41.78
unhappy 5 0.78 42.57
hopeless 4 0.63 43.19
impatient 4 0.63 43.82
isolated 4 0.63 44.44
scared 4 0.63 45.07
wornout 4 0.63 45.70
alone 3 0.47 46.17
challenged 3 0.47 46.64
discouraged 3 0.47 47.10
guilty 3 0.47 47.57
inadequate 3 0.47 48.04
unappreciated 3 0.47 48.51
cheated 2 0.31 48.83
confused 2 0.31 49.14
controlling 2 0.31 49.45
disappointed 2 0.31 49.77
emotional 2 0.31 50.08
fearful 2 0.31 50.39
helpless 2 0.31 50.70
nervous 2 0.31 51.02
sleepy 2 0.31 51.33
stuck 2 0.31 51.64
tied down 2 0.31 51.96
weary 2 0.31 52.27
a thankless job 1 0.16 52.43
abused 1 0.16 52.58
annoying 1 0.16 52.74
becoming bitter 1 0.16 52.90
belittled by medical personnel 1 0.16 53.05
broke 1 0.16 53.21
burdened 1 0.16 53.36
burnedout 1 0.16 53.52
confined 1 0.16 53.68
desperate 1 0.16 53.83
drained 1 0.16 53.99
eager to escape 1 0.16 54.15
empty 1 0.16 54.30
financially devastated 1 0.16 54.62
fragile 1 0.16 54.77
frazzled 1 0.16 54.93
fried 1 0.16 55.09
friendless 1 0.16 55.24
gypped 1 0.16 55.40
harried 1 0.16 55.56
imperfect 1 0.16 55.71
in crises 1 0.16 55.87
irritated 1 0.16 56.03
juggling 1 0.16 56.18
lethargic 1 0.16 56.34
loosing my positive attitude 1 0.16 56.49
lost 1 0.16 56.65
mischievious 1 0.16 56.81
moody 1 0.16 56.96
neglected 1 0.16 57.12
never ending 1 0.16 57.28
numb 1 0.16 57.43
obsessive 1 0.16 57.59
oppressed 1 0.16 57.75
out of control 1 0.16 57.90
overcautious 1 0.16 58.06
pessimistic 1 0.16 58.22
pressured 1 0.16 58.37
punished 1 0.16 58.53
refretful 1 0.16 58.69
relentless 1 0.16 58.84
secretly grieving 1 0.16 59.00
self sacrificing 1 0.16 59.15
sick 1 0.16 59.31
sorry 1 0.16 59.47
strained 1 0.16 59.62
stubborn 1 0.16 59.78
tough 1 0.16 59.94
uncertain 1 0.16 60.09
unrelenting 1 0.16 60.25
unsure 1 0.16 60.41
vulnerable 1 0.16 60.56
wage slave 1 0.16 60.72
Total 389 60.88 60.88 Positive Word Frequency Percentage Cumulative Percentage
loving 17 2.66 2.66
strong 16 2.50 5.16
caring 15 2.35 7.51
resilient 11 1.72 9.23
loyal 7 1.10 10.33
dedicated 6 0.94 11.27
patient 6 0.94 12.21
compassionated 5 0.78 12.99
helpful 5 0.78 13.77
resourceful 5 0.78 14.55
capable 4 0.63 15.18
committed 4 0.63 15.81
empathetic 4 0.63 16.43
faithful 4 0.63 17.06
competent 3 0.47 17.53
determined 3 0.47 18.00
energetic 3 0.47 18.47
hardworking 3 0.47 18.94
attentive 2 0.31 19.25
calm 2 0.31 19.56
conscientious 2 0.31 19.87
creative 2 0.31 20.19
diligent 2 0.31 20.50
generous 2 0.31 20.81
humble 2 0.31 21.13
humorous 2 0.31 21.44
innovative 2 0.31 21.75
kind 2 0.31 22.07
smart 2 0.31 22.38
supportive 2 0.31 22.69
tenacious 2 0.31 23.00
willing 2 0.31 23.32
wise 2 0.31 23.63
organized 2 0.31 23.94
proactive 2 0.31 24.26
adventurous 1 0.16 24.41
cheerful 1 0.16 24.57
content 1 0.16 24.88
coping 1 0.16 25.04
devoted 1 0.16 25.20
dutiful 1 0.16 25.35
effective 1 0.16 25.51
enthusiastic 1 0.16 25.67
forgiving 1 0.16 25.82
fun 1 0.16 25.98
good natured 1 0.16 26.13
goofy 1 0.16 26.29
heroic 1 0.16 26.45
hopeful 1 0.16 26.60
intelligent 1 0.16 26.76
meaningful 1 0.16 26.92
non judgemental 1 0.16 27.07
nurturing 1 0.16 27.23
optimistic 1 0.16 27.39
reliable 1 0.16 27.54
positive 1 0.16 27.70
responsible 1 0.16 27.86
rewarding 1 0.16 28.01
safe 1 0.16 28.17
spontaneous 1 0.16 28.33
stead fast 1 0.16 28.48
thankful 1 0.16 28.64
thoughtful 1 0.16 28.79
tolerant 1 0.16 28.95
understanding 1 0.16 29.11
versatile 1 0.16 29.26
warm 1 0.16 29.42
enduring 1 0.16 29.58
growing 1 0.16 29.73
learning 1 0.16 29.89
thorough 1 0.16 30.05
vigilant 1 0.16 30.20
Total 193 30.20 30.20
Neutral Word Frequency Percentage Cumulative Percentage
obligated 4 0.63 0.63
flexible 3 0.47 1.10
constant 2 0.31 1.88
persistent 2 0.31 2.19
spiritual 2 0.31 2.50
bank 1 0.16 2.66
careful 1 0.16 2.82
christian 1 0.16 2.97
conservative 1 0.16 3.13
curious 1 0.16 3.29
edgy 1 0.16 3.44
educated 1 0.16 3.60
efficient 1 0.16 3.76
endless 1 0.16 3.91
fat 1 0.16 4.07
firm 1 0.16 4.23
focused 1 0.16 4.38
full 1 0.16 4.54
healthy 1 0.16 4.69
honest 1 0.16 4.85
horny 1 0.16 5.01
integrity 1 0.16 5.16
introverted 1 0.16 5.32
love my grandkids 1 0.16 5.48
maid 1 0.16 5.63
mother 1 0.16 5.79
motherly 1 0.16 5.95
multitasker 1 0.16 6.10
needed 1 0.16 6.26
nurse 1 0.16 6.42
observant 1 0.16 6.57
old 1 0.16 6.73
open minded 1 0.16 6.89
planning ahead 1 0.16 7.04
prepared 1 0.16 7.20
professional 1 0.16 7.36
realisitc 1 0.16 7.51
reflective 1 0.16 7.67
resolved 1 0.16 7.82
settled 1 0.16 7.98
share your feelings 1 0.16 8.14
sole 1 0.16 8.29
still horny 1 0.16 8.61
watchful 1 0.16 8.76
primary 1 0.16 8.92