Source: International Joint Commission (IJC) website (www.ijc.org); original source: Environmental and Energy Research Center (EERC), University of North Dakota.
Inventory Team report
October 2000
I. INTRODUCTION ... 1
DEFINITION OF FLOOD DAMAGE REDUCTION (FDR) ... 1
MINNESOTA MEDIATION AGREEMENT GOALS... 2
TEAM MEMBERS... 2
ACKNOWLEDGMENTS... 3
II. GEOGRAPHIC SETTIN G ... 3
III. FLOOD HISTORY OF THE RED RIVER BASIN ... 5
IV. FLOOD DAMAGES / FLOOD RECOVERY COSTS... 8
CANADA... 9
EMERGENCY PREPAREDNESS CANADA... 9
MANITOBA EMERGENCY MANAGEMENT ORGANIZATION (MEMO)... 10
UNITED STATES PUBLIC ASSISTANCE PROGRAMS... 13
FEMA PUBLIC ASSISTANCE PROGRAM... 14
DEPARTMENT OF TRANSPORTATION... 16
ARMY CORPS OF ENGINEERS... 17
RURAL UTILITIES SERVI CE... 17
UNITED STATES INDIVIDUAL ASSISTANCE PROGRAMS... 18
FEMA... 19
Individual and Family Grants Program... 19
Crisis Counseling Program ... 20
National Flood Insurance Program (NFIP) ... 20
Disaster Housing Program (DHA) ... 21
US DEPARTMENT OF LABOR’S DISASTER UNEMPLOYMENT ASSISTANCE... 23
UNITED STATES DEPARTMENT OF AGRICULTURE (USDA)... 24
Food and Nutrition Service ... 24
Rural Development’s Rural Housing Service ... 24
Rural Business Service... 24
HOUSING AND URBAN DEVELOPMENT... 25
Community Block Development Program... 25
Public Housing... 25
Mortgage Assistance from HUD's Federal Housing Administration (FHA) .... 25
Assistance from the Government National Mortgage Association... 25
SMALL BUSINESS ADMINISTRATION (SBA) ... 26
Home Disaster Loan... 27
Business Physical Disaster Loans ... 27
Economic Injury Disaster Loans (EIDL)... 28
UNITED STATES AGRICULTURE ASSISTANCE PROGRAMS... 29
USDA... 29
Risk Management Agency... 30
Federal Crop Insurance Corporation (FCIC) ... 30
FARM SERVICE AGENCY... 32
1998 Flood Compensation Program ... 33
NON-GOVERNMENT SPONSORED DISASTER RELIEF ORGANIZATIONS (NGOS) ... 35
AMERICAN RED CROSS... 35
Emergency Assistance ... 36
Emergency Mass Care ... 36
Additional Assistance ... 36
SALVATION ARMY... 37
OTHER NON-GOVERNMENTAL FLOOD RECOVERY ASSISTANCE... 37
PSYCHOLOGICAL DAMAGES... 37 IJC STUDY... 38 COUNSELING ASSISTANCE... 39 ENVIRONMENTAL IMPACTS... 41 WATER QUALITY... 41 Hazardous Material... 42
Sewage and Related Facilities... 43
Commercial Facilities ... 43
Livestock ... 43
Groundwater... 43
HUMAN HEALTH... 44
USDA NATURAL RESOURCE RECOVERY PROGRAMS... 44
Migration Wildfowl Feeding ... 44
Resident Wildlife Feeding ... 44
Land Protection... 44
SUMMARY OF FLOOD DAMAGES (1993 – 1998) ... 45
V. PROJECTED FLOOD DAMAGES ... 46
VI. FDR PROJECTS ... 46
VII. OBSTACLES TO DEVELOPMENT AND IMPLEMENTATION OF FDR SOLUTIONS ... 46
VIII. REFERENCES ... 48
APPENDIX A. COUNTIES/RURAL MUNICIPALITIES IN THE RED RIVER RRB. 50 APPENDIX B. EXPANDED NFIP STATISTICS (MINNESOTA). ... 52
APPENDIX C. EXPANDED NFIP STATISTICS (NORTH DAKOTA). ... 54
APPENDIX D. FLOOD DAMAGE REDUCTION IN THE RRB. ... 56
RRB TASK FORCE. ... 74
APPENDIX H. WINNIPEG POTENTIAL FDR PROJECTS AND PROGRAMS... 76
APPENDIX I. RED RIVER WATER MANAGEMENT BOARD (RRWMB)
COMPLETED FDR PROJEC TS... 79
APPENDIX J. RED RIVER WATER MANAGEMENT BOARD (RRWMB)
COMPLETED FDR PROJEC TS... 89
APPENDIX K. RRWMB NON-RETENTION FLOOD DAMAGE REDUCTION
PROJECTS UNDER CONSTRUCTION... 91
APPENDIX L. RRWMB FLOOD DAMAGE PROJECTS IN PROGRESS... 93
APPENDIX M. NORTH DAKOTA STATE WATER COMMISSION (NDSWC) FLOOD DAMAGE REDUCTION PROJECTS: DEVILS LAKE RRB (1999 –
2001). ... 98
APPENDIX N. NDSWC DEVILS LAKE RRB FDR PROJECTS- 2001 – 2011
TIMEFRAME. ... 100
APPENDIX O. NDSWC DEVILS LAKE RRB PROJECTS- BEYOND 2011
TIMEFRAME. ... 102
APPENDIX P. NDSWC RED RIVER RRB PROJECTS- 1999-2001 TIMEFRAME. . 104
APPENDIX Q. NDSWC RED RIVER RRB PROJECTS- 2001 - 2011 TIMEFRAME. ... 108
APPENDIX R. NDSWC RED RIVER RRB PROJECTS - BEYOND 2011
TIMEFRAME. ... 113
APPENDIX S. US ARMY CORP OF ENGINEERS- SECTION 205 PROJECTS. ... 116
APPENDIX T. ND RRB FDR PROJECT DETAILS. ... 125
LIST OF FIGURES
FIGURE 1. THE RED RIVER RRB. ... 3 FIGURE 2. SUB-WATERS HEDS OF THE RRB. ... 4
LIST OF TABLES
TABLE 1. MAJOR HISTORICAL FLOODS IN THE RED RIVER RRB ... 5 TABLE 2. MAJOR RECORDED FLOODS IN THE RED RIVER RRB. ... 6 TABLE 3. TOP 20 FLOODS: SELECTED SITES IN THE RED RIVER RRB. ... 8
TABLE 5. MEMO PRIVATE FLOOD RECOVERY ASSISTANCE (1993 – 1997)... 11
TABLE 6. MEMO FLOOD RECOVERY ASSISTANCE (PUBLIC CLAIMS). ... 11
TABLE 7. ND FEMA PUBLIC ASSISTANCE TOTALS ... 15
TABLE 8. DISASTER EXPENDITURES IN MN (1993 – 1999) ... 16
TABLE 9. NORTH DAKOTA FEMA INDIVIDUAL AND FAMILY GRANTS ASSISTANCE. ... 19
TABLE 10. NORTH DAKOTA FEMA NFIP (AS OF 9/30/98). ... 20
TABLE 11. MINNESOTA FEMA NFIP (AS OF 9/30/98). ... 21
TABLE 12. NORTH DAKOTA FEMA DISASTER HOUSING ASSISTANCE. ... 22
TABLE 13. NORTH DAKOTA DISASTER UNEMPLOYMENT ASSISTANCE ... 23
TABLE 14. MINNESOTA HUD ASSISTANCE. ... 26
TABLE 15. NORTH DAKOTA SMALL BUSINESS LOAN ASSISTANCE. ... 28
TABLE 16. NORTH DAKOTA FCIC INDEMNITIES. ... 30
TABLE 17. SOUTH DAKOTA RMA FCIC INDEMNITIES... 31
TABLE 18. MINNESOTA RMA FCIC INDEMNITIES ... 31
TABLE 19. NORTH DAKOTA FSA FLOOD DISASTER ASSISTANCE. ... 34
TABLE 20. SOUTH DAKOTA FSA FLOOD DISASTER ASSISTANCE. ... 34
TABLE 21. MINNESOTA FSA EMERGENCY LOAN ASSISTANCE. ... 35
TABLE 22. NORTH DAKOTA ESTIMATED EXPENDITURES FOR FEMA'S CRISIS COUNSELING IMMEDIATE SERVIC ES GRANT (04/97 TO 12/97). ... 40
TABLE 23. NUMBER OF CLIENTS SERVED IN MN... 40
TABLE 24. SERVICES PROVIDED TO CLAY COUNTY RESIDENTS (LAKELAND MENTAL HEALTH CENTER INC.). ... 40
TABLE 25. DOCUMENTED FLOOD DAMAGE REDUCTION EXPENDITURES 1993-1999 ... 45
I. INTRODUCTION
The purpose of the Flood Damage Reduction Team (FDRT) and its report, as defined by the Inventory Task Force, was to:
• Seek agreement among FDRT members as to an acceptable definition(s) for “flood damage reduction” since it has different meanings and involves different initiatives in different jurisdictions.
• Develop a brief overview summary of the history of flooding in the Red River Basin (RRB), based on existing information developed by local, state, provincial, and other entities.
• Using existing information sources, develop tables/charts portraying flood damages by jurisdiction and type.
• Develop a summary of projected flood damages based on current population growth trends.
• Compile a list of all projects and programs suggested over time for reducing flood damages including “currently active,” “non-active,” and “status unknown” projects. The following types of information were to be included:
• General Description • Sponsor
• Current Status/Implementation Track • Location
• Specific problem(s) addressed • Costs and benefits
• Average Annual Reduction Benefits • Cost-sharing Formula
• Other available information
• Compile a condensed list of projects and programs (both structural and non-structural) warranting further consideration in the planning process and for which “updated” information should be developed.
Definition of Flood Damage Reduction (FDR)
The FDRT adopted the following definition of flood damage reduction, which is a modified version of the definition included in the Red River RRB Flood Damage Reduction Work Group’s (RRBFDRWG) Mediation Agreement (Minnesota Mediation Agreement), funded by the Minnesota Legislature:
"Flood damage reduction” refers to the reduction of physical and emotional impacts to humans and the reduction of damages to property and the natural environment caused by flooding. Flood damage reduction measures include those that affect the flood itself, such as upper RRB storage, measures that affect flood-susceptible property, such as flood plain
management, and measures that affect damages incurred such as a disaster response networks.
Minnesota Mediation Agreement Goals
The FDRT adopted and/or modified the following flood damage reduction goals developed and agreed to by the RRBFDRWG:
• Significantly reduce damage to farm structures, homes, and communities. • Reduce damage to farmland.
• Reduce transportation damages.
• Reduce damage to water quality by preventing floodwaters coming into contact with potential contaminants.
• When evaluating flood damage reduction measures, consideration will be given to those measures that maximize potential environmental enhancement opportunities and minimize adverse environmental impacts.
• Reduce social and emotional damages. • Reduce damage to natural resource systems. • Expand post-flood disaster response initiatives.
Team Members
The FDR Inventory Team decided only those members who attended at least one meeting would be listed as report contributors; those members who never
attended/participated would not be listed. FDRT members contributing to this report include: • Allen Ruzicka, Co-chair (RRBB, Walsh County, ND)
• Lyle Eisert, Co-chair (Polk County, MN)
• Don Ogaard, Former chair (RRBB, Red River Water Management Board, MN)
• Randy Gjestvang (North Dakota State Water Commission) • Jon Roeschlein (RRBB, Bois de Sioux Watershed District, MN) • Tom Raster (US Army Corps of Engineers)
• Dan Thul (Minnesota Department of Natural Resources) • John Arthur (Manitoba Natural Resources)
• Curt Carlson (Marshall County, MN)
• Peter Friesen (Rural Municipality of Franklin, MB)
• Mike Mahoney (Land Owners Association of North Dakota) • Valerie Rutherford (RRBB, Rural Municipality of Ritchot, MB)
Acknowledgments
The FDRT was assigned the task of compiling currently available data and
information; therefore, large sections of this report are taken directly or adapted from source material. All source materials are referenced.
II. GEOGRAPHIC SETTING
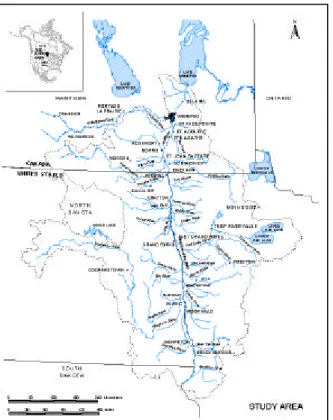
The Red River RRB (RRB) is an international, multi-jurisdictional RRB,
approximately 45,000 square miles (28 million acres of land and water) in size (Figure 1) (Krenz and Leitch, 1993). The Devils Lake RRB (3,810 square miles) is included in the RRBB’s water management planning efforts because of the potential for artificial and natural hydrologic connection between the RRB and the Devil’s Lake RRB. The Assiniboine River, although it joins the Red River in downtown Winnipeg, is not part of the RRBB’s efforts. Nearly 40,000 square miles of the RRB (103,600 square kilometers) are in the United States; the remaining 5,000 square miles (13,000 square kilometers) are in Canada (Krenz and Leitch 1993). Only 1 percent of the RRB is located in the extreme northeast corner of South Dakota (Krenz and Leitch 1993). The counties and rural municipalities situated in the RRB are listed in Appendix A.
Figure 1. The Red River Basin.
Source: International Joint Commission (IJC) website (www.ijc.org); original source: Environmental and Energy Research Center (EERC), University of North Dakota.
The RRB consists of twenty-five major sub-RRBs (Figure 2). Four of the sub-RRBs are inter-jurisdictional RRBs, including Pembina (shared by North Dakota and Manitoba), Roseau (shared by Minnesota and Manitoba), Wild Rice (shared by North Dakota and South Dakota), and Bois de Sioux (shared by North Dakota and South Dakota). Seven sub-RRBs, including Devils Lake, Park, Forest, Turtle, Goose, Elm, and Sheyenne, are located entirely in North Dakota. Nine sub-RRBs are located entirely in Minnesota side including Two Rivers, Tamarac, Middle Snake, Red Lake, Sandhill, Wild Rice-Marsh, Buffalo, Otter Tail, and Mustinka-Rabbit. Five sub-RRBs, including La Salle, Morris, Riviere Aux Marais/Plum, and Seine, and Rat, are situated entirely in Manitoba.
Figure 2. Sub-watersheds of the RRB.
Source: Krenz and Leitch, A River Runs North, 1993. Original source: Souris-Red-Rainy River Basin’s Commission.
The unique topography of the RRB contributes to the flooding problem frequently experienced by the RRB’s residents. The “valley” portion of the RRB has a slope of 1-2 feet per mile and has been described as “a huge dinner plate tilting very slightly to the north” (The International Coalition 1989). At the RRB’s margins, the sub-watersheds draining into the Red River main stem have an elevation drop of up to 950 feet in 80-100 miles. When stream banks are full to capacity, excess surface water does not have anywhere to go but
The RRB does not experience spring thaw uniformly. Because the Red River flows north, the upstream (southern) end of the RRB may be melting, while the downstream (northern) end of the RRB may still be frozen. The downstream reaches of the Red River may contain ice jams and/or Lake Winnipeg, which the Red River discharges into, may still be frozen; either of these situations can cause localized flooding upstream of the “ice dam” and/or slow down the retreat of the floodwaters.
III. FLOOD HISTORY OF THE RED RIVER BASIN
The following history of flooding in the RRB is taken from the RRBB’s Hydrology Inventory Team’s final report:
The floods of 1950, 1966, 1979, and 1997 were the largest and most damaging floods that have occurred throughout the RRB since streamflow records began in the early 1880's (Tables 1 and 2). Upstream of the confluence of the Turtle River and Red River, however, the streamflow during the 1997 flood was greater than the streamflow during the 1950, 1966, and 1979 floods, and probably the 1897 flood. The twenty largest recorded floods, listed by flow for selected cities, are listed in Table 3.
Table 1. Major Historical Floods in the Red River RRB Year Historical Floods
1776 Stages were about four feet lower than during the 1826 flood at Winnipeg. However, the US Geological Survey (USGS) references a Mr. Nolan (1826) who stated this flood was larger than the 1826 flood. Some evidence for this claim is given. Elevation at Winnipeg, junction of the Assiniboine and Red Rivers is given as 760 feet (USGS). It is quite likely that the river was as high in 1950.
1790 Stages were about four feet lower than during the 1826 flood at Winnipeg. Year in which general overflow occurred (USGS).
1809 Stages were about four feet lower than during the 1826 flood at Winnipeg. Year in which general overflow occurred (USGS).
1815 Water was remarkably high, overflowing its banks to a considerable distance at Fort Daer near Pembina.
1824 Listed as one of the worst floods along the Red River along with 1825 and 1826.
1825 Listed as one of the worst floods along the Red River along with 1824 and 1826.
1826 Elevation at Winnipeg listed at 764 feet (USGS). Maximum known flood at Winnipeg, stages about 15 feet above the ordinary flood height (Simons and King). Ice on the river reached the extraordinary thickness of 5 feet to 7 feet at Winnipeg. Harrison and Bluemle report the flood level to be 66 feet based on the present stage datum at Pembina.
1852 Elevation at Winnipeg listed at 762 feet (USGS). Flood was higher by 1 or more feet than that of 1882 at and below Grand Forks (Simons and King).
1853 No farming was done in the Red River valley due to the floods of this year and the previous two years.
1861 This flood may have exceeded the 1897 flood. Elevations are listed at Grand Forks and Winnipeg as 830 and 762 feet, respectively.
1871 This flood was exceeded during the 1897 flood.
The 1826 flood is believed to be the greatest flood in the Red River valley in the last 200 years. The 1826 flood probably was the greatest on many streams in the RRB. From the accounts of the 1826 flood, several characteristics can be can be reached: (1) the fall of 1825 was extremely wet and most of the lakes and wetlands were overflowing, (2) a major
snowstorm occurred in late fall, (3) a cold, snowy winter permitted an exceptionally deep snow pack to develop over much of the RRB, and (4) the coldest estimated March-April mean temperature at Winnipeg since 1815, was in 1826.
Table 2. Major Recorded Floods in the Red River RRB. Year Recorded Floods
1882 The highest flood since 1852 at Winnipeg (Simons and King, 1922, p.52). Elevations are listed at Grand Forks and Winnipeg as 827.9 and 754 feet, respectively (Harris and Bluemle; USGS, O.O.Holmen). Peak flow at Grand Forks: 75,000 cfs, April 18.
1883 Peak flow at Grand Forks: 38,600 cfs, April 26.
1893 Flood was most serious between Grand Forks and the international boundary (Simons and King). Peak flow at Grand Forks: 53,300 cfs, April 24.
1897 Flood followed an extensive prairie fire in 1896 (Bradvick) and a wet fall followed by a severe winter (USGS). Largest flood of record prior to the flood of 1997. It included two peaks. Elevation at Winnipeg listed at 750 feet (USGS) and at Grand Forks listed as 828.6 feet (O.O. Holmen, USGS). Peak flow: at Fargo, 25,000 cfs, April 7; at Grand Forks, 85,000 cfs, April 10.
1904 Flood was most serious between Grand Forks and the international boundary (Simons and King). Peak flow: at Fargo, 5,220 cfs, April 20; at Grand Forks, 33,000 cfs, April 27.
1916 Flood was most serious in the vicinity of Fargo and upstream reaches (Simons and King). Peak flow: at Fargo, 6,200 cfs, March 28; at Grand Forks, 30,300 cfs, March 31.
1943 Peak flow: at Fargo, 16,000 cfs, April 7; at Grand Forks, 28,200 cfs, April 12.
1947 Peak flow: at Fargo, 9,300 cfs, April 15; at Grand Forks, 35,000 cfs, April 21.
1948 Peak flow: at Fargo, 3,380 cfs, April 10; at Grand Forks, 34,200 cfs, April 16.
1950 Flood included two peaks. The first peak was 43,800 cfs on April 25th at Grand Forks. The second peak at Grand Forks was 54,000 cfs, May 12. Peak flow at Emerson, Manitoba, 95,500 cfs.
1952 Peak flow: at Fargo, 16,300 cfs, April 16; at Grand Forks, 23,900 cfs, April 20.
1965 Peak flow: at Fargo, 11,400 cfs, April 15; at Grand Forks, 52,000 cfs, April 17; at Emerson, Manitoba, 46,200 cfs, April 26.
1966 Peak flow: at Fargo, 10,700 cfs, March 22; at Grand Forks, 55,000 cfs, April 4; at Emerson, Manitoba, 66,800 cfs, April 11.
1969 Peak flow: at Fargo, 25,300 cfs, April 15; at Grand Forks, 53,500 cfs, April 16; at Emerson, Manitoba, 54,700 cfs, April 26.
1974 Peak flow: at Fargo, 4,150 cfs, April 14; at Grand Forks, 34,300 cfs, April 19; at Emerson, Manitoba, 43,500 cfs, April 28.
1975 Flood included two peaks. The first peak was 42,400 cfs on April 22nd at Grand Forks. The first peak at Fargo was 8380 cfs on May 12th.
1979 Flood was second largest after 1897 at Grand Forks. Elevation listed as 828.5 feet at the NPR bridge site of original gage (O.O. Holmen, USGS). Peak flow: at Fargo, 17,300 cfs, April 19; at Grand Forks, 82,000 cfs, April 23; at Emerson, Manitoba, 92,700 cfs, May 1.
1986 Peak flow: at Fargo, 8,640 cfs, April 2; at Grand Forks, 31,900 cfs, April 2; at Emerson, Manitoba, 34,200 cfs, April 7.
1989 Peak flow: at Fargo, 18,900 cfs, April 9; at Grand Forks, 39,600 cfs, April 13; at Emerson, Manitoba, 47,200 cfs, April 23.
1993 Peak flow: at Fargo, 10,100 cfs, April 1; at Grand Forks, 26,200 cfs, Aug 3; at Emerson, Manitoba, 31,900 cfs, Aug 16.
1996 Peak flow: at Fargo, 9,940 cfs, April 15; at Grand Forks, 58,100 cfs, April 21; at Emerson, Manitoba, 66,700 cfs, April 26.
1997 Peak flow: at Fargo, 28,000 cfs, April 17; at Grand Forks, 137,000 cfs, April 18; at Pembina, 141,000 cfs, April 26.
1999 Peak flow: at Fargo, 4,900 cfs, Mar. 22; at Grand Forks, 50,000 cfs, Mar. 31: at Emerson, Manitoba, 58,600 cfs, Apr. 13.
* Recorded floods listed when discharge is greater than approximately 30,000 cfs and gage height is greater than approximately 40 feet at Grand Forks or discharge is greater than approximately 8,000 cfs and gage height greater than approximately 25 feet at Fargo. This is a flood of approximately a five-year recurrence interval at both Grand Forks and Fargo. Channel capacity at Grand Forks is 27,000 cfs and at Fargo is 7,000 cfs.
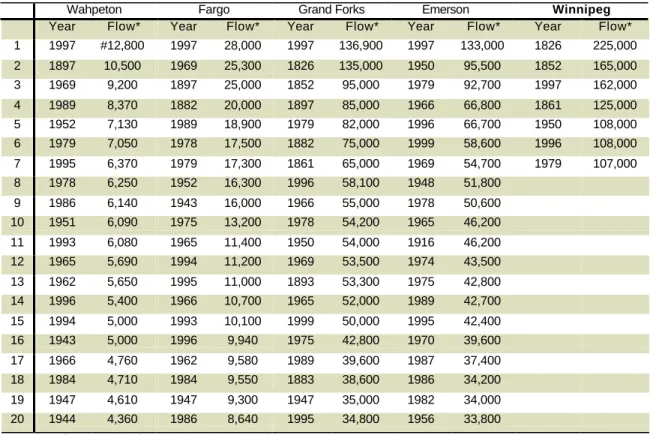
The flood of 1997 was the worst flooding in more than 100 years. Recurrence intervals for peak flows on the main stem of the Red River ranged from 50 to 500 years (Table 3). On April 6, 1997, the stage of the Red River at Wahpeton, ND, was 19.42 ft., which is 1.47 ft. higher than the record set in 1989. On April 15, 1997, 9 days later, flow was 12,800 cubic feet per second (cfs), and the stage was 19.22 ft. The recurrence interval for the April 15 peak flow was between 100 and 200 years. On April 8, 1997, most of the 1,700 people in Ada, MN, were forced to flee their homes as overland flow from the flooding Marsh and Wild Rice Rivers inundated the town. Freezing temperatures from the late-spring blizzard caused a layer of ice to form over the flooding waters. On April 17, 1997, flow on the Red River at Fargo, ND, and Moorhead, MN, was 28,000ft cfs. The recurrence interval for this peak flow was between 50 and 100 years. On April 18, 1997, the stage was 39.62 ft., which exceeded the record of 39.10 ft. set 100 years earlier. On April 18, 1997, flow on the Red River at Grand Forks, ND, was 136,900 cfs, and the stage was 52.21 ft, which is more than 2 ft higher than the record set in 1897. The recurrence interval for this peak flow was between 200 and 500 years. The stage continued to rise to 54.35 ft on April 22, 1997. On April 25, 1997, flow on the Red River at Drayton, ND, was 123,000 cfs., and the stage was 45.56 ft, which is 1.90 ft higher than the record set in 1979. The recurrence interval for the April 25 peak flow was between 200 and 500 years.
In addition to flow on the main stem, peak flow on many rivers and streams tributary to the Red River had 10-year or greater recurrence intervals during the 1997 floods. The recurrence interval for flow on the Bois de Sioux River near White Rock, SD, was between 200 and 500 years, and the recurrence interval for flow on the Wild Rice River at Twin Valley, MN, was between 100 and 200 years. The recurrence interval for flow on the Red Lake River at Crookston, MN, was between 50 and 100 years. The Red Lake River normally accounts for almost 35 percent of the Red River’s flow (Rowland, 1997).
Table 3. Top 20 Floods: Selected Sites in the Red River RRB.
Wahpeton Fargo Grand Forks Emerson Winnipeg
Year Flow* Year Flow* Year Flow* Year Flow* Year Flow* 1 1997 #12,800 1997 28,000 1997 136,900 1997 133,000 1826 225,000 2 1897 10,500 1969 25,300 1826 135,000 1950 95,500 1852 165,000 3 1969 9,200 1897 25,000 1852 95,000 1979 92,700 1997 162,000 4 1989 8,370 1882 20,000 1897 85,000 1966 66,800 1861 125,000 5 1952 7,130 1989 18,900 1979 82,000 1996 66,700 1950 108,000 6 1979 7,050 1978 17,500 1882 75,000 1999 58,600 1996 108,000 7 1995 6,370 1979 17,300 1861 65,000 1969 54,700 1979 107,000 8 1978 6,250 1952 16,300 1996 58,100 1948 51,800 9 1986 6,140 1943 16,000 1966 55,000 1978 50,600 10 1951 6,090 1975 13,200 1978 54,200 1965 46,200 11 1993 6,080 1965 11,400 1950 54,000 1916 46,200 12 1965 5,690 1994 11,200 1969 53,500 1974 43,500 13 1962 5,650 1995 11,000 1893 53,300 1975 42,800 14 1996 5,400 1966 10,700 1965 52,000 1989 42,700 15 1994 5,000 1993 10,100 1999 50,000 1995 42,400 16 1943 5,000 1996 9,940 1975 42,800 1970 39,600 17 1966 4,760 1962 9,580 1989 39,600 1987 37,400 18 1984 4,710 1984 9,550 1883 38,600 1986 34,200 19 1947 4,610 1947 9,300 1947 35,000 1982 34,000 20 1944 4,360 1986 8,640 1995 34,800 1956 33,800
# Breakout flow = 2,200 cfs/Total Flow = 15,000 cfs. *All flows are in cubic feet per second
IV. FLOOD DAMAGES / FLOOD RECOVERY COSTS
In order to portray flood damages by jurisdiction and type and develop a summary of projected flood damages based on current population growth trends, the FDRT contacted the federal and state/provincial governmental agencies and non-governmental agencies that provide flood recovery assistance in the RRB.
Flood damage/recovery cost information from the various agencies and organizations that provided flood recovery assistance were often difficult to obtain. In general, the FDRT found that data, even from flooding events that occurred in the 1990’s, was often not kept in easily accessible electronic databases. Frequently, hard copies of the data/information had to be manually retrieved from the agencies’ or organizations’ reference/library files, requiring extensive time of their staff. Understandably, requests for data and information were often met with reluctance. No data were available from some agencies/organizations. In several instances, data was available but was not submitted to the FDRT. This report will be revised if additional information arrives.
Another problem encountered was the disparity in the detail of information
disaster relief/recovery programs are funded (cost-shared) by several federal agencies, such as FEMA, USDA, SBA, USDOT, and USACE, and the funds are funneled through the regional agency branches and the states’ departments of emergency management. Because several agencies, with specific agency programs and objectives, are involved in the funding, information was usually reported in more detailed categories.
Regional offices of the federal agencies and the North Dakota, South Dakota, and Minnesota state departments of emergency management were contacted to obtain flood damage recovery data. However, great disparity in information reporting between regional offices of the same agency and between the states’ departments of emergency management was also a problem. In most instances, data for the South Dakota portion of the RRB was unavailable.
Another difficulty associated with developing a comprehensive flood damage analysis, identified by the FDRT, is the lack of accounting for ineligible claims. Agencies do not usually maintain databases of claims that are not eligible for assistance. Even when agencies do maintain such databases, the number of ineligible claims is included, but not the dollar figure of ineligible claims.
Therefore, the FDRT is unable to completely satisfy the two objectives pertaining to analysis of flood damages. Due to an incomplete database, a complete breakdown of flood damage statistics by type and jurisdiction could not be prepared, nor could an accurate flood damage estimate for the entire RRB be developed. However, flood damage statistics that were received by the FDRT are presented below, following a description of the
agency/organization and programs that provided the statistics. Two flood damage categories, psychological and environmental, cannot be quantified. Instead, a qualitative discussion is presented for these two categories.
Canada
Emergency Preparedness Canada
The following information was adapted from the Emergency Preparedness Canada website (www.epc-pcc.gc.ca.html):
Emergency Preparedness Canada (EPC) is the civilian branch of the Canadian Department of National Defense. EPC is the Canadian Government’s primary agency responsible for national civil emergency preparedness. The main activities that EPC participates in include: Federal Civil Emergency Preparedness Planning; Federal-Provincial-Territorial Cooperation; International Cooperation; Research; Education, and Training.
The only EPC administered program directly related to flood recovery is the Disaster Financial Assistance Arrangements (DFAA). This program provides assistance to the provincial and territorial governments when the costs of disaster recovery are greater than costs these governments would normally manage. Only public and private property claims are eligible for DFAA assistance; business and agriculture losses are not eligible for federal
assistance. Additionally, the federal government does not share in the cost of upgrading property to standards higher than pre-flood conditions.
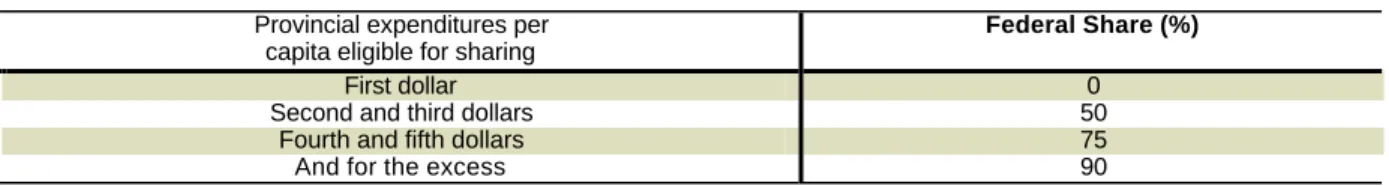
The federal financial contribution is determined according to a formula based on provincial population and federal guidelines for defining eligible costs. Since 1970, federal financial participation in disaster assistance arrangements has been determined by a "dollar-per-capita" formula. The first dollar per capita of damages is a provincial/territorial responsibility. Damages beyond that threshold level are eligible for federal assistance with the federal proportion rising with the damage (Table 4).
Table 4. The “Dollar-per-Capita” Formula for Federal Cost Sharing. Provincial expenditures per
capita eligible for sharing
Federal Share (%)
First dollar 0
Second and third dollars 50
Fourth and fifth dollars 75
And for the excess 90
Source: Emergency Preparedness Canada Web site.
Manitoba Emergency Management Organization (MEMO)
The following information was adapted from the Manitoba Government Services MEMO website (www.gov.mb.ca/gs/memo/index.html).
Manitoba Emergency Management Organization (MEMO) manages all phases of disasters including mitigation, preparedness and response, and recovery. MEMO is responsible for the Manitoba Emergency Plan; training and public information; planning/research, and administering the Disaster Financial Assistance and Recovery program.
The Disaster Financial Assistance and Recovery (DFAR) program is the only responsibility assigned to MEMO directly relating to flood recovery. The program provides recovery assistance to municipalities, individuals, non-profit organizations, full-time farmers, and small businesses. Evacuation, clean-up, and pre-emptive mitigation costs are eligible for reimbursement. Restoration or replacement costs of buildings and property to pre-flood condition are eligible, provided these costs are not covered by insurance.
MEMO provided flood recovery assistance numbers for both private and public entities in 48 Manitoba (Table 5). Total flood recovery assistance provided by MEMO totaled over 166.9 million from 1993 –1997. Total private claims were greatest in the Rural Municipality of Richot, MB with over $46 million in private flood recovery assistance during the three year period. The largest public claims and subsequent flood recovery assistance was provided to the Rural Municipality of Roland, MB which received more than $120.9 million for the same period (Table 6).
Table 5. MEMO Private Flood Recovery Assistance (1993 – 1997). Municipality 1993 1996 1997 Total Argyle, R.M. $29,930 $29,930 Armstrong, R.M. $3,072 $3,072 Brokenhead, R.M. $153,891 $3,951 $705,289 $863,131 Cartier, R.M. $11,980 $22,617 $181,164 $215,761 De Salaberry, R.M. $24,311 $61,429 $2,283,859 $2,369,599 Dufferin, R.M. $13,530 $2,275 $211,472 $227,277 East St. Paul, R.M. $109,136 $9,126 $1,159,226 $1,277,487 Emerson, Town $322,364 $322,364 Franklin, R.M. $699 $50,133 $2,370,366 $2,421,197 Grey, R.M. $1,598 $3,360 $754 $5,712 Hanover, R.M. $16,962 $291,966 $308,928 La Broquerie, R.M. $6,644 $50,155 $56,799 Lorne, R.M. $22,103 $65,520 $87,623 Louise, R.M. $9,410 $9,410 MacDonald, R.M. $174,920 $6,889 $4,310,586 $4,492,395 Montcalm, R.M. $1,669 $226,981 $7,552,506 $7,781,156 Morris, R.M. $68,235 $321,832 $13,856,610 $14,246,677 Morton, R.M. $1,086 $1,086 Pembina, R.M. $2,067 $12,805 $142,367 $157,239 Piney, R.M. $3,274 $1,968 $5,242 Portage La Prairie, R.M. $8,651 $68,145 $76,796 Reynolds, R.M. $22,700 $74,743 $806,033 $903,477 Rhineland, R.M. $13,074 $2,772,916 $2,785,989 Ritchot, R.M. $239,108 $552,610 $45,234,363 $46,026,080 Riverside, R.M. $1,862 $7,631 $9,493 Roblin, R.M. $2,206 $6,295 $66,540 $75,040 Rockwood, R.M. $63,985 $9,498 $6,261 $79,745 Roland, R.M. $3,155 $6,409 $131,565 $141,129
Roseau River Tribal Council $109,811 $109,811
Rosser, R.M. $620 $4,099 $4,719 Selkirk, R.M. $180,936 $73,547 $254,483 South Norfolk, R.M. $6,984 $6,984 Springfield, R.M. $188,282 $9,582 $405,467 $603,331 Stanley, R.M. $28,103 $70,132 $390,433 $488,668 Ste. Anne, R.M. $3,040 $818 $257,901 $261,758
Ste. Anne, Village, R.M. $0
Strathcona, R.M. $0 Stuartburn, R.M. $56,738 $24,263 $196,693 $277,694 St. Andrews, R.M. $74,295 $665,210 $739,505 St. Clements, R.M. $99,478 $280,345 $323,121 $702,944 St. Norbert, R.M. $0 Tache, R.M. $32,730 $34,853 $1,614,000 $1,681,583 Thompson, R.M. $10,738 $57,388 $68,127 Turtle Mountain, R.M. $24,395 $20,455 $44,850 Victoria, R.M. $1,245 $1,245 West St. Paul, R.M. $41,507 $30,000 $322,407 $393,914 City of Winnipeg $10,792,555 $196,237 $10,988,792 Woodlands, R.M. $5,228 $4,656 $9,885 TOTAL $12,433,380 $2,271,563 $86,913,185 $101,618,128
Table 6. MEMO Flood Recovery Assistance (Public Claims).
Municipality 1993 1996 1997 Total
Brokenhead, R.M. $13,964 $185,023 $198,987
Cartier, R.M. $22,309 $86,774 $109,084
Cooks Creek Conservation District $3,986 $3,986 De Salaberry, R.M. $24,369 $607,037 $631,406 Dufferin, R.M. $52,062 $52,488 $104,550 East St. Paul, R.M. $48,605 $503,464 $552,069 Emerson, Town $45,141 $545,534 $590,675 Franklin, R.M. $40,818 $2,219,643 $2,260,461 Grey, R.M. $25,474 $31,009 $56,484 Hanover, R.M. $502,196 $502,196 La Broquerie, R.M. $271,810 $271,810 Lorne, R.M. $1,402 $1,402 Louise, R.M. $52,832 $52,832 MacDonald, R.M. $41,081 $41,293 $2,534,481 $2,616,855 Montcalm, R.M. $114,625 $2,404,209 $2,518,834 Morris, R.M. $10,551 $211,040 $11,191,070 $11,412,660 Morris, Town $1,721 $260,640 $262,361 Morton, R.M. $17,270 $17,270 Pembina, R.M. $26,007 $221,659 $247,666
Pembina Valley Conservation District $15,504 $15,504
Piney, R.M. $25,777 $10,210 $35,987 Portage La Prairie, R.M. $87,745 $87,745 Reynolds, R.M. $15,985 $142,251 $158,236 Rhineland, R.M. $31,659 $528,678 $560,338 Ritchot, R.M. $424,146 $10,761,732 $11,185,877 Riverside, R.M. $20,137 $25,842 $45,980 Roblin, R.M. $33,895 $5,816 $21,383 $61,094 Rockwood, R.M. $106,362 $106,362 Roland, R.M. $25,521 $120,948,319 $120,973,840 Roseau River Tribal Council $25,000 $25,000
Rosser, R.M. $74,890 $74,890
South Norfolk, R.M. $32,793 $13,812 $46,605
Springfield, R.M. $161,092 $553,949 $715,041
Stanley, R.M. $12,853 $180,612 $193,465
Ste. Anne, R.M. $24,656 $146,740 $171,396
Ste. Anne, Village, R.M. $135,367 $135,367
Stuartburn, R.M. $24,304 $38,223 $62,527 St. Andrews, R.M. $25,894 $95,383 $844,060 $965,337 St. Clements, R.M. $33,050 $283,052 $1,379,858 $1,695,959 Tache, R.M. $19,952 $168,661 $805,155 $993,768 Thompson, R.M. $17,993 $24,551 $42,544 Victoria, R.M. $3,819 $3,819 West St. Paul, R.M. $617,081 $617,081 City of Winnipeg $3,131,975 $59,085 $3,191,061 Woodlands, R.M. $36,158 $26,290 $62,448 TOTAL $3,395,126 $2,095,530 $159,148,199 $164,638,856
The FDRT requested a breakdown of statistics by municipality and category, such as infrastructure, businesses, and residential. However, this information was not provided to the FDRT.
United States Public Assistance Programs
The following information was taken from the International RRB Task Force’s Interim Report to the International Joint Commission:
Disaster assistance in the United States is managed through the operating programs of governments at all levels. Local Divisions of Emergency Management prepare and maintain the local emergency operating plans. Water Resource Districts, Watershed Districts and Conservation Districts provide local assistance with levees, emergency coordination, information distribution, and coordination with FEMA recovery personnel. States maintain Divisions of Emergency Management, which provide statewide systems for disaster preparation, response, recovery and mitigation. State health agencies provide information and exercise regulatory powers for disease control, food and lodging, food safety, maternal and child health, municipal facilities, waste management and water quality.
State Transportation Departments maintain and repair damaged roadways and provide technical assistance to communities during emergencies. Governors and the federal
government can deploy National Guard units quickly and effectively in the wake of disaster declarations. Several state agencies, such as the North Dakota State Water Commission and the Minnesota Department of Natural Resources (Division of Waters), provide flood control design and construction, distribute flood advice, and also offer emergency information and coordination services.
Federal disaster assistance is made available when the governor certifies to the President that the disaster is beyond the capability of the state and local governments. When the President declares a disaster, FEMA coordinates the federal response. FEMA provides a comprehensive, risk-based, all-hazards emergency management program of preparedness, response, recovery and mitigation. FEMA generally assigns the Corps of Engineers the job of coordinating projects to increase water supplies and provide temporary housing, technical assistance, and coordination locally. The Corps constructs levees on an emergency basis. The National Weather Service provides forecasting and other information. The Small Business Administration offers disaster loans to homeowners, renters, and businesses to cover uninsured losses. The US Department of Agriculture provides emergency food assistance to those forced from their homes, logistical and transportation support to FEMA, low-cost loans to replace farm buildings, and federal crop insurance. The US Department of Transportation administers the Emergency Relief Program, which reimburses states for emergency work and damage to federal-aid highways.
The following agencies provide flood recovery assistance to public entities: • Federal Emergency Management Agency (FEMA)
§ Public Assistance Program
§ Mission Assignments
§ State Departments of Emergency Management • US Department of Transportation (USDOT)
• US Army Corp of Engineers (USACE) • US Department of Agriculture
§ Rural Utilities Service
FEMA Public Assistance Program
The following information was adapted from the FEMA website (www.fema.gov): States, local governments, Indian tribes, and certain private non-profit (PNP)
organizations are eligible for supplemental Federal disaster grant assistance. The assistance may be used for the repair, replacement, or restoration of disaster-damaged, publicly owned, or certain PNP owned facilities. FEMA provides a minimum of 75% of eligible costs, including emergency measures and restoration (Appendix A). The state determines how the remaining share, up to 25%, is split with the applicants. Assistance is separated into the following categories:
• Category A - Debris Clearance: Clearing of disaster-caused debris from public and private property.
• Category B - Emergency Protective Measures: Search and rescue, flood fighting and similar emergency operations.
• Category C - Roads and Bridges: Restoration of damaged road systems such as washed out roads and culverts.
• Category D - Water Control Facilities: Restoration of damaged dams, levees, drainage ditches and similar facilities.
• Category E - Buildings and Equipment: Restoration of damaged buildings, building contents and equipment.
• Category F - Utility Systems: Restoration of water, sewer, and electric utilities, including plants and distribution systems.
• Category G - Parks, Recreation, and Other: Restoration of parks, recreation facilities and other types of damaged facilities that do not fit in other
categories.
• FEMA Mission Assignments: When FEMA receives requests from state governments that exceed FEMA’s ability to assist, FEMA assigns a Mission Assignment and FEMA funding to other appropriate federal agencies.
North Dakota
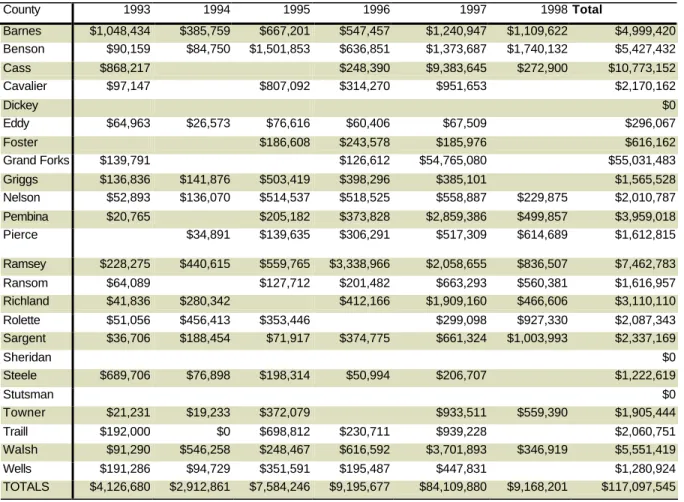
FEMA paid more than $117 million to North Dakota Counties in flood recovery assistance for the period 1993 – 1998. Grand Forks County received over $55 million in FEMA assistance since 1993.
Table 7. ND FEMA Public Assistance Totals County 1993 1994 1995 1996 1997 1998 Total Barnes $1,048,434 $385,759 $667,201 $547,457 $1,240,947 $1,109,622 $4,999,420 Benson $90,159 $84,750 $1,501,853 $636,851 $1,373,687 $1,740,132 $5,427,432 Cass $868,217 $248,390 $9,383,645 $272,900 $10,773,152 Cavalier $97,147 $807,092 $314,270 $951,653 $2,170,162 Dickey $0 Eddy $64,963 $26,573 $76,616 $60,406 $67,509 $296,067 Foster $186,608 $243,578 $185,976 $616,162 Grand Forks $139,791 $126,612 $54,765,080 $55,031,483 Griggs $136,836 $141,876 $503,419 $398,296 $385,101 $1,565,528 Nelson $52,893 $136,070 $514,537 $518,525 $558,887 $229,875 $2,010,787 Pembina $20,765 $205,182 $373,828 $2,859,386 $499,857 $3,959,018 Pierce $34,891 $139,635 $306,291 $517,309 $614,689 $1,612,815 Ramsey $228,275 $440,615 $559,765 $3,338,966 $2,058,655 $836,507 $7,462,783 Ransom $64,089 $127,712 $201,482 $663,293 $560,381 $1,616,957 Richland $41,836 $280,342 $412,166 $1,909,160 $466,606 $3,110,110 Rolette $51,056 $456,413 $353,446 $299,098 $927,330 $2,087,343 Sargent $36,706 $188,454 $71,917 $374,775 $661,324 $1,003,993 $2,337,169 Sheridan $0 Steele $689,706 $76,898 $198,314 $50,994 $206,707 $1,222,619 Stutsman $0 Towner $21,231 $19,233 $372,079 $933,511 $559,390 $1,905,444 Traill $192,000 $0 $698,812 $230,711 $939,228 $2,060,751 Walsh $91,290 $546,258 $248,467 $616,592 $3,701,893 $346,919 $5,551,419 Wells $191,286 $94,729 $351,591 $195,487 $447,831 $1,280,924 TOTALS $4,126,680 $2,912,861 $7,584,246 $9,195,677 $84,109,880 $9,168,201 $117,097,545
Source: North Dakota Department of Emergency Management.
South Dakota
Flood-related disaster declarations were not declared from 1990 to present for RRB South Dakota counties. Therefore, FEMA assistance was not provided.
Minnesota
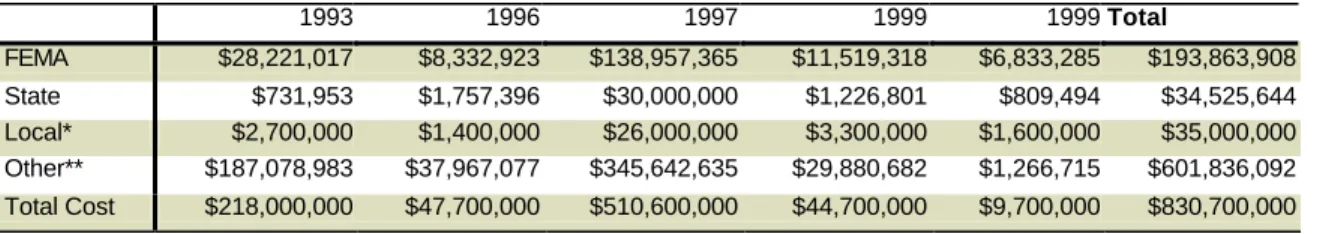
Information was obtained from the Minnesota Department of Public Safety, Division of Emergency Management’s “A Decade of Minnesota Disasters.” Data were only available on a disaster declaration basis (Table 8) and only aggregate cost per each disaster declaration was provided. Flood damage and recovery costs for each county were not available. For example, in 1993, FEMA declared a disaster (993-DR-MN) because 57 MN Counties experienced severe storms, tornado and flooding resulting in over $218 million in disaster payment by FEMA. It is unknown how much of these dollars were allocated to RRB Counties.
Federal expenditures for the five declared disasters were $193.8 million. Assuming ½ of this total was for RRB flood recovery, disaster payments for MN totaled roughly $150 Million.
Table 8. Disaster expenditures in MN (1993 – 1999)
1993 1996 1997 1999 1999Total FEMA $28,221,017 $8,332,923 $138,957,365 $11,519,318 $6,833,285 $193,863,908 State $731,953 $1,757,396 $30,000,000 $1,226,801 $809,494 $34,525,644 Local* $2,700,000 $1,400,000 $26,000,000 $3,300,000 $1,600,000 $35,000,000 Other** $187,078,983 $37,967,077 $345,642,635 $29,880,682 $1,266,715 $601,836,092 Total Cost $218,000,000 $47,700,000 $510,600,000 $44,700,000 $9,700,000 $830,700,000 * Estimate
** Includes all other expenditures (i.e. insurance claims).
Source: Minnesota Department of Public Safety, Division of Emergency Management’s “A Decade of Disasters.”
Department of Transportation
The following information was taken/adapted from the US DOT website (www.dot.gov):
The Federal Highway Administration (FHWA), a division of the US Department of Transportation (USDOT) administers an Emergency Relief (ER) Program for the repair or reconstruction of Federal-Aid Highways and roads on Federal lands damaged due to natural disasters. The ER program supplements the states’ and other agencies’ resources when recovery costs are greater than those entities can bear.
ER funds are not intended to cover all damage repair costs nor interim emergency repairs that will necessarily restore pre-disaster conditions. State and local highway agencies must expect additional expenditures, changes in project priorities, and some inconvenience to traffic as a result of emergency conditions. State and local governments are responsible for planning and providing for extraordinary conditions. Economic hardship is not a factor in determining repair eligibility. There is no nationwide definitive monetary break point
between what is considered routine and extraordinary repair expenses. Generally, however, the FHWA has determined that eligible ER repair activities in a state in the range of
$500,000 or more are significant enough to justify approval of ER funds.
By law, the FHWA can provide up to $100 million in ER funding to a state, including federal agencies, for each natural disaster or catastrophic failure event that is found eligible for funding under the ER program (commonly referred to as the $100 million per state cap). Also, the total ER obligations for US Territories (American Samoa, Commonwealth of Northern Mariana Islands, Guam, and Virgin Islands) is limited to $20 million in any fiscal year. For a large disaster that exceeds the $100 million per state cap, Congress may pass special legislation lifting the cap for that disaster.
Emergencyrepairwork to restore essential traffic, minimize the extent of damage, or protect the remaining facilities, accomplished in the first 180 days after the occurrence of the
disaster, may be reimbursed at 100 percent federal share. During this 180-day period, permanent repair work is reimbursed at normal pro rata share unless it is performed as part of emergency repair work.
US DOT flood recovery statistics could not be obtained.
Army Corps of Engineers
The following information was taken/adapted from the US Army Corps of Engineers (USACE) website (www.mvp.usace.army.mil):
USACE may provide emergency assistance for flood response and post flood response activities to save lives and protect improved property (i.e., public facilities/services) during or following a flood or coastal storm. Assistance to individual homeowners and businesses is not permitted, including agricultural lands. Emergency Operations assistance will be undertaken to supplement state and local efforts. Non-federal interests must commit all available resources. This includes manpower, supplies, equipment, funds, etc. Flood fighting measures are applicable to any flood control structures or other areas that provide public service, regardless of whether it is federal, public, or private. USACE has no authority under Public Law 84-99 to reimburse locals for costs of their own emergency activities. USACE assistance terminates when the emergency is over (i.e., flood waters have receded within top bank or some other predetermined stage).
USACE provides the following types of flood response assistance: • Assist in search and rescue operations.
• Furnish technical advice and assistance.
• Provide emergency repairs to levees and other flood control projects. • Furnish materials such as sandbags, polyethylene sheeting, lumber, pumps, or
rock for stabilization when the Corps is actively participating in a flood fight. • If the Corps is not actively participating in a flood fight, Government supplies
may be furnished only if local resources are exhausted or will be exhausted; supplies are replaced in kind or paid for by local interests. All unused stock must be returned or reimbursed by local interests to the Government at replacement cost.
Rural Utilities Service
Program statistics could not be obtained., however, general information on Rural Utilities Service programs taken from the USDA’s website (www.usda.gov), is provided below:
The United States Department of Agriculture’s Rural Utilities Service (RUS) provides RUS-financed electric and telecommunications cooperatives and companies with
technical and/or loan assistance when necessary for restoration of service after a natural disaster (these are on-going programs, not disaster assistance programs).
• RUS Water and Waste Disposal Loans and Grants Program
• This program may be used to develop, replace, or repair water and waste disposal (including storm drainage) systems in rural areas and towns having a population of 10,000 or less. Municipalities, counties, special-purpose districts, Indian tribes, and nonprofit corporations are eligible. Applicants must be unable to obtain credit from other sources (these are ongoing programs, not disaster assistance programs).
• Emergency Community Water Assistance Grants (ECWAG) Program • RUS may make grants to public bodies in rural areas and towns with a
population of 10,000 or less, private nonprofit corporations, political
subdivisions of a state, and Indian tribes. The decision of the USDA's Rural Development State office is based on applications received. Projects compete nationally for available funds under the provisions of the ECWAG Program.
United States Individual Assistance Programs
A number of US agencies provide flood recovery assistance directly to individuals following flood disasters. Services provided by theses entities range from psychological counseling to direct monetary compensation.
The following agencies provide flood recovery assistance to public entities:
• FEMA
§ Individual and Family Grant (IFG) Program (Cash Grants)
§ Crisis Counseling
§ National Flood Insurance Program (NFIP)
§ Disaster Housing Program • US Department of Labor
§ Disaster Unemployment Assistance • US Department of Agriculture
§ Food Assistance Program
§ Rural Development
• US Department of Housing and Urban Development
§ Community Block Development Grant
§ Public Housing
FEMA Individual and Family Grants Program
The following information was taken/adapted from the FEMA website (www.fema.gov): FEMA’s Individual and Family Grants Program (IFG) provides up to $13,600 in direct cash payments (adjusted annually for inflation) to help recover unmet necessary expenses and serious needs to individuals who do not qualify for low-interest loans and are not covered by insurance. The states administer this program, with FEMA providing 75% of the funds and non-federal governments providing the remaining 25 percent.
North Dakota
The following information was obtained from the ND Department of Emergency Management:
IFG provided more than $15.1 million to families in RRB Counties from 1993 – 1998. Grand Forks County residents received more than $10.3 million for the 1997 flood.
Table 9. North Dakota FEMA Individual and Family Grants Assistance.
County 1993 1997 1998 Total Barnes $136,894 $83,378 $500 $220,772 Benson $50,821 $145,637 $25,255 $221,713 Cass $280,059 $1,854,010 $47,458 $2,181,527 Cavalier $29,840 $46,100 $75,940 Dickey $55,620 $2,789 $58,409 Eddy $1,513 $15,672 $17,185 Foster $9,948 $9,948 Grand Forks $15,782 $10,325,299 $10,341,081 Griggs $6,370 $4,763 $11,133 Nelson $4,168 $21,670 $440 $26,278 Pembina $8,205 $200,322 $18,813 $227,340 Pierce $1,867 $7,499 $9,366 Ramsey $47,623 $165,338 $16,933 $229,894 Ransom $3,245 $86,072 $14,564 $103,881 Richland $2,132 $143,352 $36,267 $181,751 Rolette $145,239 $75,969 $74,779 $295,987 Sargent $1,923 $91,493 $90,575 $183,991 Sheridan $1,110 $1,746 $2,856 Steele $1,204 $3,396 $4,600 Stutsman $71,637 $38,145 $4,465 $114,247 Towner $7,984 $9,449 $7,184 $24,617 Traill $6,275 $240,633 $246,908 Walsh $16,445 $262,374 $18,856 $297,675 Wells $7,939 $38,016 $45,955 TOTAL $846,408 $13,920,269 $366,377 $15,133,054
Source: ND Department of Emergency Management. South Dakota
Flood-related disaster declarations were not declared from 1990 to present for RRB South Dakota counties. Therefore, FEMA IFG assistance was not provided.
Crisis Counseling Program
Short-term services to survivors of Presidentially declared major disasters are provided by FEMA through supplemental funds granted to state and local mental health agencies. Service is provided through two programs; the Immediate Service Program, which last 60 days following a declared disaster, and the Regular Program which lasts nine months following the 60 days of Immediate Service.
The FDRT was unable to obtain comprehensive cost statistics associated with this program. However, statistics from the North Dakota Department of Emergency Management and statistics from Minnesota agency/organization programs is presented below in the
Psychological Impacts section.
National Flood Insurance Program (NFIP)
FEMA’s Federal Insurance Administration manages the insurance component of the NFIP, and works closely with FEMA’s Mitigation Directorate, which oversees the floodplain management aspect of the program. The NFIP makes federally backed flood insurance available in communities that agree to adopt and enforce floodplain management ordinances to reduce future flood damage. NFIP provides Insurable Property and Personal Property coverage. Insurable Property is defined by NFIP as walled and roofed buildings anchored to permanent foundations; Personal Property refers to contents contained within insurable walled and roofed buildings.
A community participating in NFIP is usually provided with a Flood Insurance Rate Map (FIRM) and a detailed engineering study, termed a Flood Insurance Study (FIS), is often conducted. Under NFIP, more comprehensive floodplain management requirements are imposed on the community in exchange for higher amounts of flood insurance coverage.
The following information was obtained from the FEMA NFIP website
(www.fema.gov.nfip). Expanded tables of NFIP payments, including cities and townships, are included in Appendix B.
North Dakota
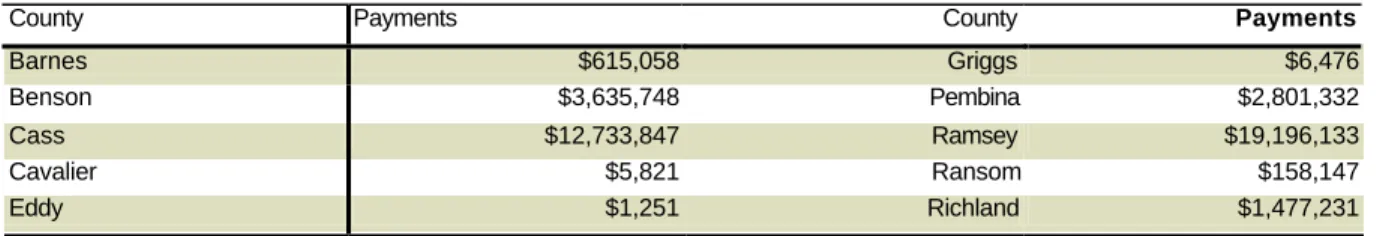
NFIP paid more than $118.4 million to North Dakota Counties as of September of 1998 (Table 10). Grand Forks County received the largest amount of NFIP payments with almost $73 million.
Table 10. North Dakota FEMA NFIP (as of 9/30/98).
County Payments County Payments
Barnes $615,058 Griggs $6,476
Foster $0 Sargent $1,437
Grand Forks $72,943,668 Traill $794,195
Grant $35,789 Walsh $4,010,149
Total (all counties) $118,416,289
Source: FEMA NFIP Website.
South Dakota
Flood-related disaster declarations were not declared from 1990 to present for RRB South Dakota counties. Therefore, federal assistance was not provided.
Minnesota
Minnesota residents insured by NFIP received over $57.6 million as of September 1998 (Table 11). The largest NFIP recipient was Polk County with over $35 million.
Table 11. Minnesota FEMA NFIP (as of 9/30/98).
County Payments County Payments
Becker $323,269 Marshall $5,299,571
Beltrami $2,887 Norman $1,911,587
Big Stone $196,851 Otter Tail $3,973
Clay $6,448,779 Pennington $17,422
Clearwater $2,000 Polk $35,308,223
Grant $1,041 Red Lake $8,241
Kittson $334,536 Roseau $7,993
Koochiching $7,732 Stevens $7,426
Lake of the Woods $0 Traverse $431,120
Mahnomen $3,219 Wilkin $7,296,842
Total (all counties) $57,612,712
NFIP payments in MN and ND combined totaled more than $176 million. Grand Forks County in North Dakota and Polk County in Minnesota received over 61% of the NFIP payments ($108.2 million), largely due flood damage in the cities of Grand Forks and East Grand Forks resulting from the flood of 1997.
Disaster Housing Program (DHA)
The following information was taken/adapted from the FEMA website (www.fema.gov):
FEMA's makes funds and services available to individuals whose homes are unlivable because of a disaster. All individuals are eligible regardless of residency and/or citizenship status, including undocumented aliens. The maximum period for disaster housing assistance is 18 months. DHA programs include Transient Accommodations Reimbursement (short-term lodging expenses following a disaster); Home Repair Assistance (reimbursement for the
cost of restoring their home to habitable conditions not to exceed $10,000); Alternative Housing Assistance (includes rental assistance, government owned/assisted housing, mortgage and rental assistance).
North Dakota
The following information was obtained from the North Dakota Department of Emergency Management:
Over $63 million was provided to 24 North Dakota Counties in the RRB from 1993 – 1998 (Table 12). Grand Forks County received over $44 million in 1997.
Table 12. North Dakota FEMA Disaster Housing Assistance.
County 1993 1997 1998 Total Barnes $122,018 $162,264 $61,150 $345,432 Benson $330,429 $462,611 $80,012 $873,052 Cass $2,987,880 $2,619,604 $126,198 $5,733,682 Cavalier $861,870 $316,291 $1,178,161 Dickey $2,269 $151,411 $35,392 $189,072 Eddy $67,533 $58,749 $126,282 Foster $122,468 $122,468 Grand Forks $356,992 $44,786,407 $45,143,399 Griggs $233,331 $58,147 $291,478 Nelson $214,301 $114,872 $23,278 $352,451 Pembina $160,301 $619,234 $13,776 $793,311 Pierce $27,784 $52,831 $80,615 Ramsey $925,911 $327,944 $123,523 $1,377,378 Ransom $18,288 $249,496 $67,240 $335,024 Richland $141,745 $568,463 $92,436 $802,644 Rolette $457,069 $444,249 $536,362 $1,437,680 Sargent $47,416 $161,487 $187,880 $396,783 Sheridan $21,826 $30,143 $51,969 Steele $118,482 $46,363 $164,845 Stutsman $1,687,554 $219,300 $15,377 $1,922,231 Towner $99,907 $163,370 $82,652 $345,929 Traill $114,267 $353,062 $467,329 Walsh $306,627 $525,100 $70,084 $901,811 Wells $131,966 $84,256 $216,222 TOTAL $9,407,982 $52,673,075 $1,568,191 $63,649,248 South Dakota
Minnesota
Information was obtained from the Minnesota Department of Emergency
Management’s “A Decade of Minnesota Disasters”; information was only available on a disaster declaration basis. FDRT was not able to determine what proportion of the costs were incurred by non-RRB counties. Therefore, most of the data presented is an
over-representation of the actual recovery costs incurred. The data are presented above in Table 10.
US Department of Labor’s Disaster Unemployment Assistance
The US Department of Labor’s Disaster Unemployment Assistance does not have standard disaster programs. In certain situations, unemployment insurance benefits may be available through the state unemployment office and supported by the US Department of Labor.
North Dakota
The following information was taken/obtained from the North Dakota Department of Emergency Management:
Disaster Unemployment Insurance totaled more than $540 thousand from 1993 – 1998 (Table 13). Cavalier County in northeastern North Dakota received $1.2 million for disaster related unemployment compensation from 1993 – 1998.
Table 13. North Dakota Disaster Unemployment Assistance
County 1993 1995 1997 1998 Total Barnes $2,164 $201,892 $76,509 $76,391 $356,956 Benson $30,909 $54,919 $29,688 $142,486 $258,002 Cass $93,924 $5,979 $114,747 $59,423 $274,073 Cavalier $141,011 $610,938 $352,381 $99,642 $1,203,972 Dickey $0 Eddy $7,735 $35,641 $18,793 $630 $62,799 Foster $1,193 $92,048 $52,258 $1,496 $146,995 Grand Forks $37,697 $32,705 $900,963 $3,769 $975,134 Griggs $27,578 $45,411 $15,554 $95 $88,638 Nelson $59,327 $81,683 $40,606 $22,214 $203,830 Pembina $16,508 $24,815 $144,007 $7,159 $192,489 Pierce $1,440 $18,269 $12,210 $331,716 $363,635 Ramsey $91,799 $174,590 $110,169 $122,833 $499,391 Ransom $7,600 $22,710 $10,338 $108,912 $149,560 Richland $139,979 $9,048 $30,457 $130,567 $310,051 Rolette $76,227 $196,904 $92,259 $325,062 $690,452 Sargent $17,384 $38,435 $20,758 $119,409 $195,986 Sheridan $0 Steele $5,705 $89,132 $15,936 $0 $110,773 Stutsman $0 Towner $58,190 $189,492 $19,802 $284,814 $552,298 Traill $37,586 $174,191 $90,374 $0 $302,151 Walsh $233,673 $174,546 $107,259 $24,915 $540,393 Wells $233,673 $94,004 $53,835 $7,154 $388,666 TOTAL $1,321,302 $2,367,352 $2,308,903 $1,868,687 $7,866,244
South Dakota
Flood-related disaster declarations were not declared from 1990 to present for RRB South Dakota counties. Therefore, federal assistance was not provided.
Minnesota
Disaster Unemployment Insurance information was unavailable.
United States Department of Agriculture (USDA) Food and Nutrition Service
The following information was taken from the USDA website (www.usda.gov): USDA Food Distribution Program regulations provide that foods donated for school food service and other Food and Nutrition Service programs may be released to relief organizations that prepare congregate meal service in situations of distress. Additionally, the Secretary of Agriculture may authorize State/local agencies to make available disaster food stamp assistance during any disaster that disrupts commercial channels of food distribution if such assistance is determined to be necessary and commercial channels of food distribution have again been restored. Such assistance may be determined to be necessary, if, as a result of the disaster, income or resources are reduced or inaccessible, and households need food assistance that cannot be met by the regular Food Stamp Program procedures. In certain circumstances, the Secretary of Agriculture may also authorize the distribution of food for household consumption. Program statistics were not available.
Rural Development’s Rural Housing Service
The following information was taken from the USDA website (www.usda.gov): This program provides subsidized direct and guaranteed loans to low-income rural residents and communities in need of housing or community facilities. Existing borrowers are offered loan forbearance, when needed, to recover from the effects of a natural disaster. Program statistics were not available.
Rural Business Service
The following information was obtained from the USDA’s website (www.usda.gov): Rural Business Service provides direct and guaranteed rural economic loans and
grants and rural business enterprise grants to businesses and cooperatives affected by natural disasters. Program statistics could not be obtained.
Housing and Urban Development Community Block Development Program
The following information was taken/adapted from the HUD website (www.hud.gov): Grantees (metropolitan cities, urban counties and states) may request that awarding of annual Community Development Block Grant (CDBG) and HOME Investment Partnerships (HOME) funds be expedited or that program year start dates be moved up. Grantees may reprogram funds for disaster recovery activities. HUD may provide statutory (for
Presidentially declared disasters) and regulatory waivers in the CDBG and HOME programs to increase the flexibility and the effectiveness of using funds for disaster recovery.
Public Housing
Public housing authorities may reprogram Comprehensive Grant Program (Comp Grant) or older modernization programs' funds to address damage to public housing property caused by the disaster. HUD will expedite requests for reprogramming from smaller public housing authorities that receive Comprehensive Improvement Assistance Program (CIAP) funds.
Mortgage Assistance from HUD's Federal Housing Administration (FHA)
For a Presidentially declared disaster, FHA makes available mortgage insurance for disaster victims under the Section 203(h) special mortgage insurance program. This program provides 100 percent financing, with no down payment requirement, for individuals and families whose homes were destroyed or substantially damaged. The program allows mortgagors whose homes are completely destroyed to qualify for a new FHA-insured mortgage loan without consideration of the existing mortgage payments. This allows a higher loan to value ratio and allows the homeowner to begin the mortgage application process while insurance settlements are being processed. The mortgagor must satisfy existing debt prior to approval of any new mortgage debt.
The program also places a 90-day moratorium on foreclosures (both initiation of foreclosures and foreclosures in process) for properties directly affected by the disaster. In addition, HUD "strongly recommends" loan service actions for homeowners whose
properties were directly affected by the disaster. These actions may include special forbearance, mortgage modification, refinancing, and waiver of late charges.
Assistance from the Government National Mortgage Association
The program encourages all single-family, manufactured housing, and multifamily Ginnie Mae issuers to provide as much forebearance as possible to mortgagors in areas
receiving a Presidential disaster declaration. The program also authorizes issuers of Ginnie Mae pools containing loans on properties damaged by the Presidentially-declared disaster to buy loans out of the pools for the remaining principal balance of each loan, regardless of whether the loans are delinquent before such repurchase. This new authority should assist homeowners, whose homes have been directly damaged by the storms and tornadoes, avoid becoming delinquent on their loan payments which can lead to default and foreclosure. Issuers must request written permission to buy such loans out of existing pools.
North Dakota
Information could not be obtained.
South Dakota
Flood-related disaster declarations were not declared from 1990 to present for RRB South Dakota counties. Therefore, federal assistance was not provided.
Minnesota
The Housing and Urban Development Agency provided over 20 million to 8 MN counties from 1993 – 1997 (Table 14).
Table 14. Minnesota HUD Assistance.
Local Governing Unit 1993 1994 1997 Total
Big Stone County $471,051 $471,051
Moorhead $1,698,000 $1,713,000 $3,411,000
Kittson County $304,414 $304,414
Marshall County $1,054,867 $1,054,867
Pennington County $10,078 $10,078
East Grand Forks $20,469,522 $21,965,120
Traverse County $78,643 $78,643
Wilkin County $364,968 $364,968
TOTAL $1,698,000 $1,713,000 $20,469,522 $23,880,522
Source: MN Department of Housing Finance Authority
Small Business Administration (SBA)
The following information was taken/adapted from the SBA’s website www.sbaonline.sba.gov:
SBA offers financial assistance to those trying to rebuild their homes and businesses in the aftermath of a disaster through the Disaster Loan Program. SBA can only approve loans to applicants with a reasonable ability to repay the loan and other obligations from
some cases). As required by law, the interest rate for each loan is based on SBA's
determination of whether each applicant does or does not have credit available elsewhere (the ability to borrow or use their own resources to overcome the disaster). Generally, over 90% of SBA's disaster loans are to borrowers without credit available elsewhere and have an interest rate of around 4%.
Only uninsured or otherwise uncompensated disaster losses are eligible. Disaster victims must repay SBA disaster loans. Secondary homes, personal recreational boats, airplanes, recreational vehicles and similar property are not eligible, unless used for business purposes. Property such as antiques and collections is eligible only to the extent of its functional value. Amounts for landscaping, swimming pools, etc. are limited.
SBA can refinance all or part of prior mortgages, evidenced by a recorded lien, when the applicant (1) does not have credit available elsewhere, (2) has suffered substantial
disaster damage (40% or more of the value of the property), and (3) intends to repair the damage. Refinancing of prior debts improves the victim's ability to afford the SBA disaster loan.
Use of SBA disaster loans for relocating is subject to limitations. Generally, victims may relocate where they need to, for reasons beyond their control. If the victim is forced by state or local authorities to relocate, the amount of eligibility is the replacement cost of the property, which must be abandoned.
To protect each borrower and SBA, SBA requires borrowers to obtain and maintain appropriate insurance. Borrowers of all secured loans (physical loans over $10,000 and economic injury loans over $5,000) must purchase and maintain full hazard insurance for the life of the loan. Borrowers whose property is located in a special flood hazard area must purchase and maintain flood insurance for the full insurable value of the property for the life of the loan.
Home Disaster Loan
Home Disaster Loans are loans to homeowners or renters to repair or replace disaster damages to real estate or personal property owned by the victim. Renters are eligible for their personal property losses. Home Loan amounts are limited by SBA regulation to
$200,000 to repair/replace real estate and $40,000 to repair/replace personal property. The actual amount of each loan, up to these maximums, is limited to the verified uninsured
disaster loss. Refinancing of existing mortgages on homes is eligible in some cases up to the amount of the loan for real estate repair/replacement. Loan amounts may be increased by up to 20% for devices to mitigate against damage to the real property of the same type as the disaster.
Business Physical Disaster Loans
Loans to businesses to repair or replace disaster damages to property owned by the business, including real estate, machinery, equipment, inventory, and supplies. Businesses of