*Corresponding author Wanying Liu
Email: [email protected] Tel: +86 028 83037420 Fax:+86 028 83037420
Article history
Received: February 27, 2015
Received in revised form: August 26, 2015 Accepted: September 23, 2015
Available online: January 23, 2016
A Dynamic Simulation of Annular Multiphase Flow during Deep-water
Horizontal Well Drilling and the Analysis of Influential Factors
Wanying Liu1, 2*, Ying Liu1, Guisheng Huang2, Jianhong Fu3, Yong Pan4, Yuhai Chen4, and Ambrish Singh4, 5
1 School of Material Science and Engineering, Sichuan University, Chengdu, Sichuan Province, P. R. China 2 Southwest Petroleum Engineering Co. Ltd. SINOPEC, Deyang, Sichuan Province P. R. China
3 State Key Laboratory of Oil and Gas Reservoir Geology and Exploitation, Southwest Petroleum University,
Chengdu, Sichuan Province, P. R. China
4 School of Material Science and Engineering, Southwest Petroleum University, Chengdu, Sichuan Province, P.
R. China
5 Department of Chemistry, School of Civil Engineering, LFTS, Lovely Professional University, Phagwara, Punjab,
India
ABSTRACT
A gas kick simulation model for deep-water horizontal well with diesel-based drilling fluid is presented in this paper. This model is mainly based on the mass, momentum, and energy conservation equations. The unique aspect of this model is the fluid-gas coupling and the change of mud properties after the gas influx from the formation. The simulation results show that the gas in an annulus dissolves first and it then escapes from the drilling fluid due to the gas solution in diesel. Therefore, it is possible to avoid existing gas hydrate by using oil-based drilling fluids. When gas kick occurred, it will be more dangerous, if the well has a longer horizontal section, a greater gas influx from the formation, and smaller displacement. The occurrence and development of overflow will be very quick in the condition of pumping; it will also be more dangerous, when diesel-based drilling fluid is used in the deep-water horizontal wells.
Keywords
: Deep-water Horizontal Well, Multi-phase Flow, Drilling Fluid, Diesel-based Drilling Fluid, Dynamic SimulationINTRODUCTION
The timely detection of overflow has become one of the most important factors to ensure the safety of a well, because the number of deep-water horizontal wells has increased dramatically
Journal of Petroleum Science and Technology 2016, 6(1), 98-108 http://jpst.ripi.ir categories, including empirical models [2],
mechanism models [3], and numerical models [4]. However, those models could not simulate the process of gas invasion accurately because of the existence of deep water and the use of diesel-based drilling fluids [5], factors such as more complex wellbore temperature fields [6], gas solubility in the drilling fluids, and so on [7-9], cannot be ignored. Therefore, new multiphase governing equations need to be established to predict the occurrence and development of gas invasion and to analyze the influential factors.
Annulus Multiphase Flow Modeling and
Solution Method
Model Assumptions
(1) Hole shape was circular and the drill string and borehole were concentric, and the eccentric ones were ignored;
(2) The gas, liquid, and cuttings will be considered as an unsteady axial flow in the annulus;
(3) Invasion gas will flow at the same velocity at first, and the effects of cutting transport were neglected.
Modeling
The solubility and saturation pressure of gas must be taken into consideration, while using diesel-based drilling fluids. The new conservation of mass, momentum, and energy conservation equations are as follows.
(1) Continuity Equations
) , ( ) ( ) (
t gHgA ∂z gvgHgA =Qg−Qs H t ∂
+ ∂
∂ ρ ρ (1)
) , ( ) ( ) (
t lHlA ∂z lvlHlA =Qs H t ∂
+ ∂
∂ ρ ρ
(2) c c c c c
c v H A Q
z A H = ∂ ∂ + ∂ ∂ ) ( ) (
t ρ ρ (3)
Where, A (m2) is the cross-section area of the annulus m2. Hg, Hl, and Hc are the volume fractions of the gas, drilling fluids, and cuttings respectively. νg, νl, and νc are the return velocities of gas, drilling fluids, and cuttings respectively in m/s. ρg, ρl, and ρc denote the densities of gas, drilling fluids, and cuttings respectively in kg/m3. t(s) is the time. H (m) is the hole depth m. Qg (kg/s) is the production rates of gas. Qs(H,t) (kg/s) is the volume of gas dissolving at t and H. Qc (kg/s) is the production rates of cuttings.
(2) Momentum conservation equations
0 ) ( ) ( cos ) ( ) ( 2 2 2 = ∂ ∂ + ∂ ∂ + + + + + + ∂ ∂ + + + ∂ ∂ z F A z Ap H H H Ag v H A v H A v H A z v H A v H A v H A t s c c ls l g g c c c l l ls g g g c c c l l ls g g g ρ ρ ρ θ ρ ρ ρ ρ ρ ρ (4)
Where, Fs (Pa) is friction loss. θ (deg) stands for
inclination at Hole-depth. P (Pa) denotes annular
pressure and ρls (kg/m3) represents the density
of drilling fluid with the solution of gas [10].
(3) Energy Conservation Equations
equations can be driven [12]: 2 2 2 2 1 cos 2 1 cos 2 1
( ( cos ))
2
1
( ( cos ))
2
1 1
2 ( ) ( )
g g g
ls l l
g g
ls l
ei a a t
H h v A
t
H h v A
t
w h v g
Z
w h v g
Z
T T T T
a b ρ θ ρ θ θ θ ∂ + − ∂ ∂ + + − ∂ ∂ + − − ∂ ∂ + − − ∂ = − − − (5)
where, ( )
2 1 c a co D a co c k U r T U r k
a= +
π andb 2πrtiUt 1
= .
Energy conservation equation in the drill pipe is given by:
2
2
1
( cos )
2
1
( cos )
2
4 ( )
ls l t l
ls l
t i t a t
H A h v g
t
w h v g
Z
r U T T
ρ θ θ π ∂ + − ∂ ∂ + + − ∂ = − (6)
where, wg and wls (kg/s) are the mass flow rates of gas and liquid phases respectively. h (J) stands for enthalpy, including intrinsic energy and kinetic energy. vl (m/s), At (m2), Ta (°C), Tci (°C), and Tt (°C)represent the velocities of liquid, the cross-section area of the drill pipe, the temperatures in annulus, the temperatures of formation/sea water, and the temperatures of drill pipe Respectively; TD is a dimensionless temperature [14]. rco and rti are the outside diameter of return line and the inside diameter of drilling pipe in meter. Ua, and Ut W/(m2.°C); represent
overall heat transfer coefficients in the annulus and drill pipe in Kc (W/m.°C), rco (m), and rti (m) stand for the heat conductivity of formation or sea water, the outside diameter of return line, and the inside diameter of drilling pipe respectively.
(4) The Calculation of Gas Solubility
Under specified conditions of temperature and pressure, the solubility of gas was calculated by the following equations:
(
1- -)
m sw w so w c
R =R ×f +R × f f (7)
145.038 0.1778. 9 32 5 n so b P R c a T = + + 2 9 0.1778. 32 5 sw
R = A+BT +C + T ×scc
a, b, c, and n are the empirical constants, which are listed in Table 1; scc is salinity correction coefficient. 2 7 10 06 . 3 00849 . 0 5601 .
5 P P
A= + − × −
P B=−0.03484−4×10⁻⁵
P C=6.0×10⁻⁵+1.51×10⁻⁷
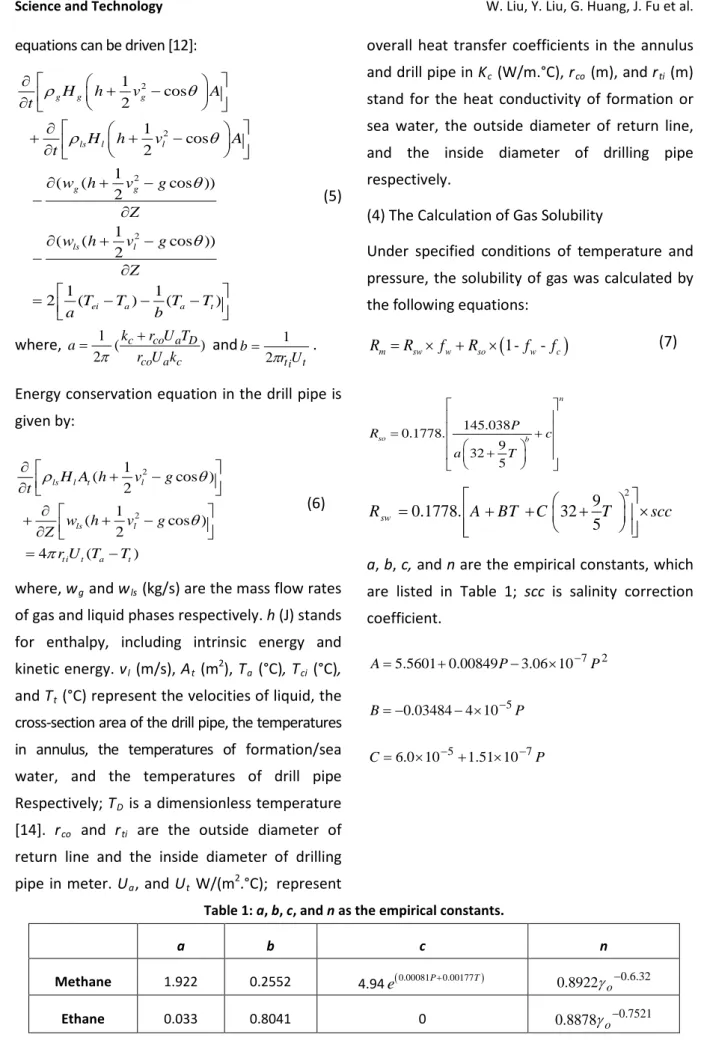
Table 1: a, b, c, and n as the empirical constants.
a b c n
Methane 1.922 0.2552 4.94 (0.00081P 0.00177T)
e + 0.8922γo−0.6.32
Ethane 0.033 0.8041 0 0.7521
8878 .
Journal of Petroleum Science and Technology 2016, 6(1), 98-108 http://jpst.ripi.ir
( )
5 9
exp 0.06 6.69 10 32 5 − = − + × + ×
scc T sc
where, Rm, Rso, Rsw, and sc are the gas solubility in drilling fluid, in oil, in water, and solid content
respectively. ϕW , φc, and γo are the volume
fractions of liquid, the volume fractions of cuttings, and the relative density of oil phase. P (MPa) is the annulus pressure and T (°C) is the annulus temperature.
When gas solubility reached saturation, the gas would not dissolve anymore; thus the saturation pressure (Pb) should be taken into account, while the model is established [10, 11]. If the annular pressure (P) is greater than the saturation pressure (Pb), P is then replaced by Pb in Equation 5, and the dissolved quantity of gas
) , (H t
Qs is calculated by Equation 7; but if
( , ) ( , )
s g
Q H t <Q H t , the surplus gas volume is
given byQs(H,t)−Qg(H,t), otherwise the gas is
dissolved completely and the single phase flow model will then be used.
(5) The Equation of Formation Seepage
A horizontal section drilled along a homogeneous reservoir, where minor changes in drilling conditions may provoke gas influx; this means gas influx can enter into the wellbore including both the bit and any location in the wellbore exposed to the gas-bearing formation. According to the equation of Renard and Dupuy, the productivity of horizontal gas well is obtained by [13, 14].
(
)
S L h r h L h x p p z Tp h K T Q w f sc h sc β π β β β ρ µ π + + + − = − 2 1 2 ln ) / ( ) ( cosh ) /( 8 . 2 1 g 2 2 sc (8)where, 4 0.5
] ) / 2 ( 25 . 0 5 . 0 [ /
2a L r L
x= = + + e and
] 1 ln[
) (
cosh−1 x = x+ x2− ;
Q
sc (kg/s) is the infiltration capacity of formation fluid (surface condition). Kh (10-3μm2), Kv (10-3μm2), h (m), pf (MPa), p (MPa), psc (MPa), T (K), Tsc (K) represent horizontal penetration rate, vertical penetration rate, drilled net pay thickness, formation pressure, bottom hole pressure, surface pressure, bottom hole temperature, and surface temperature respectively S, rw (m), γg, and β denote skin factor, borehole size, gas gravity, andanisotropy coefficient (β = Kh/Kv ) respectively.
L (m), Z, and μ stand for horizontal section length, gas deviation factor, and gas viscosity respectively.
Definite Conditions
(0, ) 1
c
P t = atm
(9) ) , ( ) ,
(H t Q Q H t
Qg = g − s
c
c H t Q
Q ( , )= ; Tt
( )
0,t =Tin( )
H t T( )
H tTt , = a ,
Where, Pc (0.1MPa), H (m), and Tin (°C) represent atmosphere pressure, the hole depth, and inlet temperature of drill string.
Solution of Model
Figure 1: Possible flow type in an annulus.
In Figure 1, Vsl and Vsg are the superficial velocity of the liquid phase and gas phase respectively.
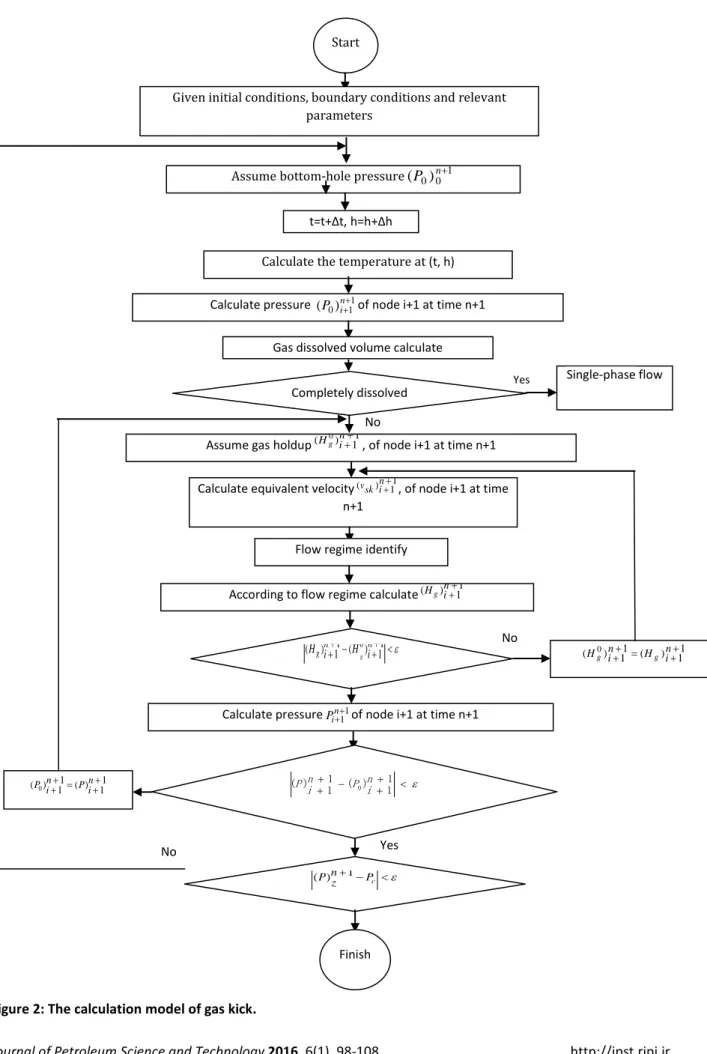
The calculation of characteristic parameters and pressure drop was difficult to be solved by analytical methods; therefore, the finite difference methods were used to simplify the theoretical model. Then, it could be solved by computer programming (Visual Basic 6.0). The calculation process is shown in Figure 2.
(1) Input the parameters above, generate mesh, and estimate the pressure of node i+1 at time n+1;
(2) Calculate the temperatures in the drill string and the annulus of node i+1 at time n+1;
(3) Confirm whether gas is completely dissolved at the pressure and temperature by using Equation 7; if not, then go to step 4, else the single phase flow model will be used;
(4) Calculate the density and other physical property parameters;
(5) Estimate the volume fractions of gas, liquid, and solid phases at node i+1 at time n+1; and compute the phase velocities of gas, liquid, and
solid with governing the equations of multiphase flow;
(6) Calculate phase volume fractions, if the error is within the allowed limits and go to next step, otherwise, return to (5);
(7) Substitute the parameters into the momentum equation and calculate the new pressure at note i+1 at time n+1, if the error is within the allowed limits, the estimated pressure is correct in step (1) and take the parameters at node i+1 as the data of node i+2, otherwise return to step (1).
Model-based Verification
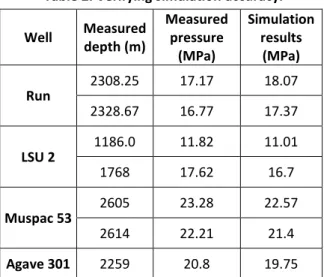
The oil field measured values [20-21] and simulation results were compared to evaluate the accuracy of this model. The simulation results are shown in Table 2.
Table 2: Verifying simulation accuracy. Well Measured depth (m) Measured pressure
(MPa)
Simulation results
(MPa) Run 2308.25 17.17 18.07 2328.67 16.77 17.37
LSU 2 1186.0 11.82 11.01
1768 17.62 16.7
Muspac 53 2605 23.28 22.57
2614 22.21 21.4
Agave 301 2259 20.8 19.75 The results showed that the accuracy of this model can meet the requirements; thus it can be used to simulate gas kick.
The Analysis of Influence Factors
Basic Data
(1) The program data of casing
Casing program data are tabulated in Table 3.
Vsg(m/s)
Vsl
(m
Journal of Petroleum Science and Technology 2016, 6(1), 98-108 http://jpst.ripi.ir Table 3: Casing program.
No. Hole depth (m)
Bit size (mm)
Casing OD (mm)
Casing ID (mm)
Casing shoe
(m) 1 1902.0 311.1 244.5 220.5 1900 2 3251.66 215.9
(2) The profile data of well
The profile data of well are listed in Table 4.
(3) Bottom-hole Assembly
Φ215.9mm Bit×0.25m+Φ172mm Motor×6.9m+ Φ165mm Non-Magnetic Drill Collar × 9.3m + Φ209mm Stabilizer×0.5m+Φ165mm Drill Collar × 40 m + Φ127mm Drill Pipe × 500 m + Φ139.7mm Drill Pipe.
(4) Relevant parameters
The density of drilling fluid was 1.25 g/cm3 (Oil / water was 8/2; the density of diesel was 0.85 g/cm3; the salinity of water was 20% and the solid content was 18%). Yield value (YP) was 9 Pa and plastic viscosity (PV) was 32 mPa.s. The water depth was 900 m and the true vertical depth (TVD) of gas reservoir was 2600 m. Temperature gradient was 2.6 °C/100m. The
temperature of sea surface was 26 °C. The outside diameter (OD) and the inside diameter (ID) of riser was 533.4 mm and 495.3 mm respectively. Displacement (Qm) and reservoir thickness were 30 l/s and 30 m respectively. The gas was methane. Formation permeability, porosity, skin factor, the rate of penetration (ROP), and the cutting density were 70 mD, 0.28, 1.5, 2 m/s, 2.6 g/cm3 respectively.
The Relationship of Gas Solubility and
Well Depth
The status of gas had a great influence on annular pressure. Therefore, gas solubility should be analyzed accurately. According to the theoretical model, different oil-water ratios of 7:3, 6:4, and 5:5 were simulated and the results are shown in Figure 3. Figure 3 show that gas solubility (methane) had the maximum value at a depth of 1172 m. The main reason is that gas solubility is reduced by the increase of temperature. At similar temperature and pressure, the results also show that diesel content has a great influence on gas solubility. In general, when gas kick occurs, the gas will be dissolved first, and will then escape from the drilling fluid. Thus it is possible to avoid existing gas hydrate by using diesel-based drilling fluid.
Table 4: Profile data of well.
Hole depth (m) Inclination (°) Azimuth (°) TVD (m) N/S (m) E/W (m) V.Sec (m) Dogleg (°/30m)
0.00 0.00 0.00 0.00 0.00 0.00 0.00 0.000
1800.00 0.00 90.00 1800.00 0.00 0.00 0.00 0.000
Figure 2: The calculation model of gas kick.
No
Calculate equivalent velocity(vsk)ni++11, of node i+1 at time
n+1
Flow regime identify
According to flow regime calculate(Hg)ni++11
1 1 ) ( 1 1 )
(H0g in++ = Hg ni++
No ε
< + + − + +11 ( ) 11 )
(H ni H0ni
g
g
Calculate pressure 1
1 + +
n i
P of node i+1 at time n+1
ε
< − +
c P n z P) 1 (
Finish Yes
ε
< + + − +
+11 ( ) 11 )
(Pin P0in 1
1 ) ( 1 1 )
(P0ni++ = Pni++
Start
Given initial conditions, boundary conditions and relevant parameters
Assume bottom-hole pressure 1 0 0)
(P n+
t=t+Δt, h=h+Δh
Calculate the temperature at (t, h)
Calculate pressure 1
1
0)
(P ni++ of node i+1 at time n+1
Gas dissolved volume calculate
Single-phase flow Yes
Completely dissolved
No
Assume gas holdup( ) 11
0 +
+ n i
Journal of Petroleum Science and Technology 2016, 6(1), 98-108 http://jpst.ripi.ir Figure 3: Relationship between gas solubility and
oil-water ratio.
Analysis of Influential Factors
(1) The analysis of the influence of gas influx on annulus fluid parameters
Diesel-based (Oil/Water was 8/2) and water-based drilling fluids, which had a similar density and parameters, were used to analyze this problem. The rate of gas influx (surface flow) was 0.2 m3/s, 1 m3/s, 3 m3/s, 5 m3/s and 8 m3/s respectively; no booster pumps and the wellhead choke manifold was opened completely. The distribution of annulus liquid holdup and annulus pressure are displayed in Figures 4 and 5 respectively; Qg(o) and Qg(w) are the rate of gas influx in the diesel-based drilling fluid and water-based drilling fluid respectively.
Figure 4: Relationship between liquid holdup and the value of gas influx.
Figure 5: The relationship between annulus pressure and the value of gas influx
Figure 4 shows that the liquid holdup decreases quickly with an increase in gas influx, especially, when the gas is near the wellhead. The main reasons are the compressibility of the gas, the solubility, and the release of gas. Figure 5 shows that gas influx has a little impact on annulus pressure, when oil-based drilling fluid is used, which is because of the solubility of the gas.
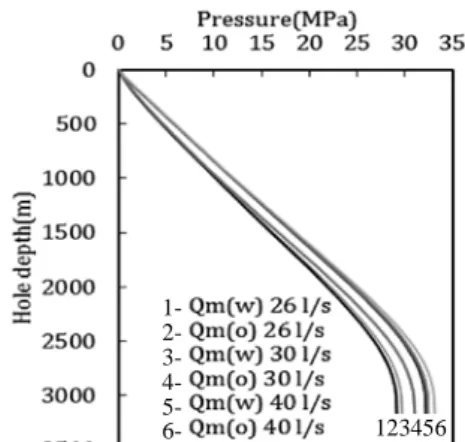
(2) The displacement impact on annulus fluid parameters
To analyze the displacement impact on annulus fluid parameters, the gas influx was measured to be 1 m3/s. The displacement (Qm) was equal to 26 l/s, 30 l/s, and 40 l/s respectively. The distribution of liquid holdup, annulus velocity, and annulus pressure profile are shown in Figures 6 to 8 respectively.
Figure 6: Relationship between liquid holdup and displacement.
1- 2- 3- 4- 5- 6- 1-
2- 3- 4- 5- 6- 7-
1- 2- 3- 4- 1-
2- 3-
3 2 1
1 234
7 6 1
2
3
4
5
6 4 2
Figure 7: Relationship between annulus pressure and displacement.
Figure 8: Relationship between annulus velocity and displacement.
Figure 6 shows that for a certain type of drilling fluid system, the displacement does not have a great impact on the annulus liquid holdup. Figures 7 and 8 show that the displacement is more sensitive to the annulus pressure and annulus velocity, which is because of the solubility of gas in the diesel.
Dynamic Simulation of Gas Kick
(1) Different kinds of drilling fluids versus time during gas kick
The length of the horizontal section was 200 m and the other parameters remain intact. The bottom-hole pressure versus time is depicted in Figure 9.
Figure 9 confirms that when gas kicks occurs, the bottom-hole pressure changes slowly at the beginning stage. But, it is rapidly declined with time
after the gas enters the deviated section. The bottom-hole pressure is a result of hydro-static pressure exerted by drilling fluid and the friction loss of return fluid in the annulus. More and more gas enters the wellbore with time, which reduces the hydro-static pressure. Although the influx of gas accelerates the annulus fluid velocity, the friction loss is increased correspondingly. It cannot catch up with the decline in hydro-static pressure. Meanwhile, it also enhances pressure difference, which accelerates gas production. When the gas escapes from wellbore, hydro-static pressure decreases. The bottom hole pressure curve showed nonlinear variation with time. The risk of well kick could be appropriately reduced by using oil-based drilling fluid. If gas invasion is found, well control measures should be taken timely and effectively.
Figure 9: Bottom-hole pressure versus time during gas kick.
(2) Different horizontal sections versus time during gas kick
The length of horizontal wellbore section was 200 m, 300 m, and 400 m respectively; other parameters were kept intact and water-based drilling fluid was chosen. The result is shown in Figure 10.
Figure 10 shows that the horizontal section length is different, but the bottom-hole pressure has a similar tendency. The lower bottom-hole pressure will cause the length of the horizontal wellbore section to be increased.
P
res
su
re (
M
P
a)
1- 2- 3- 4- 1-
2- 3- 4- 5- 6-
1-
2-
1 2 1 3 2 4
Journal of Petroleum Science and Technology 2016, 6(1), 98-108 http://jpst.ripi.ir Figure 10: Bottom-hole pressure versus time during
gas kick.
(3) Different displacements versus time during gas kick
The displacement (Qm) was 26 l/s, 28 l/s, and 30 l/s respectively; the length of the horizontal section was 200 m and the other parameters were constant. The result is illustrated in Figure 11.
Figure 11: Bottom-hole pressure versus time during gas kick.
Figure 11 displays that the greater the displacement becomes, the higher the bottom-hole pressure is. Because an increase in displacement accelerates the annulus fluid velocity, the friction loss increases consequently and the bottom-hole pressure becomes higher.
CONCLUSIONS
Due to the gas solution in diesel, the gas in annulus will be dissolved first and then can escape from the drilling fluid. Thus existing gas hydrate can be avoided by using the diesel-based drilling fluids.
The simulation results show that it is more
dangerous, if a well has a longer horizontal section length, greater gas invasion, and a smaller displacement, when gas kick occurs. The occurrence and development of overflow will be very quick in the condition of pumping and thus it will be more dangerous, when the oil-based drilling fluid is used. Therefore, when overflow is found, well control measures should be taken timely and effectively.
ACKNOWLEDGEMENTS
This work was financially supported by the National Natural Science Foundation of China (No. 51274170), the Open Fund Project (x151514kcl108), and the College Students Innovative and Entrepreneurial Training Program (201410615022).
REFERENCES
[1] Qingping L., “The Situation and Challenges for Deepwater Oil and Gas Exploration and Exploitation in China,” China Offshore Oil and Gas, 2006, 18, 130-133.
[2] Shi H., “Drift-Flux Parameters for Three-Phase Steady-State Flow in Wellbores,” Society of Petroleum Engineers, 2005, 10, 130-137.
[3] Bonizzi M. and Issar I., “On the Simulation of Three-phase Slug Flow in Nearly Horizontal Pipes Using the Multi-Fluid Model,” International Journal of Multiphase Flow, 2003, 29, 1719-1747.
[4] Lopez De.BM, Lahery R.T.Jr, and Jones
O.C., “Phase Distribution Inbubbly
Two-phase Flow in Vertical Ducts,” International Journal of Multiphase Flow, 1994, 20, 805-818. [5] Mingbiao X., Haixiong T., and Zhengli L.,
“Laboratory Studies of Deepwater Cement Slurry,” Journal of Oil and Gas Technology, 2005, 27, 613-616.
[6] Zhongming C. and Rudolf J. N., “Accurate Prediction Wellbore Transient Temperature Profile under Multiple Temperature Gradients:
1- 2- 3-
1 2 3 1-
2- 3-
Finite Difference Approach and Case History,” SPE 84583,Denver, Colorado, 2003.
[7] Yonghai G., Baojiang S., and Zhiyuan W., “Calculation and Analysis of Wellbore Temperature Field in Deepwater Drilling,” Journal of China University of Petroleum (Edition of Natural Science), 2008, 32, 58-62. [8] Song W., Mingquan S., and Erping L.,
“Development of Foreign Deepwater Drilling Fluid,” Petroleum Drilling Technology, 2009, 37, 8-12.
[9] Jianhong F., Chao X., and Zhi Z., “Gas Solubility Calculation in Oil Based Drilling Fluid During Deep Water Drilling,” Drilling & Production Technology, 2012, 35, 85-87. [10] Milton V. and Beggs H. D., “Correlations
for Fluid Physical Property Prediction,” Petroleum Technology, 1980, 32, 968-970. [11] Velarde J., Blasingame T. A., and McCain W. O.,
“Correlation of Black Oil Properties at Pressures below Bubble Point Pressure: a New Approach,” Journal of PetroleumSociety, PETSOC97-93,Calgary, Alberta, 1997.
[12] Liping C., Sunli H., and Bo N., “The Discussion of Productivity Equation for Horizontal Gas Well,” Journal of Southwest Petroleum University (Science & Technology Edition), 2009, 121-124.
[13] Zhiyuan W. and Baojiang S., “Annular Multiphase Flow Behavior during Deep Water Drilling and the Effect of Hydrate Phase Transition,” Petroleum Science,2009, 6, 57-63.
[14] Chunqiu G. and Yingchuan L., “Comprehensive Numerical Simulation of Pressure and Temperature in Gas Well,” Acta Petrolel Sinica, 2001, 22, 100-104.
[15] Taitel Y. and Barnea D., “Simplified Transient Simulation of Two Phase Flow Using Quasi Equilibrium Momentum Balances,” Multiphase Flow, 1997, 23, 493-501.
[16] Kaya A. S., Sarica C., and Brill J. P.,
“Comprehensive Mechanistic Modeling of Two-phase Flow in Deviated Wells,” SPE 56522, Houston, Texas, 1999.
[17] Lage A. C. V. M. andRune W., “Mechanistic Model for Upward Two-phase Flow in Annular Paper,” SPE 63127, Dallas, Texas. 2000.
[18] Nunes J O L., “Mathematical Model of a Gas Kick in Deep Water Scenario,” SPE 77253-MS., Jakarta, Indonesia, 2002. [19] Bonizzi M. and Issar I., “On the Simulation of
Three-phase Slug Flow in Nearly Horizontal Pipes Using the Multi-fluid Model,”
International Journal of Multiphase Flow, 2003, 29, 1719-1747.
[20] Carlos Perez-Tellez., “Improved Bottomhole Pressure Control for Underbalanced Drilling Operations.” Louisiana State University, 2003. [21] Perez-Tellez C., “A New Comprehensive,