Hungarian Association of Agricultural Informatics European Federation for Information Technology in Agriculture, Food and the Environment
Journal of Agricultural Informatics. Vol. 10, No. 1 journal.magisz.org
Analysis on key financial data of Hungarian dairy product manufacturing
enterprises
Szilvia Botos1, Róbert Szilágyi2, László Várallyai3, János Felföldi4
I N F O
Received 27 Aug 2019 Accepted 16 Sep 2019 Available on-line 30 Sep 2019 Responsible Editor: M. Herdon
Keywords:
Dairy processing, SMEs, regional analysis, financial analysis.
A B S T R A C T
After several years of decline, dairy herd and milk production have started to rise from 2011. Considering the first growth phase, in current article we analysed the enterprises operating in the dairy product manufacturing sector in the period of 2012-2016. Among the principal financial indicators, we have chosen RoA and RoE to determine the general financial situation of the enterprises and analyse the changes in the five-year period. Based on the literature review we made our analysis by dimensions of enterprise size categories. Income statement and balance sheet needed for calculating financial indicators of enterprises have been downloaded from EMIS. Enterprises involved in our analysis belonging to small, medium and large size category and mean representative sample as this sample covers 30% of the total population. Share of sample enterprises from key performance indicators is similar to the total population so we can consider our sample representative also in this respect. Total assets value of enterprises analysed increased in the five years under consideration, however, this growth is mainly due to the increase of assets of large enterprises. The share of large companies from the total assets rose by 7% during the five years (from 64% to 71%), while the share of small and medium sized enterprises fell. Considering small enterprises, the total value of the domestic sales revenue in 2016 declined by 30% below the level of 2012. In the first two years analysed, a significant recovery of export revenues was noted, the total value export sales revenues almost doubled from 2012 to 2014. Domestic sales revenues of medium sized enterprises in 2016 show only a small percentage difference compared to 2012, but the trend of export sales is similar to small companies. The increase of domestic and export sales revenue of large companies is slight but continuous. Indicators of RoA and RoE show dynamic increase for large companies during the five years. Medium sized enterprises also experienced growth, however, in the last the years considered there was a fall. RoA calculated for small enterprises became positive, but its value is volatile, while RoE clearly show a continuing decrease.
1. Introduction
The economic importance of the agro-food sector in Hungary has been on a declining trend for several decades. In 2016, the contribution of agriculture and food industry to GDP is 3,9% and 1,9%, respectively (HCSO). Despite the share from GDP, agricultural food production is still the main element to create value from soil (Schaller et al. 2018), its role in the national economy is indisputable, to ensure healthy and safe feed and food and make contribution to the potential of rural areas are among the national strategic plans. However, Hungarian companies operating in agricultural
1 Szilvia Botos
University of Debrecen [email protected] 2 Róbert Szilágyi
University of Debrecen
[email protected] 3 László Várallyai
University of Debrecen
[email protected] 4 János Felföldi
production and food industry face a difficult economic environment. Several economic factors (inter alia the growth of input prices, high price pressure by retail chains, the slow pace of technological upgrades and restructuring, heavy tax and administrative burdens, lack of horizontal and vertical cooperation etc.) have adversely affected them (FM 2015). The output of Hungarian agriculture and food industry was ~9.3 and 10.3 billion EUR (in current prices) respectively, in 2016. This performance is far below the values registered in developed economies, where the production value of food industry is two or three times higher than the production value of agriculture (VOSZ 2012). Development of food industry is a strategic target in Hungary and for this aim analysing enterprises operating in agro-food industry and measuring their performance are important research fields. Current article presents a financial analysis of milk processing companies.
Milk production and processing is one of the main agro-food sectors in Hungary, and Hungarian milk sector plays an important role in the Central-European region. Among Member States which acceded the European Union as from 2004, Hungary has the second largest share (1.2%) from the total EU-27 milk production, after Poland (6%) (Tacken et al. 2009). In 2016, the number of enterprises operating in milk production and milk processing sector was 741 and 80, respectively. After a decrease, the dairy herd has increased from 2011 onwards and since the low point in 2010 (309.2 thousand of pieces), the dairy herd size was almost 395 thousand of pieces in 2017 (HCSO). As indicated by Vőneki et al. (2015), with the grow of dairy herd, concentration has also increased for Hungarian milk producers. The last few years have also seen a growth in milk production, from 1890 million litres production in 2015 to 1915 million litres in 2017 (HCSO).
2. Methodology
Databases used for the analysis
The role of Hungarian regions in milk processing is illustrated by map visualization. Dairy cow herd size and number of enterprises operating in milk processing sector were used from database of Hungarian Central Statistical Office (hereinafter HCSO). Concerning territorial dimension, former indicator was available on county-level (NUTS-3), latter on settlement level for 2016. Balance sheet and financial statement required for calculating main financial indicators of enterprises operating in milk processing sector were downloaded from EMIS database. Database established from EMIS was compared with statistical data available in HCSO for two dimensions (size category and region). The result showed that EMIS contained approximately 30% of the total number of milk processing enterprises registered in HCSO and the division of sample enterprises is similar by both of two dimensions to the population. In this way, sample can be considered representative.
Sample
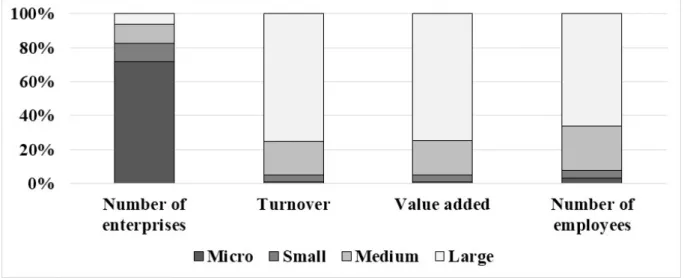
Structured enterprise statistics is available in Eurostat database which enables to filter database by different economic dimensions for individual sectors. The chart below (Figure 1) shows the share of enterprises operating in milk processing sector to some indicators by size categories.
Figure 1. Share of key indicators of dairy manufacturing sector by enterprise size categories (Data source: Eurostat)
It is apparent from Figure 1 that almost two-third of the enterprises belongs to the micro size category, however, it plays a marginal role in the performance of the sector.
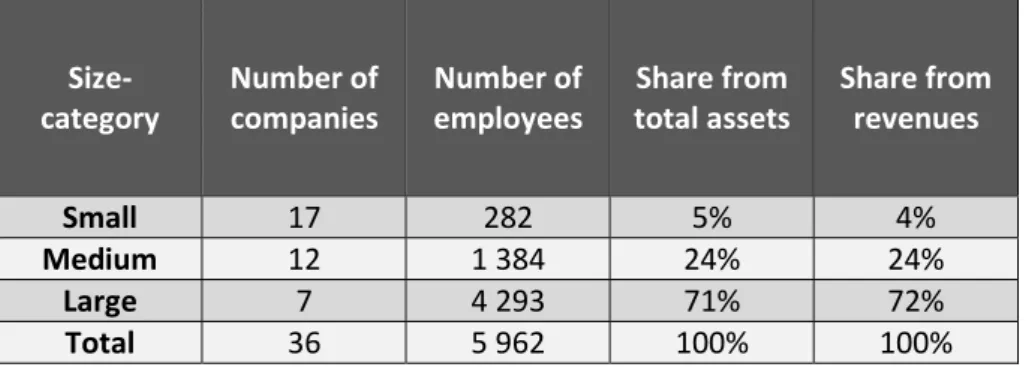
Table 1. Summary table of key information on enterprises involved into analysis
Size-category Number of companies Number of employees total assets Share from Share from revenues
Small 17 282 5% 4%
Medium 12 1 384 24% 24%
Large 7 4 293 71% 72%
Total 36 5 962 100% 100%
Main data about the sample involved into the analysis can be seen in Table 1. Sample number by size categories and the contribution of groups to the performance indicators are similar to the population. According to the Eurostat database, 127 enterprises operated in milk processing sector in 2016, thus the sample (37 enterprises) covers 30% of the total population. Given that the growth began in 2012, current study focuses on the period of 2012-2016. Database contained the two required financial reports for enterprises analysed, for the term above.
Grouping and homogeneity
Standard Deviation calculated for values of RoA, RoE and export rate of enterprises involved into the analysis was reduced through classification by size in each year. Two enterprises were excluded from the data set because of their outlier indicator values. Groupings by size category dimension lowered the value of Standard Deviation thus increasing the homogeneity of sub-samples created and in this way the means calculated for the groups are more suitable to characterise the sub-samples. Breakdown by enterprise size was the basis of our study since recent years have seen an increasingly importance of functional analyses for assessing performance and making rural development or business development decisions.
Financial indicators calculated
Data used for calculating the main financial indicators:
Net sales revenue
Export sales revenue
Profit after income tax
Total assets
Total equity
Domestic sales, export sales, total assets, ROA and ROE indicators were used for describing the general financial performance of milk processing enterprises and the results are presented by size categories. The indicators were calculated as follows:
Return-on-Assets (hereinafter RoA) = profit after income tax / total assets
Return-on-Equity (hereinafter RoE) = profit after income tax / total equity Export rate = export sales revenue / net sales revenue
3. Results
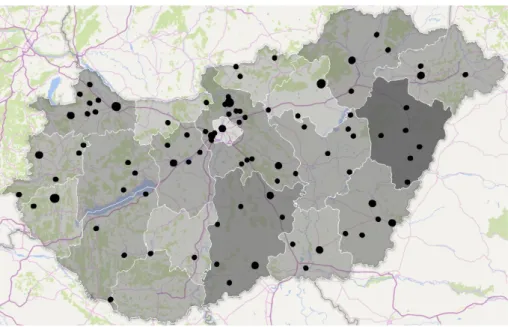
herd can be seen on the map. Former data was available on settlement level thus points show the location of the enterprises. The latter was county-level cumulative data and used for presenting the share of total herd.
Figure 2. Location of the enterprises operating in the dairy manufacturing sector and the share of dairy
herd by county (Data source: HCSO)
Black dots on the map indicate those settlements where at least one milk processing enterprise operates, the size of the dots refers to the number of organisations (two or three). Database of HCSO classifies 24 enterprises into Budapest by territorial dimension. Since it mainly means the head office of the companies, authors searched one-by-one the location of the processing unit of these companies and these settlements are marked on the map. The background colour of the county indicates the share of the total cow herd. It can be seen the largest herd belongs to Hajdú-Bihar county (~50 thousand head) and Bács-Kiskun county (~36 thousand head). Northern Great Plain, Southern Great Plain, Central Transdanubia and Western Transdanubia have the largest number of milk processing companies. Hajdú-Bihar county has the highest number of cows.
3.2 Overview on financial situation of Hungarian milk processing enterprises
First the tendency of domestic and export sales revenue was calculated from the financial statement of enterprises analysed. Table 2 summarizes the changes in the two indicators for years from 2012 to 2016, compared with 2012 base year.
For small enterprises, the domestic sales revenue was 17 percent higher in 2013 than in the base year, however, after 2013 it steadily decreased, and the value calculated for the last year under review is 30 percent lower than the base year level. There was a significant increase in exports in the first two year analysed; export sales revenues almost doubled from 2012 to 2014. It decreased in 2015 and 2016, however, did not fall below the level of 2012 as happened in the case of domestic sales.
Table 2. The change of domestic and export sales revenues by enterprise size categories
Domestic sales revenue (2012=100%)
Export sales revenue (2012=100%)
Small
Medium
Large
Large enterprises witnessed a smooth and steady annual increase in their domestic and export sales revenue. Further research should be undertaken to determine the causes and factors behind this tendency; however, efficiencies of scale and economies of scale may be a possible positive factor for predictable growth. Large companies have the potential supplying homogeneous products (sometimes under identical cost conditions) in large quantities. In this way, large companies have the opportunity to establish a long-term contractual relationship and become stable supplier, while small- and medium-sized enterprises the changes can be bigger. Economies of scale is affected by financial strength among others and total assets of enterprises under review was analysed by size classes. The result can be seen on Figure 3.
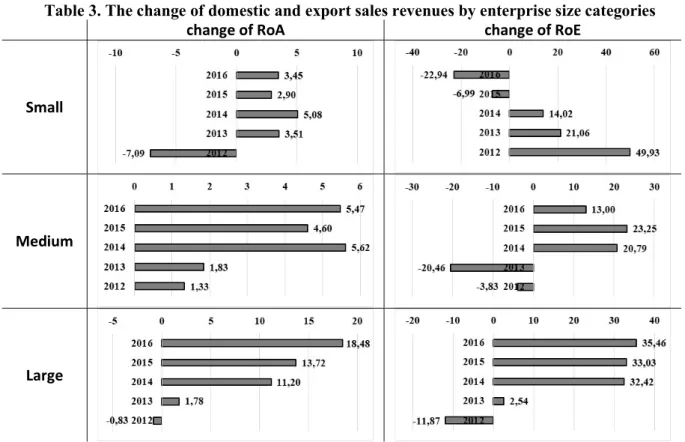
small- and medium-sized enterprises, respectively, from 2012 to 2016. Among main financial indicators, RoA and RoE were investigated to determine the general financial situation and the changes occurred in the period considered. Table 3 shows the change in the average of RoA and RoE by size categories.
Table 3. The change of domestic and export sales revenues by enterprise size categories
change of RoA change of RoE
Small
Medium
Large
The trend of RoA and RoE indicators show dynamic growth in the case of large companies. Development achieved by 2016 was strong during the years analysed from negative values in 2012. Medium-sized enterprises also seen an increase in RoA and Roe, however, the trend was not smooth and in the two last years there was a slight decrease as well. The average value of RoA calculated for small enterprises developed positively after 2012, but its value fluctuated, while RoE shows clear trend for reduction. Latter is mainly resulted from the value of equity since besides the decreasing trend in its value, it was negative which indicates that it did not reach even the value of subscribed capital.
4. Conclusion
References
AKI - Agrárgazdasági Kutató Intézet (2016): A magyarországi élelmiszeripar helyzete és jövőképe. Szerk: Kürthy Gyöngyi, Dudás Gyula, Felkai Beáta Olga. p. 320. Kiadó: Agrárgazdasági Kutató Intézet. ISBN: 978-963-491-599-7
Calsamiglia, S., Astiz, J., Baucells, L., Castillejos (2018): A stochastic dynamic model of a dairy farm to
evaluate the technical and economic performance under different scenarios. Journal of Dairy Science, 101 (8) pp. 7517-7530. https://doi.org/10.3168/jds.2017-12980
Chen, W., Holden, N. M. (2018): Bridging environmental and financial cost of dairy production: A case study of Irish agricultural policy. Science of the Total Environment, pp. 615 597-607.
https://doi.org/10.1016/j.scitotenv.2017.09.310
Dani, S. (2015): Food Supply Chain Management and Logistics – From Farm to Fork. Kogan Page, London, Philadelphia, New Delhi.
Hungarian Central Statistical Office (HCSO)
Földművelésügyi Minisztérium (FM) (2015): Magyarország közép- és hosszú távú élelmiszeripari fejlesztési stratégiája 2014-2020.
Moyes, K.M., Ma, L., McCoy, T.K., Peters, R.R. (2014): A survey regarding the interest and concern associated with transitioning from conventional to automated (robotic) milking systems for managers of small-to medium-sized dairy farms. The Professional Animal Scientist, 30 (4) pp. 418-422. https://doi.org/10.15232/pas.2014-01327
Paura, L., Arhipova, I. (2016): Analysis of the Milk Production and Milk Price in Latvia. Procedia Economics and Finance, 39 pp. 39-43. https://doi.org/10.1016/S2212-5671(16)30238-6
Pérez-Gómez, P., Arbelo-Pérez, M., Arbelo, A. (2018): Profit efficiency and its determinants in small and medium-sized enterprises in Spain. BRQ Business Research Quarterly, 21 (4) pp. 238-250.
https://doi.org/10.1016/j.brq.2018.08.003
Rózsa, A., Tálas, D. (2014): Versenyhelyzet-elemzés a magyarországi tejfeldolgozó szaktorban. Gazdálkodás, 58 (6) pp. 519-539. http://doi.org/10.22004/ag.econ.206202
Rózsa, A., Tálas, D. (2016): Vállalati értékteremtés vizsgálata az iparági teljesítmény tükrében. Vezetéstudomány, 9 pp. 2-14.
Schaller, L., Targetti, S., Villanueva, A.J., Zasada, I., Kantelhardt, J., Arriaza, M., Bal, T., Fedrigotti, V.B., Giray, F. H., Häfner, K., Majewski, E., Malak-Rawlikowska, A., Nikolov, D., Paoli, J.C., Piorr, A., Rodríguez-Entrena, M., Ungaro, F., Verburg, van Zanten, B., P.H., Viaggi, D. (2018): Agricultural landscapes, ecosystem services and regional competitiveness—Assessing drivers and mechanisms in nine European case study areas. Land Use Policy, 76 pp. 735-745. https://doi.org/10.1016/j.landusepol.2018.03.001
Stup, R.E., Hyde, J., Holden, L.A. (2006): Relationships Between Selected Human Resource Management Practices and Dairy Farm Performance. Journal of Dairy Science, 89 (3) pp. 1116-1120.
https://doi.org/10.3168/jds.S0022-0302(06)72180-4
Tacken, G.M.L., Batowska, A., Gardebroek, C., Nesha Turi, K., Banse, M., Wijnands, J.H.M., Poppe, K.J. (2009): Competitiveness of the EU dairy industry. szerk: G.M. L. Tacken. LEI 2009. ISBN: 978-90-8615-344-2
https://doi.org/10.1002/(SICI)1520-6297(199921)15:2<163::AID-AGR2>3.0.CO;2-5
Török, Á., Tóth, J., Balogh, J.M. (2018): Push or Pull? The nature of innovation process in the Hungarian food SMEs. Journal of Innovation & Knowledge (In Press) Available online: https://doi.org/10.1016/j.jik.2018.03.007 Vállalkozók és Munkáltatók Országos Szövetsége (VOSZ) (2012): Az élelmiszeripar kitörési pontot jelenthet – együttműködés az érdekképviseletben. Available online: http://voszbkm.hu/2012/11/04/egyuttmukodes-az-elelmiszeripari-erdekvedelemben