69
Using Spline Test-Day Model for Estimating the Genetic
Parameters for Cow’s Milk Yield
Rodica Stefania Pelmus
1, Mircea Catalin Rotar
1,
Horia Grosu
1*, Elena Ghita
1, Cristina Lazar
1National Research-Development Institute for Animal Biology and Nutrition, 077015-Balotesti, Calea Bucuresti, 1, Romania
Abstract
Genetic parameters of Montbeliarde cows were estimated for test-day milk yield with a random regression spline model. The spline model has been considered as a good alternative to Legendre polynomials to direct interpretation of parameters. With this model the lactation curve is divided into sections by knots. The milk yield between any two knots is assumed to be changing linearly. The random regression was fitted with linear splines with five knots: 7, 54, 111, 246, 302. The herd-test-day is the fixed effect of the model. The heritability estimates for test-day milk yield ranged from 0.346 at 65th day in milk, to 0.422 at 35th day in milk. Genetic correlations between individual test days were positive and tended to decrease with an increase in days between when the yields were measured. Random regression models using linear splines were proved to be useful for genetic evaluations of cows.
Keywords: cows, genetic evaluation, heritability, linear spline
1. Introduction
The aim of this study was to determine the genetic parameters using spline test-day model. Splines have been recently considered as a good alternative to Legendre polynomial due direct interpretation of parameters [1]. The advantage of models with splines can be explained by smaller overestimation of additive genetic variance compared to the Legendre polynomial [2]. In the literature many authors were used the splines models to estimate the genetic parameters for production traits [1-9]).
White et al. [3] and Silvestre et al. [7] used the natural cubic splines to model lactation curves. Random regression model with splines has good flexibility, are smooth and has limited sensitivity to the data [8]. Bohmanova et al. [2] used linear splines to estimate the genetic parameters. A
* Corresponding author: Horia Grosu Email: [email protected]
linear spline is a spline function where the segments are fitted by linear polynomials.
2. Materials and methods
The 254 test-day milk records from 28 Montbeliarde cows at the first calving (2011-2012) from experimental farm of National Research-Development Institute for Animal Biology and Nutrition were used in this study. In the linear splines model were used 5 knots:
T1=7, T2=54, T3=111, T4=246, T5=302.
t=a particular days in milk between 4 and 305 Ti=represent the five knots;
The covariates, xi for the spline function are
determined as follows: [11]
If t<T1, then x1=t/T1 and other xi for i>1 are zero.
If t>T5, then x5=t/T5 and other xi for i<5 are zero.
If Ti<t<Ti+1, then
70 xi+1=Ti+1-t)/(Ti+1-Ti) and the other covariates are
zero.
Linear model is described as follows: [12]
(
)
(
)
(
)
ijkq m mjk mj q m mjk mj q m mjk m i
tijk
HTD
b
v
a
v
p
v
e
y
=
+
∑
⋅
+
∑
⋅
+
∑
⋅
+
= =
=0 0 0
=
tijky
test day (TD) milk yield record ”k” of cow ”j” in first lactation measured at time ”t”;HTDi=HTD effect ”i”’;
=
m
b
fixed regression coefficient;=
jma
random regression coefficients for the breeding value;=
jmp
random regression coefficients for the permanent environmental effect;=
mjk
v
Spline coefficient at time ”t”;=
ijke
residual error.The model is:
y=Xb+Z1u+Z2p+e
where: y=vector of observations; b = vector of fixed effect for test-day;
u, p, e=vectors of additive genetic, permanent environmental, and residual values;
X, Z1, Z2 = incidence matrices;
The (co)variance structure was assumed for random effects of model:
V=
�
A
⊗
G
0
0
0
I
⊗
P
0
0
0
𝐼𝐼𝜎𝜎
𝑒𝑒2�
Where:
Var (a)=A
⊗
G;Var (a)=additive variance;
Where
⊗
is Kronecker product function; Var (p)=I⊗
P;Var (p)=environmental variance;
G and P are the matrices of genetic and permanent environmental variances and covariances between random regression coefficients.
I=represents the identity matrix with the size equal with the number of cows with records;
σ
𝑒𝑒2=residual variance for lactation assumed to be constant throughout the lactation;The estimates of heritability for milk yield during days in milk t were obtained by:
ℎ
𝑡𝑡=2(g
𝑔𝑔
𝑡𝑡𝑡𝑡𝑡𝑡𝑡𝑡
+
𝑝𝑝
𝑡𝑡𝑡𝑡+
σ
𝑒𝑒2)
where:
ℎ
𝑡𝑡2=heritability for milk yield during days in milkt;
𝑔𝑔
𝑡𝑡𝑡𝑡=genetic variance for milk yield during anydays in milk t;
𝑔𝑔
𝑡𝑡𝑡𝑡=
𝑧𝑧
𝑡𝑡′∗ 𝐺𝐺 ∗ 𝑧𝑧
𝑡𝑡𝑝𝑝
𝑡𝑡𝑡𝑡=
𝑧𝑧
𝑡𝑡′∗ 𝑃𝑃 ∗ 𝑧𝑧
𝑡𝑡𝑝𝑝
𝑡𝑡𝑡𝑡=permanent environmental variance for milkyield during any days in milk t;
𝑧𝑧
𝑡𝑡=co(variables) related to a specific test day l measured during days in milk t;σ
𝑒𝑒2=residual variance;The estimates of genetic correlations between test-day t’ and t milk yields were calculated by:
𝑟𝑟
𝑔𝑔𝑡𝑡′𝑡𝑡=
𝑔𝑔
𝑡𝑡′𝑡𝑡�𝑔𝑔
𝑡𝑡′𝑡𝑡∗ 𝑔𝑔
𝑡𝑡𝑡𝑡where:
𝑟𝑟
𝑔𝑔𝑡𝑡′𝑡𝑡=genetic correlations between test-day t` andt milk yields;
𝑔𝑔
𝑡𝑡′𝑡𝑡=genetic covariances between two test daysduring days in milk;
𝑔𝑔
𝑡𝑡′𝑡𝑡=
𝑧𝑧
𝑡𝑡′′∗ 𝐺𝐺 ∗ 𝑧𝑧
𝑡𝑡𝑧𝑧
𝑡𝑡′′=transpose of z;The breeding value estimate (EBV) was calculated with the formula:
(
)
∑
=⋅
=
q m mjk mjv
a
EBV
0 3053. Results and discussion
71
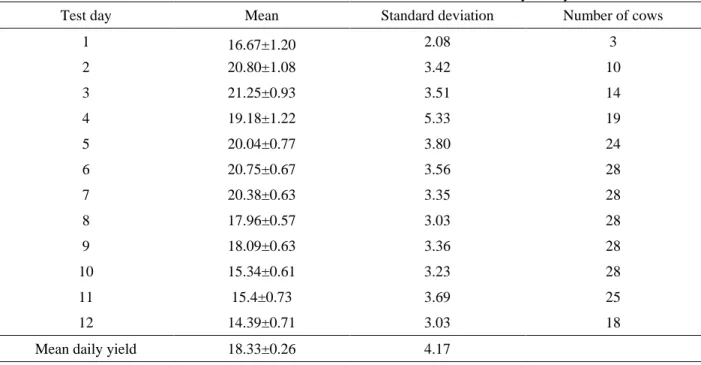
Table 1. Mean, standard error mean and standard deviation of test day milk yield
Test day Mean Standard deviation Number of cows
1 16.67±1.20 2.08 3
2 20.80±1.08 3.42 10
3 21.25±0.93 3.51 14
4 19.18±1.22 5.33 19
5 20.04±0.77 3.80 24
6 20.75±0.67 3.56 28
7 20.38±0.63 3.35 28
8 17.96±0.57 3.03 28
9 18.09±0.63 3.36 28
10 15.34±0.61 3.23 28
11 15.4±0.73 3.69 25
12 14.39±0.71 3.03 18
Mean daily yield 18.33±0.26 4.17
for test-day milk yield. High additive genetic variances were observed at the beginning and at the end of lactation compared with the middle of lactation. The additive genetic variances were constant in the middle of the lactation. White et al. [3], Silvestre et al. [7], Bohmanova et al. [2] were found the high additive genetic variances at the beginning and the end of lactation. The environmental variances were also high at the beginning and the end of lactation. The heritability estimates for test-day milk yield ranged from 0.346 at 65th day in milk, to 0.422 at 35th day in milk. The high average daily heritability for milk (0.45) was observed by Bohmanova et al. [2], in first lactation of
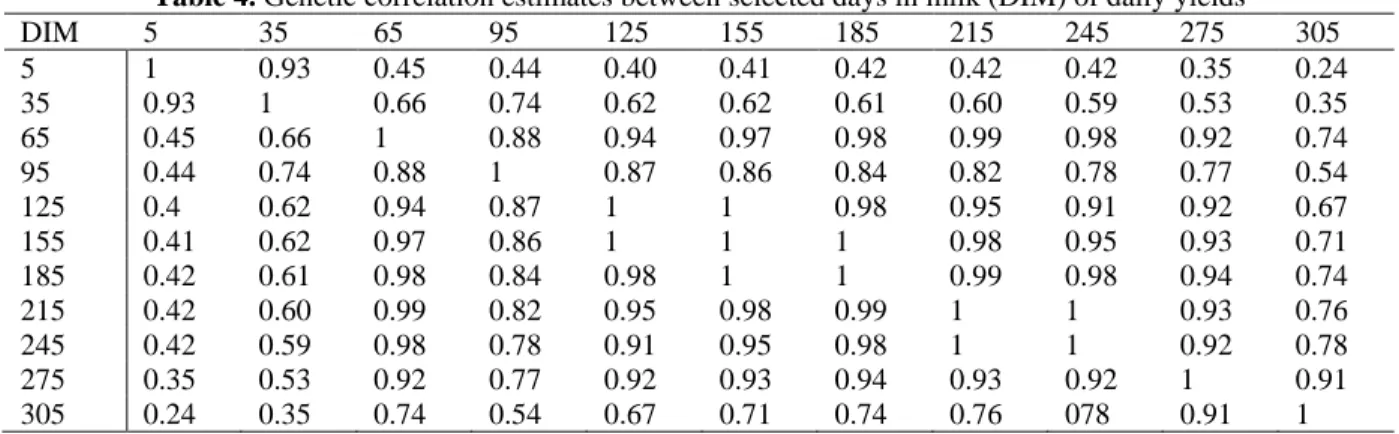
Canadian Holstein cows. The lower values of the heritability for test-day milk yield, 0.19 at 18th day in milk and 0.23 at mid-lactation was found by Silvestre et al. [7] and White et al. [3] obtained the heritability 0.23 at 18th day in milk and 0.27 at 290th day in milk. DeGroot et al. [8] reported lower test-day milk yields heritability that ranged from 0.10 to 0.15 for Holstein cows. The genetic correlations between test-day milk yields during the selected lactation periods obtained by spline model were shown in table 4. All correlations were positive ranging from 0.24 to 1. High estimates of genetic correlations between test day yields throughout lactation have been reported by White et al. [3] and Silvestre et al. [7].
Table 1. Mean, standard error mean and standard deviation of test day milk yield
Test day Mean Standard deviation Number of cows
1 16.67±1.20 2.08 3
2 20.80±1.08 3.42 10
3 21.25±0.93 3.51 14
4 19.18±1.22 5.33 19
5 20.04±0.77 3.80 24
6 20.75±0.67 3.56 28
7 20.38±0.63 3.35 28
8 17.96±0.57 3.03 28
9 18.09±0.63 3.36 28
10 15.34±0.61 3.23 28
11 15.4±0.73 3.69 25
12 14.39±0.71 3.03 18
72
Table 2. The breeding value of the Montbeliarde cows from our study
No. Estimate breeding value
1 722.528
2 712.668
3 456.101
4 455.307
5 441.807
6 440.075
7 423.058
8 407.591
9 359.995
10 328.700
Table 3. Estimates of genetic and environmental variances for selected days in milk and the heritability for daily yields
Days in milk Genetic variance Environmental variance Heritability
5 4.97 1.95 0.389
35 5.97 2.32 0.422
65 3.93 1.57 0.346
95 4.78 1.88 0.382
125 4.45 1.78 0.368
155 4.23 1.69 0.359
185 4.11 1.65 0.353
215 4.08 1.64 0.352
245 4.14 1.66 0.355
275 4.08 1.64 0.352
305 5.21 2.10 0.395
Table 4. Genetic correlation estimates between selected days in milk (DIM) of daily yields
DIM 5 35 65 95 125 155 185 215 245 275 305
5 1 0.93 0.45 0.44 0.40 0.41 0.42 0.42 0.42 0.35 0.24
35 0.93 1 0.66 0.74 0.62 0.62 0.61 0.60 0.59 0.53 0.35
65 0.45 0.66 1 0.88 0.94 0.97 0.98 0.99 0.98 0.92 0.74
95 0.44 0.74 0.88 1 0.87 0.86 0.84 0.82 0.78 0.77 0.54
125 0.4 0.62 0.94 0.87 1 1 0.98 0.95 0.91 0.92 0.67
155 0.41 0.62 0.97 0.86 1 1 1 0.98 0.95 0.93 0.71
185 0.42 0.61 0.98 0.84 0.98 1 1 0.99 0.98 0.94 0.74
215 0.42 0.60 0.99 0.82 0.95 0.98 0.99 1 1 0.93 0.76
245 0.42 0.59 0.98 0.78 0.91 0.95 0.98 1 1 0.92 0.78
275 0.35 0.53 0.92 0.77 0.92 0.93 0.94 0.93 0.92 1 0.91
305 0.24 0.35 0.74 0.54 0.67 0.71 0.74 0.76 078 0.91 1
4. Conclusions
The spline random regression model estimated more precise the genetic parameters. The heritability estimates for test-day milk yield were high, ranged from 0.346 at 65th day in milk, to 0.422 at 35th day in milk. Estimates of genetic correlations decreased with an increase in days between when the yields were measured.
Acknowledgements
73
References
1. Misztal, I., Properties of random regression models using linear splines, J. Anim. Breed. Genet., 2006, 123, 74-80.
2. Bohmanova, J., Miglior F., Jamrozik J., Misztal I., and Sullivan P.G., Comparison of random regression models with Legendre polynomials and linear splines for production traits and somatic cell score of Canadian Holstein cows, J. Dairy Sci., 2008, 91, 3627-3638. 3.White, I. M., Thompson R., and Brotherstone S., Genetic and environmental smoothing of lactation curves with cubic splines, J. Dairy Sci., 1999, 82, 632-638.
4. Misztal, I., Bohmanova J., Tsurata S., and Iwaisaki H., Use a linear spline to simplify longitudinal analyses. 55th Annual EAAP Meeting, Bled, Slovenia, 2004.
5. Iwaisaki, H., Tsuruta S., Misztal I., and Bertrand J.K., Genetic parameters estimated with multitrait and linear spline-random regression models using Gelbvieh early growth data, J. Anim. Sci., 2005, 83, 757-763. 6. Bohmanova, J., Misztal I., and Bertrand J. K., Studies on multiple trait and random regression models for genetic evaluation of beef cattle for growth, J. Anim. Sci., 2005, 83, 62-67.
7. Silvestre A.M., Petim-Batista F., and Colaco J., Genetic parameter estimates of portuguesse dairy cows for milk, fat and protein using a spline test- day model, J. Dairy Sci., 2005, 88, 1225-1230.
8. DeGroot B. J., Keown J. F., Van Vleck L. D., and Kachman S. D., Estimates of genetic parameters for Holstein cows for test-day yield traits with a random regression cubic spline model, Faculty Papers and Publications in Animal Science, Paper 240, 2007, http://digitalcommos.unl.edu/animalscifacpub/240. 9. Macciotta N. P .P., Miglior F., Dimauro C., and Schaeffer L.R., Comparison of parametric, orthogonal, and spline functions to model individual lactation curves for milk yield in Canadian Holsteins, Italian Journal of Animal Science, 2010, 9:E87, 460-464. 10. Druet, T. F., Jaffrezic F., Boichard D., Ducrocq V., Modeling lactation curves and estimation of genetic parameters for first lactation test-day records of French Holstein cows, J. Dairy Sci., 2003, 86, 2480-2490. 11. Grosu, H., Schaeffer L., Oltenacu P. A., Norman D., Powell R., Kremer V., Banos G., Mrode R., Carvalheira J., Jamrozik J., Draganescu C., and Lungu S., History of genetic evaluation methods in dairy cattle, The Publishing House of the Romanian Academy, Bucharest, 2013.