Scaling the Performance and Cost
for Elastic Cloud Web Services
Monika Simjanoska, Marjan Gusev, Sasko Ristov and Goran Velkoski
Faculty of Computer Science and Engineering, Ss. Cyril and Methodius University, Skopje, MacedoniaCloud computing is the latest evolution of computing where the IT resources are offered as services following the “pay-per-usage” pricing model. Cloud’s scalability feature causes variable price for resources governed by the cloud service providers. Therefore, the cloud cus-tomers’ main interest is whether the performance scales to the price for the leased resources in the cloud. In this paper we analyze the variable server load impact on the performance and the cost of two web services that utilize memory and CPU resources. In order to determine the real cost of the rented CPU resources, we experimented with different number of concurrent messages with different sizes. The results concerning the memory demanding web service show that the lowest cost is obtained when the web service is hosted on two CPUs, whereas the results concerning the web service which additionally utilizes CPU show that the lowest cost is achieved when it is hosted on one CPU and linearly rises with the resources.
Keywords: cloud computing, web services, performance, resources, cost
1. Introduction
The cloud is a parallel and distributed comput-ing system, which consists of a collection of interconnected and virtualized computers that are dynamically provisioned and presented as one or more unified computing resources. The resource provisioning is negotiated via service level agreements (SLAs) between the service providers and the consumers [1]. Cloud com-puting refers to the applications and services that run on a distributed network using virtual-ized resources and are accessed by common In-ternet protocols. It makes the long-held dream of utility computing possible with a pay-as-you-go, infinitely scalable, universally available sys-tem[2]. This usage-based pricing model offers several advantages, including reduced capital
expense, a low barrier to entry, and the ability to scale up as demand requires, as well as to sup-port brief surges in capacity[3]. A natural ex-pectation from the pay-per-usage pricing model is that the performance gain scales to the mone-tary costs, i.e., the more resources are rented, the more performance is achieved. Cloud service providers (CSPs) guarantee the availability of the rented resources to the customers; however, a guarantee of scalable and sustainable perfor-mance is missing in the SLAs [4]. Hence, the problem of scalable performance is a very chal-lenging field of study and is also beneficial for both the consumers and the CSPs.
Type 1 VM 2 VMs 4 VMs 8 VMs
Windows Azure 0,09 0,18 0,36 0,72 Google Compute 0,145 0,290 0,580 1,160
Amazon EC2 0,091 0,182 0,364 0,728 Scaling factor 1 2 4 8
Table 1.VM instance types and price simulation for Windows platform.
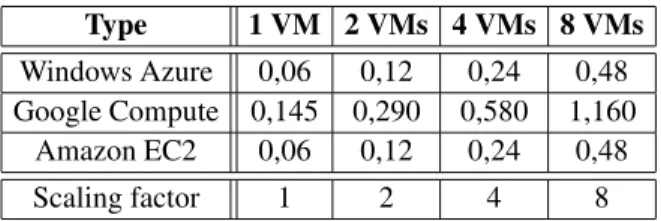
Type 1 VM 2 VMs 4 VMs 8 VMs
Windows Azure 0,06 0,12 0,24 0,48 Google Compute 0,145 0,290 0,580 1,160
Amazon EC2 0,06 0,12 0,24 0,48 Scaling factor 1 2 4 8
Table 2.VM instance types and price simulation for Linux platform.
To compare how the performance and cost scale, and to obtain sophisticated results, two web ser-vices are hosted in cloud environment with VM instances with the same platform, but different amount of hardware resources. The first web service is a memory demanding (Concat WS), which returns the concatenation of two strings, while the second(Sort WS)web service utilizes both the memory and CPU, returning the sorted concatenation of the two input strings. TheSort web service was discussed in our previous re-search[8], where we analyzed the web services’ characteristics impact on the performance ben-efits. In this research we extend our analyses in more detail.
We focus our research in two directions: 1. How does the performance scale if the
re-sources are scaled for the same server load; 2. Is there a region of server load where
maxi-mum performance is achieved by paying the same price.
The rest of the paper is organized as follows. In Section 2 we present a brief review of the re-lated work. The testing methodology is defined in Section 3 and the results of the experiments are presented in Section 4. We evaluate the cost performance trade-off in Section 5 and discuss the obtained results in Section 6. Finally, we de-rive conclusions over the results and we present our ideas for a future research extension in the final Section 7.
2. Related Work
In this section we review recent research closely related to our field of interest.
The recent research of a “cost-efficient” cloud computing mostly examines the CSPs’ costs for offering cloud computing solution. Either the authors investigate the cloud’s energy and cost efficiency[9, 10, 11, 12], or they discuss other is-sues and challenges stating that with on-demand resource provisioning and utility based pricing, CSPs can truly maximize resource utilization and minimize their operating costs[13].
In this paper, we are interested in the cus-tomers’ benefits of the on-demand resource pro-visioning and the pay-per-usage pricing model. Thereto, we aim to investigate if there is a case when the customer can achieve maximum performance with minimal costs. Similar re-search of this kind is presented by De As-suncao et al. [14], where the authors present several scheduling strategies for balancing be-tween performance and usage cost. Their re-sults show that some of the strategies result in a higher cost under heavy load conditions, whereas some showed a good ratio of slow-down improvement to the money spent for using cloud resources. Andrzejak et al. formulated a probabilistic model that enables a user to opti-mize monetary costs, performance and reliabil-ity, given the user’s SLA constraints as resource availability and deadline for job completion
[15]. Using their model, the users can achieve largest cost savings (for considered workload types) by using the high-CPU instance types instead of standard or high-memory instance types. The authors’ contribution in [16]is de-veloping a service that is able to perform the cost determination for scientific applications in cloud computing environments. Kondo et al. compare the performance and monetary cost-benefits of clouds for computing applications, ranging in size and storage[17].
that the cloud achieves smaller performance degradation for greater message sizes using a memory demanding web service, and also for greater message sizes and smaller number of concurrent messages for memory demanding and computation intensive web services [19]. In our previous research[20]we proved that the same web services achieved almost 10 times better performance when they were hosted in several VM instances with one CPU core, rather than in one huge VM instance with all CPU cores allocated.
As we presented the latest research related to the problem of scaling performance and cost in the cloud, we proceed with research methodol-ogy to find out if the performance rises linearly to the cost.
3. The Methodology
In this section, we developed an original method-ology that includes technical details, appropri-ate cloud environment configuration, to include all three test cases with different number of re-sources, and the testing procedure itself. Con-sidering the outcomes from the experiments we present relevant mathematical relations to ob-tain reliable results.
3.1. Hardware Details
As a testing environment we used client-server architecture deployed in the open source cloud platform OpenStack [21] using Kernel-based Virtual Machine(KVM)hypervisor to instanti-ate VM instances. The client and server node are installed with Linux Ubuntu Server 12.04 operating system. Hardware computing re-sources consist of Intel(R)Xeon(R)CPU X5647 @ 2.93GHz with 4 cores and 8GB RAM. The VM instances consist of Linux Ubuntu Server 12.04 operating system and Apache Tomcat 6 as the application server. To minimize the network latency(less than 1ms)we placed the client and the VMs in the same LAN segment[22].
3.2. Web Services Description
Both Concat and Sort web services are
docu-ment style Java web services:
• Concat is a memory demanding web
ser-vice that accepts two strings and returns their concatenation. It depends only on the input parameter size M with memory complexity O(M).
• Sortis a web service that accepts two strings and returns their alphabetically sorted con-catenation. It is both CPU intensive and memory demanding. The memory complex-ity is O(M) and time complexity is O(M ·
log2M). Sorting is realized with the merge sort algorithm.
3.3. Environment Configuration
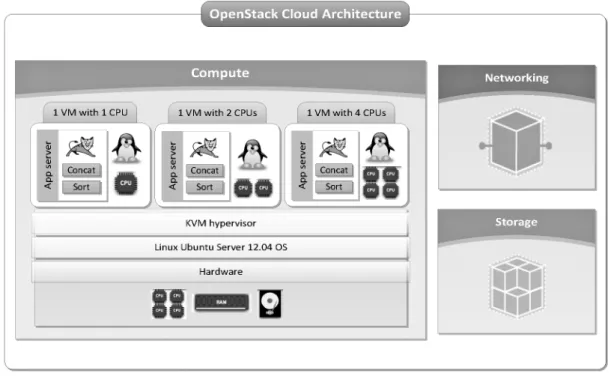
In order to simulate various number of provided resources(CPU cores), we defined three differ-ent cloud environmdiffer-ents presdiffer-ented in Figure 1:
• Test Case 1: VM instance with 1 CPU;
• Test Case 2: VM instance with 2 CPUs; and
• Test Case 3: VM instance with 4 CPUs.
Each VM hosts the Concat and the Sort web service.
3.4. Testing Procedure
The client uses SoapUI [23] to generate vari-ous server loads. For each message size ofM kilobytes each, we realize experiments where the server generatesNweb service requests per second in a time frame of 60 seconds. The frequency of requests is not constant and we use variance of 0.5 for generating the load. It means that the frequency of generating requests will vary by N/2 in three equal time periods within the given time frame. Each test starts with a case when the server generates 3·N/2 requests per second in a 20 seconds time frame, then in the next time frame of 20 seconds, the server sends N/2 requests per second, and fi-nally in the last time frame of 20 seconds, the server sendsN requests per second.
Figure 1.Test cases in the OpenStack cloud architecture.
and 2000 requests per second. We conducted experiments for Concat web service with the following message parameter sizeM=0,1, ...,9 KB, while the experiments for Sort web ser-vice are loaded with message parameter size M =0,1, ...,6 KB.
3.5. Performance and Cost Measurements
We measured the server’s response time for each different parameter size,M, and number of con-current messages,N.
The experiments are realized for each test case, as defined by the environments in 3.3. These measurements will express the cloud’s perfor-mance. Variable load reflects different time responses, and the response time is measured for each experiment. Since the communication time is less than 1ms(around 0.3 – 0.5ms), the total response time calculated by the SOAPUI is approximately the same as the response time by the server.
We tested three different test cases forn= 1,2 and 4 cores. For each test case (n ∈ {1,2,4})
we calculated the average response time T(n), since the server load was changing with vari-ance 0.5 in the given timeframe of 60 seconds.
Pursuant to our goal of expressing the perfor-mance through cost evaluation, in equation(1)
we calculate the costC, that also depends on the total number of used coresn.
C(n) =T(n)·n (1)
The goal of this research is to find out whether the performance is proportional to the number of rented resources, thus to check if the web ser-vices’ total costC(n) is the real cost of rented CPU resources. For this purpose we introduce Relative Costof the scaling, calculated by(2),
(3)and(4), as ratio of costs for test cases, com-paring VMs with 2 and 1 CPU cores; VMs with 4 and 1 CPU cores; and VMs with 4 and 2 CPU cores, correspondingly.
R21 = CC(2)
(1) (2)
R41 = CC((41)) (3)
R42 = CC((42)) (4)
An ideal expectation will be the proportional scaling, i.e., when R21 = 2, R41 = 4 and
R42 =2. Any deviation from these expectations
4. The Results of the Experiments
In this section we present the results of the ex-periments for each web service separately.
4.1. Performance Analysis for Concat WS
The memory demanding Concat web service has been hosted in VM instances with 1, 2 and 4 CPU cores.
4.1.1. Test Case 1 – VM with 1 CPU Core
Figure 2 presents the results for the cloud envi-ronment with 1 VM instance with 1 CPU core. According to the results, the response time de-pends equally on the message parameter size, M, and number of concurrent messages,N. Fig-ure 2 denotes thatC(1)is equal toT(1)because the number of used CPUs is 1, and if applied in equation in(1), the cost and the response time remain the same.
For a simplified presentation we denote the points in the format (M,N), where M and N refer to both the parameters we previously de-fined. Thus, the minimum value of 0.003s is in the point(0,12), and the maximum value of 0.241s is in the point (9,1000). Considering that the response time proportionally increases as both of the parametersMandNincrease, we observe that the minimum value is in the ex-pected point, but the maximum value seems to be an unexpected peak. The average value is T(1) =0.058s.
Figure 2. Response timeT(1)forConcatWS.
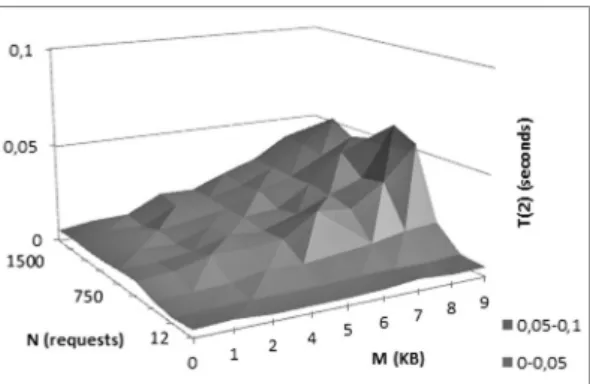
4.1.2. Test Case 2 – VM with 2 CPU Cores
The results for the cloud environment with 1 VM instance with 2 CPU cores are presented in Figure 3. The minimum value of 0.002s is at the point(0,100), whereas the maximum value of 0.059s is again at the point (9,1000). Ac-cording to the average value ofT(2) = 0.016s, we assume that the response time has decreased
3.6 timesin comparison to the cloud with 1 VM instance with 1 CPU. In the next section, where we perform cost analysis, we assume that the performance gain of a VM with 2 cores over a VM with one core has value of 3.6.
Figure 3. Response timeT(2)forConcatWS.
4.1.3. Test Case 3 – VM with 4 CPU Cores
Figure 4 depicts the results for the cloud envi-ronment with 1 VM instance with 4 CPU cores. The minimum value of 0.003sat(0,12)shows that for small number of concurrent messages and small message parameter size, there is mi-nor variation in the response time in spite of the increased number of resources. The maximum value of 0.031sis at the point(9,1750), and the average value is T(4) = 0.012s which means that the response time decreased4.8 times com-pared to the cloud VM with 1 core, i.e. the performance gain of a VM with 4 CPU cores compared to a VM with 1 CPU core is 4.8.
Figure 4. Response timeT(4)forConcatWS.
4.2. Performance Analysis for Sort WS
The memory and CPU demandingSortweb ser-vice has been hosted in VM instances with 1, 2 and 4 CPU cores.
4.2.1. Test Case 1 – 1 Core
Figure 5 depicts the results for the response time T(1), i.e. VM instance with 1 CPU core.
Figure 5. Response timeT(1)forSortWS.
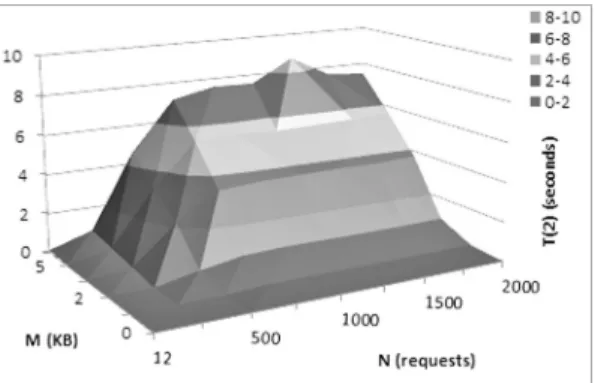
Since the number of cores is 1,T(1)is equal to C(1). The response time(cost)proportionally increases with the load, and it depends more on the message sizeMthan on the number of con-current messagesN. This can be explained by the fact that Sort is computation intensive and spends more CPU time when processing large messages. The minimum value of 0.003sis in the point (0,100), and the maximum value of 12.56s is in the point (6,1500). Considering the fact that there is a little variability in the response time for the values of the parameter N, we find the minimum and maximum points to be within the expected limits. Unexpected
peaks are detected in(5,750)and(6,750). The average value isT(1) =3.75s.
4.2.2. Test Case 2 – 2 Cores
The results for T(2) are presented in Figure 6. The maximum value detected in this case is 8.7s, again at the point(6,1500), and the minimum value is 0.002sat (0,12). Considering the av-erage value ofT(2) =2.2s, we assume that the T(2)has decreased1.7 timescompared toT(1). Otherwise, it also proportionally increases with the load, depending more onMthanN.
Figure 6. Response timeT(2)forSortWS.
4.2.3. Test Case 3 – 4 Cores
Figure 7 presents the results for the response time T(4). The minimum value of 3.02s at
(0,12)disproves the scalability property of the response time as the number of cores used in-creases. However, this phenomenon occurs only for M = 0KB. The maximum value of 6.04sis at the point(6,1750), and the average value is T(4) = 1.64swhich means that T(4) decreased2.3 timescompared toT(1), and1.34 timescompared toT(2).
5. Evaluation of Cost and Performance
In this section we perform evaluation of cost and performance for realized experiments and obtained results.
5.1. Cost Analysis for Concat Web Service
In order to derive conclusions about the suffi-cient trade-off between the cost and the gained performance, we used(1)to calculate the cus-tomer’s cost for the resources.
By observing the average response time de-crease in Section 4.1, we have concluded that scaling up the resourcesntimes, wherenis the number of cores, provides performance gain, even more than ntimes. Hereupon, we aim to find an answer for our research problem, i.e. whether the cost for the resources is equal to the performance gain, moreover, whether there is a region where customers pay less than they gain. The default cost per core is the cloud environ-ment with one core, i.e., the results from the cloud environment with 1 VM instance with 1 CPU as presented in Figure 2.
The relative ratio between the cost for the cloud VM with 2 CPUs and cloud VM with 1 CPU, calculated by(2)is depicted in Figure 8. As cost threshold we used the average response time de-crease of 3.6, since in Section 4.1 we showed that the consumer achieves 3.6 times more per-formance on average when migrating from VM with 1 CPU to VM with 2 CPUs. Thus, if the cost transcends this value, a customer is consid-ered to pay more than he gets. Interestingly, we observe that the customer’s costs for resources remain far beyond the threshold value.
Figure 8.Relative costR21forConcatWS.
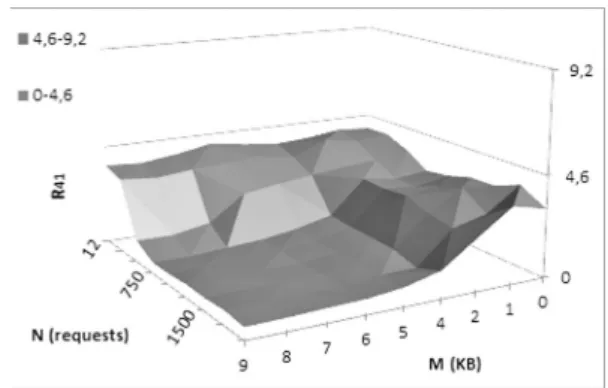
Figure 9 depicts the proportion of the cost for the cloud VM with 4 CPUs and the cost for a cloud VM with 1 core, calculated by(3). The results also show that, for any message param-eter size and number of concurrent messages, the customer’s costs are much lower than the performance advantage of 4.8 times. Interest-ingly, incrementing the number of concurrent messagesN and the message sizeM decreases the cost in both scenarios.
Figure 9. Relative costR41forConcatWS.
Eventually, we compared the cost between the cloud VM instance with 4 CPUs and cloud VM instance with 2 CPUs, calculated by (4). The aim of this analysis is to discover whether the customer will make a good decision demanding 2 more CPUs once he has used 2 cores. When presenting the results on Figure 10, we used1.3
value as a threshold which we obtained from the results in Section 4.1 where we concluded that the performance gain is 1.3 times for VM with 4 cores in comparison to VM with 2 cores. However, the results show that there are small regions where the customer pays less than he gets, thus, it is not worthwhile renting 2 more cores once the customer has used 2 cores.
5.2. Cost Analysis for Sort Web Service
Using the values for response time in (1), we calculate the customer’s cost for rented resources and define the best trade-off between the cost and the gained performance.
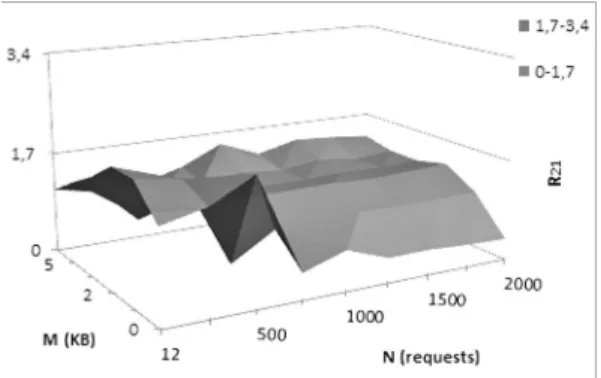
Considering the average response time decrease in Section 4.2, we concluded that scaling up the resourcesntimes does not provide equal perfor-mance scale. Hereupon, we aim to investigate whether the cost for resources is nearly equal to the performance gain, more precisely, if the cus-tomers pay as much as the gained performance. To compare the scaling with factor 2, we ana-lyze the results for relative costR21 depicted in
Figure 11. As a cost threshold we used the av-erage performance decrease of 1.7, thus, if the cost transcends this value, a customer is consid-ered to pay more than he gets. We observe that the cost is within the limits except for the load with small values of MandN. We explain this with the fact that web server needs more time to schedule the small number of small tasks in-stead of executing them.
The relative cost R41 is depicted in Figure 12.
The results show that the customer pays more than he gets when one or both parameters M andN are small. For greater load the customer will obtain the performance of the resources he pays.
The results for the relative costR42are depicted
in Figure 13. The threshold value for scaling the resources from scaling factor 2 to 4 is1.34, but the relative costR42is much greater than the
threshold for almost all values of parametersM andN. Although there is a small region where the relative cost is smaller than the threshold, its value is still near the threshold.
Figure 11.Relative costR21forSortWS.
Figure 12.Relative costR41forSortWS.
Figure 13.Relative costR42forSortWS.
6. Discussion
In this section we compare the results from the performance and cost analysis of the two web services.
6.1. Response Time Comparison
When discussing performance disproportion to the scaled resources, the Concat web service performs better for both cloud environments with VM instance with 2 and 4 CPUs respec-tively, defined in Section 3.3. Therefore, when
theConcat web service is hosted in cloud VM
the other hand, for theSortweb service, the re-sponse time decreases 1.7 times when the CPU scales to 2 cores, and 2.3 times if the num-ber of CPUs is 4. Obviously, the performance improvement depends on the type of the web service used. For a memory demanding web service, customers will gain higher performance when renting more resources, whereas for com-putation intensive web service, the increasing performance factor is much smaller, but it also has the affinity to rise.
6.2. Cost Analysis Comparison
In this section we proceed to discuss the trade-off between the cost and the performance. We observe that the Concat web service cost, while hosted on cloud VM instance with 2 CPUs, never transcends the 3.6 threshold. The cost analysis of the Concat web service hosted in cloud VM instance with 4 cores, using the av-erage response time decrease value of 4.8, also shows that pay-per-usage model is convenient for the customers. Even though, the computa-tion intensiveSortweb service shows less per-formance gain when scaling the resources, there are only few regions where the cost transcends the performance.
The overall comparison results show that the compromise between the cost and the perfor-mance is positive, which means the customers will gain as much performance as they pay with negligible exceptions.
7. Conclusion and Future Work
CSPs’ pay-per-usage model offers linearly scal-able charging to the acquired resources. We assume that the performance also scales to the pay-usage model and in this paper we per-formed a series of experiments to investigate in which case the customer would make the best trade-off between the performance and the ex-penses.
Observing all scenarios, we conclude that the
Concat web service, while hosted on 2 CPUs,
provides 3.6 time better performance than when hosted on 1 CPU, which is the best case from all test cases. Moreover, it also provides the
lowest cost in comparison to the gained perfor-mance. On the other hand, the worst results are obtained when the customer migrates from 2 CPUs to 4 CPUs, i.e., the cost is much above the performance benefit.
In comparison to Concat, Sort web service shows less performance gain when scaling the resources, however, there are only few regions where the cost transcends the performance. By performing the analyses of both web ser-vices, we confirmed that the cost-performance relation still depends on the web services’ char-acteristics. Overall results show that for a mem-ory demanding web service the customer will gain maximum performance for the particu-lar investment, but adding more characteristics to the web service this performance gain de-creases. However, generally, the performance gain stays positive.
This intrigues us to extend our research in the future and to include more web services that de-pend on different characteristics. Furthermore, we will perform the same analysis in a multi-tenant cloud, since although virtualization has facilitated resource efficiency in servers, cur-rently, performance interference effects still oc-cur in virtual environments where the same CPU cache and translation lookaside buffer
(TLB) hierarchy are shared by multiple VMs
[24].
References
[1] R. BUYYA, C. S. YEO, S. VENUGOPAL,
Market-oriented cloud computing: Vision, hype, and reality for delivering it services as computing utilities. InHigh Performance Computing and Communica-tions, HPCC’08. 10th IEEE International Confer-ence on,(2008), pp. 5–13.
[2] B. SOSINSKY, Cloud computing bible. John Wiley
& Sons, 2010.
[3] R. GROSSMAN, The case for cloud computing. IT
professional,11(2) (2009), 23–27.
[4] D. DURKEE, Why cloud computing will never be
free.Queue,8(4) (2010), p. 20.
[5] MICROSOFT, Windows Azure, July 2013.[Online].
Available:
http://www.windowsazure.com/pricing/
[6] GOOGLE, Compute Engine, July 2013.[Online].
Available:
[7] AMAZON, EC2, July 2013. [Online]. Available:
http://aws.amazon.com/ec2/
[8] M. SIMJANOSKA, G. VELKOSKI, S. RISTOV, M. GU -SEV, Does the performance scale the same as the cost
in the cloud? InInformation Technology Interfaces, Proceedings of the ITI 2013 35th International Con-ference on, IEEE ConCon-ference Proceedings,(2013), pp. 83–88.
[9] A. BERL, E. GELENBE, M. DIGIROLAMO, G. GIU -LIANI, H. DE MEER, M. DANG, K. PENTIKOUSIS,
Energy-efficient cloud computing. The Computer Journal,53(7) (2010), 1045–1051.
[10] J. BALIGA, R. AYRE, K. HINTON, R. TUCKER, Green
cloud computing: Balancing energy in processing, storage, and transport. Proceedings of the IEEE,
99(1) (2011), 149–167.
[11] A. BELOGLAZOV, R. BUYYA, Energy efficient
re-source management in virtualized cloud data cen-ters. In Proceedings of the 2010 10th IEEE/ACM International Conference on Cluster, Cloud and Grid Computing, ser. CCGRID ’10, (2010), pp. 826–831.
[12] Y. LEE, A. ZOMAYA, Energy efficient utilization of
resources in cloud computing systems.The Journal of Supercomputing,60(2) (2012), 268–280. [13] Q. ZHANG, L. CHENG, R. BOUTABA, Cloud
com-puting: state-of-the-art and research challenges. Journal of Internet Services and Applications,1(1) (2010), 7–18.
[14] M. DE ASSUNC¸AO˜ , A. DI COSTANZO, R. BUYYA,
Evaluating the cost-benefit of using cloud comput-ing to extend the capacity of clusters. InProceedings of the 18th ACM international symposium on High performance distributed computing ACM,(2009), pp. 141–150.
[15] A. ANDRZEJAK, D. KONDO, S. YI, Decision model for cloud computing under sla constraints. In Modeling, Analysis & Simulation of Computer and Telecommunication Systems (MASCOTS), 2010 IEEE International Symposium on, (2010), pp. 257–266.
[16] H. TRUONG, S. DUSTDAR, Composable cost estima-tion and monitoring for computaestima-tional applicaestima-tions in cloud computing environments.Procedia Com-puter Science,1(1) (2010), 2175–2184.
[17] D. KONDO, B. JAVADI, P. MALECOT, F. CAPPELLO, D.
ANDERSON, Cost-benefit analysis of cloud comput-ing versus desktop grids. InParallel & Distributed Processing, 2009. IPDPS 2009. IEEE International Symposium on,(2009), pp. 1–12.
[18] M. GUSEV, S. RISTOV, The optimal resource alloca-tion among virtual machines in cloud computing. InCLOUD COMPUTING 2012, The Third Inter-national Conference on Cloud Computing, GRIDs, and Virtualization,(2012), pp. 36–42.
[19] S. RISTOV, G. VELKOSKI, M. GUSEV, K. KJIROSKI,
Compute and memory intensive web service per-formance in the cloud. In ICT Innovations 2012. Springer Berlin/Berlin Heidelberg, 2013, vol. AISC 257, pp. 215–224.
[20] M. GUSEV, S. RISTOV, G. VELKOSKI, M. SIM -JANOSKA, Optimal resource allocation to host web
services in cloud. InCloud Computing (CLOUD), 2013 IEEE 6th International Conference on, ser. CLOUD 2013, June 2013, pp. 948–949.
[21] OPENSTACK, Openstack cloud software, July 2013.
[Online]. Available:http://openstack.org
[22] M. JURIC, I. ROZMAN, B. BRUMEN, M. COLNARIC,
M. HERICKO, Comparison of performance of web services, WS-Security, RMI, and RMI–SSL. Jour-nal of Systems and Software, 79(5) (2006), 689– 700.
[23] SOAPUI, Functional testing tool for web ser-vice testing, July 2013. [Online]. Available:
http://www.soapui.org/
[24] F. HU, M. QIU, J. LI, T. GRANT, D. TAYLOR, S. MC
-CALEB, L. BUTLER, R. HAMNER, A review on cloud computing: Design challenges in architecture and security. Journal of Computing and Information Technology,19(1) (2011), 25–55.
Received:July, 2013 Revised:September, 2013 Accepted:September, 2013
Contact addresses: Monika Simjanoska Faculty of Computer Sciences and Engineering Ss. Cyril and Methodius University Skopje Macedonia e-mail:[email protected]
Marjan Gusev Faculty of Computer Sciences and Engineering Ss. Cyril and Methodius University Skopje Macedonia e-mail:[email protected]
Sasko Ristov Faculty of Computer Sciences and Engineering Ss. Cyril and Methodius University Skopje Macedonia e-mail:[email protected]
Goran Velkoski Faculty of Computer Sciences and Engineering Ss. Cyril and Methodius University Skopje Macedonia e-mail:[email protected]
MARJANGUSEVis a professor at the Ss. “Cyril and Methodius” Uni-versity, Faculty of Computer Science and Engineering, Skopje, Mace-donia. He has published more than 70 papers in parallel computing related journals and is author of more than 300 research articles, pre-sentations, invited talks and technical reports. His areas of interest include computer architecture, parallel processing, computer networks, internet, and cloud computing. He was awarded with Best Scientist Award at the University Ss. “Cyril and Methodius”, and with the IEEE EDUCON 2013 Best Paper Award.
SASKORISTOVwas born in Kavadarci, Macedonia, in 1976. He re-ceived his Ph.D. degree in 2012. Since 2013 he is Assistant Professor at the Ss. “Cyril and Methodius” University – Skopje, Macedonia. He has authored more than 70 research articles during his relatively short scientific research. His research interests include performance and security of cloud computing, implementing the cloud features in education, especially hardware, network and parallel and distributed processing courses. Sasko Ristov was a recipient of the University Ss. “Cyril and Methodius” – Skopje, Macedonia the Best Scientist Award in 2012, and the IEEE EDUCON 2013 Best Paper Award.