The Design and Implementation of
a Performance Evaluation Tool with
TPC-W Benchmark
Zhu Hong
1, Fu Xin
1, Lin Qiu Hui
1and Kevin L¨u
21Huazhong University of Science and Technology, Wuhan, Hubei, China 2Brunel University, Uxbridge, UK
This paper describes the design and implementation of a performance testing tool for E-commerce systems. This tool can be used to assess the system performance based on TPC-W benchmark. The main features and designing considerations of the tool as well as testing procedures are discussed. The test results of applying this tool to two real systems have been initially used for system analysis and evaluation.
Keywords: TPC-W, testing tool, performance bench-mark.
1. Introduction
Performance evaluation for E-commerce appli-cations has become an important issue. It can be used to compare different systems, to deter-mine a suitable configuration for an application, to tune its performance or to decide how to up-grade it. Performance evaluation tools that au-tomate the process of comparing and evaluating design decision would benefit those involved with application sizing, system design and ad-ministration.
A typica l E-commerce application system con-sists of Web server, back-end database server and network components. Its performance de-pends on these components. A number of benchmarks have been proposed and used for E-commerce applications so far 9] 11]. Amongst these benchmarks, TPC-W was developed speci-fically for E-commence systems, which has been widely recognized and accepted.
Several testing systems using TPC-W bench-mark for evaluating systems have been devel-oped 7, 9]. Harold W. Cain et al 1]at
Wiscon-sin University developed a Java TPC-W evalua-tion system. The system has three tiers in archi-tecture and its design and implementation are in accordance with TPC-W specification, except the secure socket layer required for the Purchase confirm interaction. In this system, as the SSL is used 6], the Web server will do additional work for the purchase–confirm–interactions be-sides the one required by the specification and the performance of the whole system will be decreased largely 5]. Daniel F. et al addressed the architecture and model of the testing system based on TPC-W benchmark and implemented a testing system with PHP technology. The met-rics of their evaluation are: the web interaction per seconds (WIPS) 5]. Pierfrancesco Foglia et al 3] 4]studied the workload based on TPC-W benchmark for E-commerce and designed a testing system with three tiers architecture to evaluate the memory performance of SMP mul-tiprocessors running on the workload produced by the TPC-W testing system. Most of the ex-isting testing systems were designed to evaluate the performance of server hardware and few discussed the performance evaluation involving other components of the Web servers.
used to measure system performance. The ac-cessorial statistics of the resources utilization, such as the CPU utilization, memory utilization and I/O activities have been used to analyze the bottleneck of performance. This test tool has been used to comparing DM4 8]and SQL Server 2000 10]. The test results have been used for system design analyses.
The general performance metrics are introduced in Section 2. Section 3 briefly describes the ar-chitecture of the test tool. The main features of TPC-W are summarized in Section 4. Sec-tion 5 provides the implementaSec-tion details of the testing tool. Section 6 presents some test results and initial analyses. Section 7 presents the summary.
2. The Performance Metrics
TPC-W emulates a bookstore on the Internet. It comprises a set of basic operations designed to exercise transactional Web system in a man-ner representative of Internet commerce appli-cation environments. The activities of users are browsing, searching and ordering. It defines eight database basic related tables (see Figure 1)and 14 Web interactions(see Table 1). These Web interactions include two types: browsing and ordering. And these Web interactions must satisfy the ACID properties.
The primary metric of the TPC-W benchmark is a throughput which consists of two main met-rics. The first is denoted as WIPS@SF, which is the average number of Web interactions per sec-ond completed during Shopping Interval where about 80% of the Web interactions are browsing and 20% of the Web interactions are ordering. The second is price performance metric defined as the total cost of the SUT divided by the num-ber of WIPS measured in Shopping Interval. In the mean time, there are two additional met-rics for throughput. One is the WIPSb, which is the average number of Web interactions per second completed during the Browsing Interval. Among all the Web interactions, 95% of them are browsing(bookstore home page, new prod-uct and best seller, prodprod-uct detail and search-ing)while 5% of the Web interaction transac-tions are ordering. The metric WIPSb reflects the query performance of DBMS. The other is
the WIPSo, which means the average number of Web interactions per second completed dur-ing the Orderdur-ing Interval and about 50% of the Web interaction transactions are ordering and shopping respectively. This metric reflects the data updating performance in database server. Among these metrics, the Web interactions re-sponse time must satisfy the limitations speci-fied by TPC-W.
In addition, the resources which need to be mon-itored and analyzed include CPU utilization, memory utilization and I/O activities to pro-vide additional information for the benchmark customer or developer of DBMSs. The CPU utilization is the percentage of time for which the CPU is busy and it reflects the potentiality of a database server on data processing. The memory utilization indicates how the DBMS supports the demands of the TPC-W bench-mark efficiently and whether the DBMS have the ability to improve its performance on mem-ory utilization. The I/O activities in database indicate the ability of the DBMS dealing with I/O operations and if there are still rooms for performance improvement.
3. The Architecture of the Test Tool
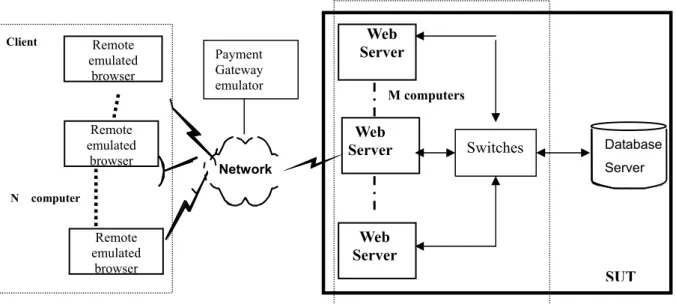
The framework of a typical E-commerce appli-cation can be logically described as a three-tier computing model. In order to test the perfor-mance of E-commerce system, the testing sys-tem should produce workload close to real ap-plications. By measuring the number of Web in-teractions per second, we will be able to evaluate the ability of the DBMS on processing trans-actions from network and the performance of whole system under test(SUT).
Remote emulated
browser
n
nsDatabase Server Web
Server
SUT
Network
Remote emulated
browser
N computer
Web Server
Web Server Payment
Gateway emulator
Remote emulated
browser
M computers
Switches
Client
Fig. 1.The architecture of the test tool.
the secondary RBEs to display the performance metrics of SUT. At the same time the master RBE also emulates browsers and produces the workload for SUT. The master RBE creates a thread to implement this function. The second tier is the one shown in the dashed box on the right and consists of several Web servers. They compose a cluster of Web servers to balance the workload from the RBEs. The third-tier is the database server on the right.
According to the TPC-W specification, the sys-tem under test consists of a number of appli-cation software packages, such as Web server, database server, but except payment gateway emulator. As the payment gateway emulator will consider the processes of the purchase con-firm interaction, and therefore its cost will not be included in the cost of SUT. Web servers are the connection to the RBEs, and all the Web in-teractions begin with the request to Web server from RBEs. The Web server sends requests to database server and payment gateway, and navi-gates RBEs to receive html pictures and images from Web server to response the requests. The testing system architecture is designed ac-cording to the typical features of the E-commerce applications. This testing system not only can be used to test the performance of E-commerce applications, but can also be used to evaluate the performance of database management systems or Web servers.
4. Data Sets in Web Interaction Transaction
4.1. Tables in Database
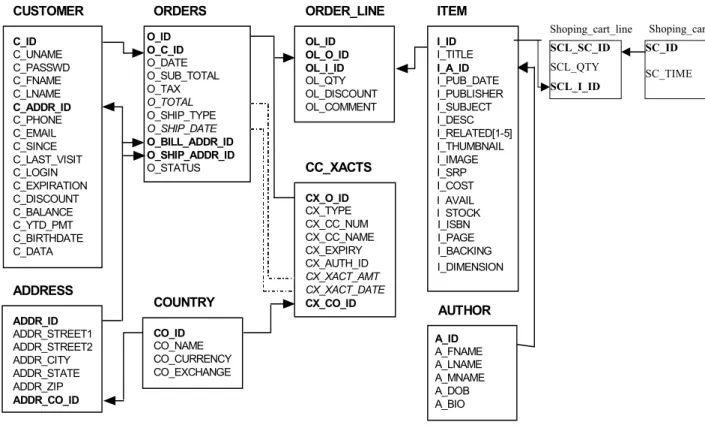
The TPC-W specification defines eight tables for the database. We add another two tables for cart information as accessorial table. All of the 10 tables and their relationships are de-fined in the entity-relationship diagram shown in Fig. 2. Dotted lines in Fig. 2 represent one-to-one relationships between non-key fields related through a business rule. These fields are shown in italic. The arrows point in the direction of one-to-many relationships between tables. And the bold types identify primary and foreign keys. According to TPC-W specification, additional tables may be added to describe cart informa-tion. All the extensions are permitted.
4.2. The Database Scaling
Database scaling is defined by the cardinality
CUSTOMER C_ID C_UNAME C_PASSWD C_FNAME C_LNAME C_ADDR_ID C_PHONE C_EMAIL C_SINCE C_LAST_VISIT C_LOGIN C_EXPIRATION C_DISCOUNT C_BALANCE C_YTD_PMT C_BIRTHDATE C_DATA ORDERS O_ID O_C_ID O_DATE O_SUB_TOTAL O_TAX O_TOTAL O_SHIP_TYPE O_SHIP_DATE O_BILL_ADDR_ID O_SHIP_ADDR_ID O_STATUS ORDER_LINE OL_ID OL_O_ID OL_I_ID OL_QTY OL_DISCOUNT OL_COMMENT ITEM I_ID I_TITLE I_A_ID I_PUB_DATE I_PUBLISHER I_SUBJECT I_DESC I_RELATED[1-5] I_THUMBNAIL I_IMAGE I_SRP I_COST I AVAIL I_ISBN I_PAGE I_BACKING I_DIMENSION CC_XACTS CX_O_ID CX_TYPE CX_CC_NUM CX_CC_NAME CX_EXPIRY CX_AUTH_ID CX_XACT_AMT CX_XACT_DATE CX_CO_ID COUNTRY CO_ID CO_NAME CO_CURRENCY CO_EXCHANGE ADDRESS ADDR_ID ADDR_STREET1 ADDR_STREET2 ADDR_CITY ADDR_STATE ADDR_ZIP ADDR_CO_ID AUTHOR A_ID A_FNAME A_LNAME A_MNAME A_DOB A_BIO l1 di I STOCK Shoping_cart SCL_SC_ID SCL_QTY SCL_I_ID Shoping_cart_line SC_ID SC_TIME
Fig. 2.The relationships between tables in the database.
Table name Cardinality (in rows) Typical row length(bytes) Typical table size(bytes)
CUSTOMER 2880 * (number of EB) 760 2,188,888 k
COUNTRY 92 70 6.44 k
ADDRESS 2 * CUSTOMER 154 887,040 k
ORDERS 0.9 * CUSTOMER 220 570,240 k ORDER_LINE 3 * ORDERS 132 1,026,432 k
AUTHOR 0.25 * ITEM 630 1,575 k
CC_XACTS 1 * ORDERS 80 207,360 k
ITEM 1k, 10k, 100k, 1M, 10M 860 8,600 k
Shoping_cart_line 12
Shoping_cart 12
Note 1: Table sizes are computed for 1,000 EB's and 10,000 items
Note 2: Values for the ITEM table do not include the item’s image and thumbnail
Note 3: The typical row lengths and table sizes given above are examples of what could result from an implementation. They are not requirements. They do not include storage and access overheads. The symbol “k” means one thousand and “M” means one million.
Note 4: No variation is allowed on table cardinality except on ORDER_LINE where the cardinality will vary slightly due to the random number of rows. Cardinality must meet a minimum requirement of 2.95 times the number of rows in the ORDER table.
Table 1.Database scaling rules after initialization.
a scale factor from these series to determine the database population. The cardinalities of these tables are shown as Table 1.
The cardinality of table AUTHOR(to store au-thor information)is the function of ITEM from above table. The cardinality of table
of WIPS must satisfy the following inequation:
(number of EB’s)/14<WIPS <(number of EB’s)/7
(4) The intent of this inequation is to prevent report-ing a throughput that exceeds the maximum, where the maximum throughput is achieved with infinitely fast Web interactions resulting in a null response time and minimum required think times(think time is the time elapsed from the last byte received by the EB to complete a Web interaction until the first byte sent by the EB to request the next Web interaction). It emulates the time the user hit the Web pages so that the test tool emulates the real environ-ment. This is computed to be 1/7 WIPS per EB. To prevent over-scaling the SUT, the through-put cannot fall short of the above 1/14 WIPS per EB, which represents 50% of the computed maximum throughput.
4.3. Web Interaction Transactions
TPC-W defines 14 Web interactions simulated from a typical Internet business environment. These transactions involve searching, updating, browsing. They are divided into two types: browsing and ordering. Most of these brows-ing transactions are database query based while most ordering transactions involving operations of insert, update and delete operations on data-base. All of the 14 transactions satisfy basic ACID transaction properties: atomicity, consis-tency, isolation and durability. The complexity of these 14 transactions accessing database is different.
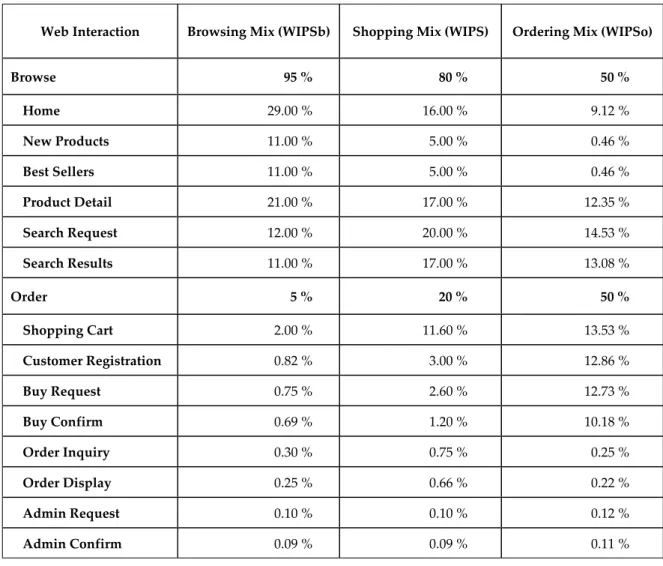
The customer’s behaviors are divided into three types: browsing, shopping and ordering accord-ing to their purposes. Different customers have different ratios of Web interactions. The ra-tios of the Web interaction transactions in three
Web Interaction Browsing Mix (WIPSb) Shopping Mix (WIPS) Ordering Mix (WIPSo)
Browse 95 % 80 % 50 %
Home 29.00 % 16.00 % 9.12 %
New Products 11.00 % 5.00 % 0.46 %
Best Sellers 11.00 % 5.00 % 0.46 %
Product Detail 21.00 % 17.00 % 12.35 %
Search Request 12.00 % 20.00 % 14.53 %
Search Results 11.00 % 17.00 % 13.08 %
Order 5 % 20 % 50 %
Shopping Cart 2.00 % 11.60 % 13.53 %
Customer Registration 0.82 % 3.00 % 12.86 %
Buy Request 0.75 % 2.60 % 12.73 %
Buy Confirm 0.69 % 1.20 % 10.18 %
Order Inquiry 0.30 % 0.75 % 0.25 %
Order Display 0.25 % 0.66 % 0.22 %
Admin Request 0.10 % 0.10 % 0.12 %
Admin Confirm 0.09 % 0.09 % 0.11 %
Page name Dynamic Join tables Images 90% response time limitation (seconds)
Admin Confirm Y 4 5 20
Admin request Y 2 6 3
Best Seller Y 4 9 5
Purchase Confirm Y 7 2 5
Purchase Request Y 6 3 3
Customer Registration N NO 4 3
Home Y 2 9 3
New Product Y 2 9 5
Order Display Y 5 2 3
Order Inquiry Y 1 3 3
Product Detail Y 2 6 3
Search Request Y 1 9 3
Search Result Y 2 9 10
Shopping Cart Y 3 9 3
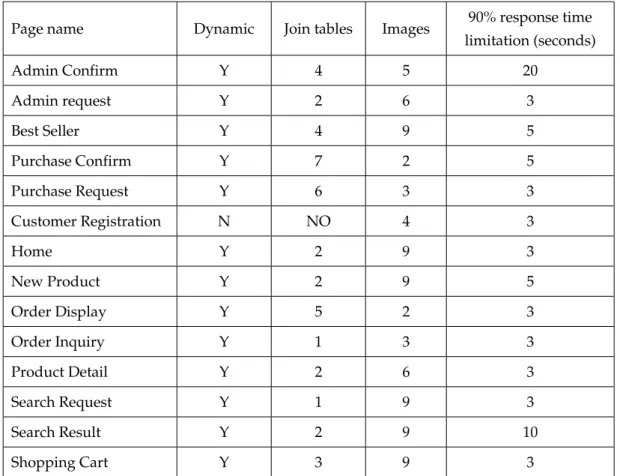
Table 3.Typical features of 14 Web interaction transactions.
types of working mode are all listed in Table 2. At the same time, different Web transac-tions have different dynamic characterizatransac-tions. The number of the table, network object and response time are different. Table 3 lists each typical Web transaction; the number of tables join involved additional base tables for describ-ing the carts.
5. Implementation
There are two main issues needing to be re-solved: (1) Remote emulated browser (RBE) initiates Web interaction transactions;(2)credit card authorization associated with some Web interactions.
5.1. Implementation of the RBEs
The RBEs simulate the users who use browser access to the system under test. A RBE creates and manages a thread for each emulated browser respectively. The testing system emulates the
scenario in which large numbers of users con-currently request services and these users have different types of Web interactions. We use Java multi-thread technology to create large numbers of users emulate Web interactions and requests. At the same time, the system will record a num-ber of performance parameters, such as: type of transaction, quantity, response-time. Fig. 3 shows the operational procedure of the RBEs.
Begin
Initialization
Create user ID randomly
Create think time for user d
Select transaction type
Send web server HTTP request
Analysis HTTP response Web page
Wait emulated think time
Fig. 3.The operational procedure of the RBEs.
the EBs for the master client. This communi-cation workload would decrease. That will not affect the overall workload and the results of the whole SUT.
5.2. The Credit Card Authorization
Secure socket layer is a secure communica-tion protocol released by Netscape. SSL uses public-key cryptography to authenticate con-nected participants and to make a private key used to encrypt data sent over the SSL con-nection. SSL authentication uses a certificate, made up of a public key and some information about the owner of the corresponding private key. The procedure of credit card authorization is:
(1)The customer provides URL of Web server, name, password and location of private key.
(2)The customer sends a Purchase request to Web server.
(3)Web server gets the certificate from PGE, and verified the validity of the certificate using the public key of PGE. Then get the public key after passing the verification.
(4)The Web server creates a session key for communication and encrypts it with public key.
(5)The customer will get the public key of Web server from PGE in the same way.
(6)After the customer decrypted the session key with his private key, he will encrypt the public key with session key and send it back to Web server.
(7)The server decrypts the session key with his private key, compares the session key with the original session key the user sent. If they are the same, the authentication is passed, otherwise authentication is failed.
The Web server will communicate with the cus-tomer using the session key to encrypt data. Although the authentication does not consume much resource, this procedure will require com-munication time and affect the response time. From the test results in paper 5], the WIPS is about 15% lower than that without SSL com-munications.
5.3. Modules
5.3.1. Data Generation Tool
Data generation tool is designed to generate a large amount of data close to real application scenarios in short period of time. There are two ways for data generation. One is based on the number of EBs and rows in ITEM table to gen-erate data randomly, the other one is to transfer data from one database to another to maintain the same data in different databases. We use the Java Database Connection (JDBC) API to connect databases. In order to speed up the data loading, we use the pre-prepared statements in JDBC which bind the data to every column of each base table.
5.3.2. ACID Properties Test Module
5.3.3. Web Page Consistency Test Module
Web pages returned by the SUT to the EB reflect the content of the database through displaying plain data and Web objects(GIF pictures). As database transactions update the content of the database, the Web pages must display a con-sistent reflection of these updates, with the ex-ception of the search result pages for title and author searches. This module emulates users’ activities to test the SUT if it reaches Web page consistency.
5.3.4. Performance Test Module
We will acquire the data and store it in database for the performance metrics for each DBMS: Web interaction transaction per second(WIPS), the price of per Web interaction($/WIPS), Web interaction transaction per second in browsing
(WIPSb), Web interaction transaction per sec-ond in ordering (WIPSo), type, number, re-sponse time, ratio of success, mean think time of the interaction.
5.3.5. Result Analysis Module
The module will build graphs for the test pro-cedure such as WIPS, WIPSb, WIPSo, and re-sponse time for every test. And it will display tables for 14 Web interaction transactions. The metrics include: WIPS, WIPSb, WIPSo, the number of users, start, interval and end of test-ing, mean think time and so on.
6. Experimental and Results
This test tool has been used to compare DM4 8]and SQL Server 2000 10]. Analyses of the testing procedure and of the initial testing re-sults are introduced in this section.
6.1. The Testing Procedure
The final results of WIPS, WIPSb, WIPSo are the maximum processing ability of the system to research under the condition of response time limitation specified in Table 3.
The tests are performed following the procedure below:
(1)Load test data, specify the number of EBs; (2)Fast test;
(3)Checking if the results will satisfy the re-quirements of the response time and think time. There are three options:
1. If they do not, it means that the workload is too heavy(too many users), and go to step 4;
2. If the response time is much less than the limitation of TPC-W specification, go to step 5;
3. If the workload is suitable, go to step 6;
(4)Decrease the number of EB, restore the data to initialization, go to step 2;
(5)Increase the number of EB, restore the data to initialization, go to step 2;
(6)Begin formal test, restore the data to initial-ization, test under the three modes respec-tively, end.
In the course of the tests above, the time inter-vals in formal test sustain 30 minutes. Before the test, the stabilization time needed for DBMS under the workload is 10 to 15 minutes. In the mean time, we can design optimize policy for the databases by creating indices or cluster in-dices on the base tables. These are permitted by TPC-W specification. We can configure the DBMS to reach optimal performance without changing the population of database during the test.
6.2. Test Result and Analysis
6.2.1. The Testing Environment
&OLHQW :HEVHUYHU 'DWDEDVHVHUYHU
26 :,1'2:6$'9$1&('6(59(5 :,1'2:6$'9$1&('6(59(5 :,1'2:6$'9$1&('6(59(5
GDWDEDVH 1R 1R Microsoft SQL Server 2000 or DM4
7HVWV\VWHP 73&:WHVWV\VWHP :HEORJLFVHUYHU 1R
&38 3*hFRPSXWHU 3*hFRPSXWHU h3*;HRQ
V\VWHP FRPSDWLEOHFRPSXWHU FRPSDWLEOHFRPSXWHU /HJHQG7
0HPRU\ h0 h0 h0
'LVN h*WXUQ h*WXUQ5$,' 6&6,˖h*WXUQ
1HWZRUNFDUG 0ESV 0ESV 0ESV
RWKHUV 6\PDQWHFDQWLYLUXVLQVWDOOHG 6\PDQWHFDQWLYLUXVLQVWDOOHG 6\PDQWHFDQWLYLUXVLQVWDOOHG
Table 4.The environments of software and hardware of two DBMS tested.
6.2.2. Data Loading Test
Before the test, we create table space of the ca-pacity 25G for DM4 so that the system avoids unnecessary extension table space to speed up loading. We create initial base tables on the ta-ble space. At the same time we create a database of the capacity 25G for Microsoft SQL Server 2000. In the environment introduced in Table 4, we tested the load time used, memory utiliza-tion, and CPU utilization in Table 5. The two databases run under their default configurations when the data is loaded. The test tool uses pre-prepared statement in JDBC to speed up loading and commits once after inserting 10 000 rows. The utilization of memory is an approximate range as we record them from tools provided by Windows 2000. Data loading time by DM4 is much slower than Microsoft SQL Server 2000, which indicates the performance of data
manip-ulating under large quantities of data. As the memory utilization of DM4 is much less than Microsoft SQL Server 2000, it shows that DM4 has potential for improvement.
6.2.3. Performance Test
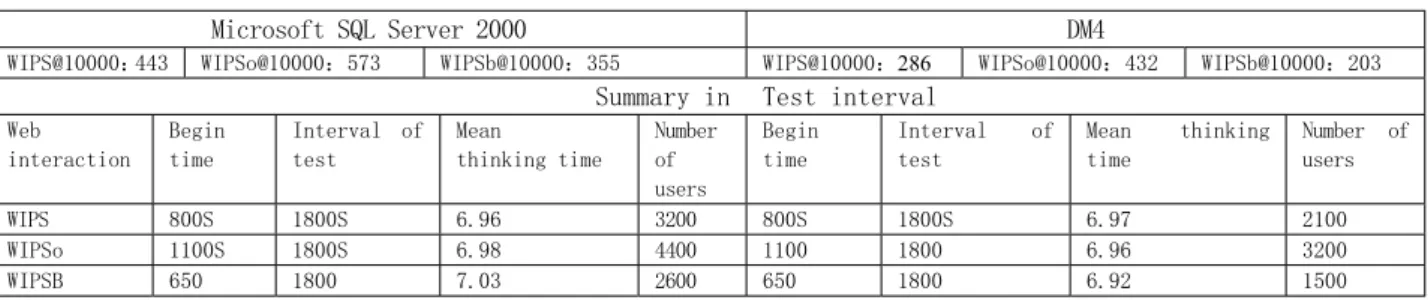
We tested the performance of DM4 and Mi-crosoft SQL Server 2000 using the procedure in-troduced in section 6.1. The results are shown in Table 6. The curves shown in Fig 4 and 5, illus-trate the metrics WIPS of Microsoft SQL Server 2000 and DM4. From this diagram we can see that Microsoft SQL Server 2000 has better per-formance than DM4, it runs very smoothly and doesn’t fluctuate rapidly. Compared with Fig. 4 and Fig. 5, because the curve fluctuates rapidly, this indicates that there exists some performance bottleneck in DM4. After we compare WIPSb in Table 6 under the browsing mix ulteriorly
databases
metrics
DM4 Microsoft SQL Server 2000
Memory utilization˄MB˅ 15-20 230-430 CPU utilization 70-80% 30-60%
Time used About 20 hours 28 minutes 14 hours
Table 5.The time consumed and CPU utilization in data loading test
0LFURVRIW64/6HUYHU '0
:,36#˖ :,36R#˖ :,36E#˖ :,36#˖286 :,36R#˖ :,36E#˖
6XPPDU\LQ 7HVWLQWHUYDO
:HE LQWHUDFWLRQ
%HJLQ WLPH
,QWHUYDO RI WHVW
0HDQ WKLQNLQJWLPH
1XPEHU RI XVHUV
%HJLQ WLPH
,QWHUYDO RI WHVW
0HDQ WKLQNLQJ WLPH
1XPEHU RI XVHUV
:,36 6 6 6 6
:,36R 6 6
:,36%
Fig. 4.Microsoft SQL Server 2000 wips.
Fig. 5.DM4 wips.
of two DBMSs, we found that the query opti-mization needs to be improved in DM4, because most of the users(95% with TPC-W limitation) in browsing mix mode are database queries and the ratio of data updating among users is 5%. After we compare with WIPSo in Table 6, we can conclude that WIPSo in DM4 is a little bet-ter. It indicates that when users update small amount of data the performance in DM4 is fairly good, but still has a small gap with Microsoft SQL Server 2000.
Based on our initial test results of comparing DM4 and SQL Server 2000, we identified the following factors which affect the performance of DM4:
(1)Query optimization: because the WIPSb metrics of DM4 is low, one possible area needs to be improved is the query optimiza-tion policy. When the number of users in-creases, the number of tuples in database being locked will also increase, and the per-formance will decrease rapidly. Therefore, many requests will not get the response and be interrupted. Besides, TPC-W specifies some complex queries, so DBMS should provide different query optimization poli-cies for them. But in DM4, it is required to give a special optimization SQL statement
to perform this task in order to let the sys-tem reach its optimal performance, while Microsoft SQL Server 2000 doesn’t need to regulate that, it can chose a suitable one automatically.
(2)Updating large quantity of data: The pro-cess of updating a large amount of data in DM4 can be very slow compared with Mi-crosoft SQL Server 2000, especially for data loading meanwhile creating indexes. That indicates that the buffer management and memory utilization need to be investigated.
7. Summary
We have designed and implemented a testing tool running TPC-W. It is capable of measuring the system throughput and other performance metrics, as well as of collecting the accessory statistics of resources utilization, such as the CPU utilization, memory utilization and I/O activities. This tool can be been used to analyse various performance–related issues. By using this test system, we compared the performance of DM4 and Microsoft SQL Server 2000, and the initial test results have been used for DM4 performance analysis.
References
1] H. W. CAIN, R. RAJWAR, M. MARDEN, M. H. LI -PASTI, An architectural evaluation of Java TPC-W, inProceedings of the Seventh International Sympo-sium on High-Performance Computer Architecture
(HPCA’01), NW Washington, DC USA: IEEE
Computer Society,(2001), pp. 229–240.
2] W. R. DAVIS, N. ZHANG, K. CAMERA ET AL., A Design Environment for High Throughput, Low Power Dedicated Signal Processing Systems.IEEE Journal of Solid-State Circuits, 37(3),(2002), pp. 420–431.
3] P. FOGLIA, R. GIORGI, CA Prete, Evaluating Opti-mizations for Multiprocessors E-commerce Server Running TPC-W Workload, inProceedings of the 34th Hawaii International Conference on System Sciences, Hawaii. Fourer, R. and J.P. Goux, 1,
(2001), pp. 1–9.
5] D. F. GARCIA, J. GARCIA, Tpc-w e-commerce benchmark evaluation. IEEE Computer, 36(2), (2003), pp. 42–48.
6] F. J. HIRSCH, Introducing SSL and certificates using SSLeay.World Wide Web Journal, 2(2)(1997), pp. 141–173.
7] D. A. MENASCE´, TPC-W: A Benchmark for E-Commerce,IEEE Internet Computing, 6(3)(2002), pp. 83–87.
8] Database Management System DM4.
http://www.dameng.cn.
9] Standard Performance Evaluation Corporation.
SPECweb99 Benchmark.
http://www.spec.org.
10] SQL server Home.
http://www.microsoft.com/sql/
11] Transaction Processing Performance Council (TPC), TPC BENCHMARK
TMW
(Web Com-merce)Specification Version 1.8.
http://www.tpc.org.
Received:May, 2005
Accepted:February, 2006
Contact address:
Zhu Hong Huazhong University of Science and Technology Wuhan, Hubei, 430074 P. R. China e-mail:[email protected] Fu Xin Huazhong University of Science and Technology Wuhan, Hubei, 430074 P. R. China e-mail:[email protected]
Lin Qiu Hui Huazhong University of Science and Technology Wuhan, Hubei, 430074 P. R. China e-mail:[email protected] Kevin L¨u BBS, Room76, Tin Building Brunel University Uxbridge UK UB8 3PH e-mail:[email protected]
ZHUHONGis an associate professor at the School of Computer Sci-ence and Technology, Huazhong University of SciSci-ence and Technology, Wuhan, Hubei, China. She obtained her Ph.D. in Computer Software & Theoretical Computer Science in 2001. Her current research areas are database security, database management system implementation.
FUXINis an lecturer at the School of Computer Science and Technol-ogy, Huazhong University of Science and TechnolTechnol-ogy, Wuhan, Hubei, China. He obtained his M.S. in Computer Software & Theoretical Com-puter Science in 2002. His research areas include database management system implementation, software testing.
LINQIUHUIis a software engineer in Oracle China Development Center. She obtained her M.S. in Computer Software & Theoretical Computer Science in 2004. Her research areas are test of database system and performance evaluation.