VOLUME 18 ISSUE 1 (2020), Page 160 – 171
QUANTIFICATION OF SOLID WASTE IN SCHOOL CANTEENS – A CASE STUDY FROM A HULU SELANGOR MUNICIPALITY,
SELANGOR
Saraswathy Kasavan1, Nurul Izzati Mohd Ali2 & Nadia Azia Masarudin3
1
Institute for the Environment and Development (LESTARI)
UNIVERSITI KEBANGSAAN MALAYSIA 2
School of Social Development and Environmental Studies,
UNIVERSITI KEBANGSAAN MALAYSIA 3
Sekolah Menengah Tahfiz Darul Ridzuan
DAERAH MANJUNG, PERAK
Abstract
Obtaining empirical data on solid waste generation and composition is imperative to promote efficient waste management in schools. The paper aims to examine the characteristics and composition of waste generated ‘during food preparation’ stage and ‘after consumption’ stage, waste per capita and the assumption of economic valuation of solid waste for recycling. In this study, solid waste was quantified with transparency through adopting the direct weighing method to obtain reliable and accurate information of solid waste generated at the selected ten school canteens in Hulu Selangor municipality, Malaysia. Based on the result gathered, the total quantity of solid waste generated at 10 school canteens is about 162.8 kg/day with the average solid waste of 19.6 g per capita per day. The total assumption of the economic value of solid waste per day for recycling in all 10 schools’ canteens is about RM 30.70, which shows that recyclable materials have high revenue potential, as well as economic benefits. The present study empirically promotes the transparency of solid waste quantification at the school level, which could help identify hotspots and strategies with the greatest potential for waste reduction.
INTRODUCTION
Just like in other developing countries, the quantification of municipal solid waste (MSW) generated in urban and rural areas in Malaysia has becoming more complex. In this light, the Malaysian population has generated various categories of waste, including as food waste, plastics, bottles, glass, papers, metals, diapers and fabrics (Tiew et al., 2019). The rate of waste generation in Malaysia is estimated at 1.17 kg per day per person in 2018, which has significantly increased from 0.8 kg per day per person in 2005 (Chu, 2019). The recent data on MSW generation in Malaysia about 38,142 tonnes of waste per day in 2018, which skyrocketed from 19, 000 tonnes of waste a day in 2005 (Chu, 2019). Such large quantities of MSW has caused significant environmental impacts, including air pollution, groundwater pollution, depletion of soil fertility, toxic gas emissions and bad odour (Karim Ghani et al., 2013).
As a sector of major interest for intervention, the schools also are considered as one of the highest solid waste generator other than household. The high volume of waste generation in schools is partly due to the fact that students and teachers spend most of their time in school and use a variety of resources. Subsequently, they generate different types of solid waste, which may represent a significant source of solid waste. Relevant actions in reducing solid waste at the school level could help increase awareness on sustainable waste management. The present study focuses on solid waste generation in primary and secondary school canteens to gain insights about the situation of solid waste management and to promote transparency in solid waste quantification. To implement a proper solid waste management practice, it is essential to understand comprehensive quantification of waste generated and its composition before implementing any process towards reducing solid waste. In other words, accurate solid waste quantification is required to identify hotspots and strategies with the greatest potential for waste reduction.
composition during food preparation and after the consumption stage, waste per capita and the assumption of economic valuation of solid waste for recycling.
MATERIALS AND METHODS
Description of the study material
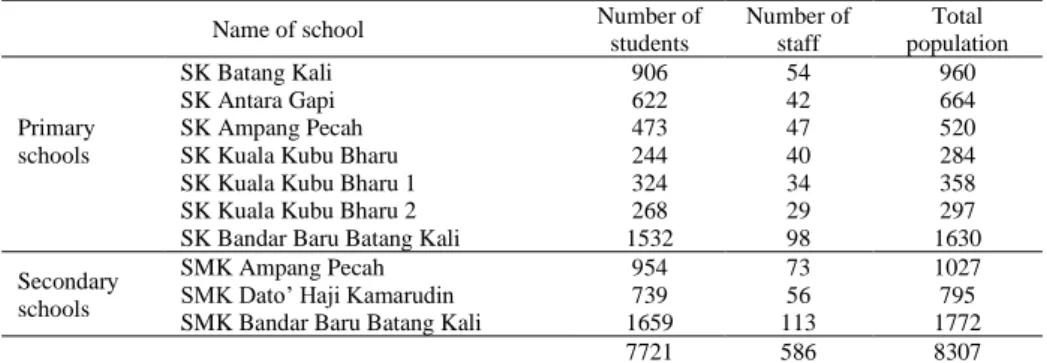
The data for this study were collected from ten public schools (7 primary schools and 3 secondary schools) located in Kuala Kubu Bharu, Batang Kali and Serendah as shown in Table 1. Due to time and budget limitations, this study only considered waste produced in the school canteen, which is normally managed by independent food service contractors. This study focuses on the quantification of solid waste generation in the 10 selected public schools. These schools are located within short geographical distance of each other. The data were collected after getting the permission from the school management and canteen managers. In Malaysia, pupils aged 7 to 12 attend primary schools, while students aged 13 to 17 attend secondary schools. Regardless of their level of study, all of these students follow a “full-time” schedule, where classes are spread over five days a week (Monday to Friday) and schools commence from 7.00 a.m. to 1.00 p.m.
Table 1 A total number of selected schools in Hulu Selangor
Name of school Number of
students
Number of staff
Total population
Primary schools
SK Batang Kali SK Antara Gapi SK Ampang Pecah SK Kuala Kubu Bharu SK Kuala Kubu Bharu 1 SK Kuala Kubu Bharu 2 SK Bandar Baru Batang Kali
906 54 960
622 42 664
473 47 520
244 40 284
324 34 358
268 29 297
1532 98 1630
Secondary schools
SMK Ampang Pecah 954 73 1027
SMK Dato’ Haji Kamarudin 739 56 795
SMK Bandar Baru Batang Kali 1659 113 1772
7721 586 8307
quantification of the weight or volume of the waste. First, the researcher separated the waste into various categories, such as tin cans, disposable plastic food containers, paper and plastic, which were mixed with the food waste. The transparency of solid waste quantification was ensured by cooperating with the kitchen staff and the process used a weighing scale (in kilograms), large biodegradable garbage bags (to separate the waste into various categories), pen and paper (for making notes), gloves, caps and aprons. Later, all data on solid waste generation and waste composition were transferred from paper into an Excel data sheet to record the masses of waste.
Analysis Data
The first analysis determines the total quantity of solid waste generated at each school per day, specifically solid waste generated between 10.00hrs until 14.00hrs. The data was presented in the form of graph and analysis to simple descriptive statistics to understand the difference between the total waste generated in each school and obtain a better view of the waste issue at the school level. The solid waste generation in school canteen involved two stages; first, ‘during food preparation’ stage, and second, ‘after the consumption’ stage.
The second analysis explains the volume of waste generated per capita. The waste per capita quantification guidelines is highly influenced by a previous study conducted by Malefors et al., (2019), but this study made some adjustment based on the data available to make sure that the quantification of solid waste is representative of each school studied. The waste per capita can be referred to as total solid waste generation per person from each school. This calculation will lead to handle asymmetry in the data and help the school community to reduce solid waste. Thus, the waste per capita can be calculated using the equation below:
𝑊𝑎𝑠𝑡𝑒 𝑝𝑒𝑟 𝑐𝑎𝑝𝑖𝑡𝑎 = ∑ 𝑋𝑖 (𝑤𝑎𝑠𝑡𝑒 𝑔𝑒𝑛𝑒𝑟𝑎𝑡𝑖𝑜𝑛) 𝑛
𝑖=1
∑𝑛𝑖=1𝑌𝑖 (𝑛𝑢𝑚𝑏𝑒𝑟 𝑜𝑓 𝑝𝑜𝑝𝑢𝑙𝑎𝑡𝑖𝑜𝑛)
Xi refers to the total waste production in each school, while Yi is defined as the total population of each school. Thus, the total waste per capita can be measured by dividing the total waste generation and the population in each school.
different classes. Then, the market value was multiplied with the mass of the solid waste based on these classes. While a small item of solid waste is regarded as having a small value, it will still cause value loss when it is directly sent to landfill without recovery of waste, particularly recycling.
RESULTS
Solid Waste Generation
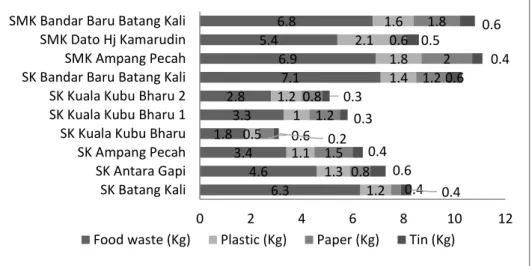
Figure 1 shows the 4 main types of total solid waste (such as food waste, plastic, paper and tin) produced ‘during food preparation’ stage in school canteen daily. Food waste generated ‘during food preparation’ stage is considered as unavoidable food waste because only the edible parts of the raw materials will be used, while others are thrown away. Other than food waste, there is a high number of plastic wastes, which most of the plastics were generated ‘during food preparation’ stage, such as packaging materials of oils, sugar, salt and others. They also include bigger plastics used to pack all the raw food materials which were bought at the nearby market. Meanwhile, papers found in the kitchen’s dustbin mainly originated from newspapers that are normally used to cover the cooking table. Tin cans found consists of the packaging materials of creamer, Milo and others canned food items.
Figure 1 Total amount of solid waste produced ‘during food preparation’ stage at school canteen per day
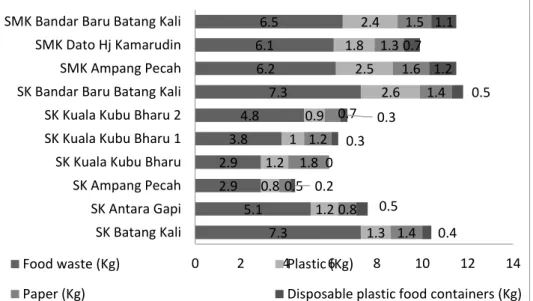
Figure 2 shows the total amount of solid waste produced ‘after the consumption’ stage at each school canteen per day. Based on the table, the proportion of food waste is higher compared to other types of solid waste. Food waste collected ‘after the consumption’ stage is mostly edible, but was not
6.3 4.6 3.4 1.8 3.3 2.8 7.1 6.9 5.4 6.8 1.2 1.3 1.1 0.5 1 1.2 1.4 1.8 2.1 1.6 0.4 0.8 1.5 0.6 1.2 0.8 1.2 2 0.6 1.8 0.4 0.6 0.4 0.2 0.3 0.3 0.6 0.4 0.5 0.6
0 2 4 6 8 10 12
SK Batang Kali SK Antara Gapi SK Ampang Pecah SK Kuala Kubu Bharu SK Kuala Kubu Bharu 1 SK Kuala Kubu Bharu 2 SK Bandar Baru Batang Kali SMK Ampang Pecah SMK Dato Hj Kamarudin SMK Bandar Baru Batang Kali
consumed by the students or teachers. It also includes unavoidable food waste, such as fish guts and chicken bones. There are 3 other main solid wastes generated at the school canteen ‘after the consumption’ stage which are plastic, paper and disposable plastic food containers. These three types of solid waste are used to pack the food to make it easier to serve. Normally, food is packed first either using plastic, paper or disposable plastic food containers, so that it is easier and faster for the canteen staff to serve food to a larger number of the students within the 20 minutes recess time. In this regard, a large amount of plastic, paper and disposable plastic food containers are used in the canteen. SK Kuala Kubu Bharu does not have disposable plastic food containers in its dustbin because they only served food in plates, plastics and paper wrappers. The solid waste found in the dustbin comprises of disposable plastic food containers which are more lightweight compared to other types of solid waste.
Figure 2 Total amount of solid waste produced after consumption stage at school canteen per day
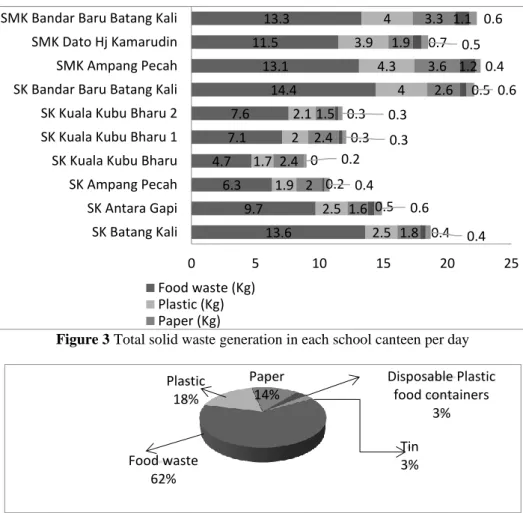
Figure 3 and 4 show the total solid waste generation in each school canteen per day. There are 5 main solid wastes generated in the school canteen. Food waste, plastic, paper and disposable plastic food containers are generated ‘after the consumption’ stage. The waste generated ‘during food preparation’ stage include food waste, plastic, paper and tin cans, but there were no disposable plastic food containers. The total generation of solid waste in the school canteen for all ten schools is 162.8 kg per day. The total weight of food waste produced at all ten schools is 101.3 kg per day, which comprises of 62% of the total food weight. The weight of plastic is about 28.9kg (18%), which is higher than paper
7.3 5.1 2.9 2.9 3.8 4.8 7.3 6.2 6.1 6.5 1.3 1.2 0.8 1.2 1 0.9 2.6 2.5 1.8 2.4 1.4 0.8 0.5 1.8 1.2 0.7 1.4 1.6 1.3 1.5 0.4 0.5 0.2 0 0.3 0.3 0.5 1.2 0.7 1.1
0 2 4 6 8 10 12 14
SK Batang Kali SK Antara Gapi SK Ampang Pecah SK Kuala Kubu Bharu SK Kuala Kubu Bharu 1 SK Kuala Kubu Bharu 2 SK Bandar Baru Batang Kali SMK Ampang Pecah SMK Dato Hj Kamarudin SMK Bandar Baru Batang Kali
Food waste (Kg) Plastic (Kg)
(23.1 kg or 14%) and disposable plastic food containers (5.2 kg or 3%). The highest percentage of all school which is around 52% to 73%. Plastic waste makes up around 13% to 21% of the waste. There are some schools that use paper wrappers than plastic, such as SK Ampang Pecah, SK Kuala Kubu Bharu and SK Kuala Kubu Bharu 1. Normally, fried rice, nasi lemak, noodles and vermicelli are packed using paper wrappers. Some of the school canteens staff use plates to serve the food to lower the cost of packaging, however, many more manpower is needed to serve the food.
Figure 3 Total solid waste generation in each school canteen per day
Figure 4 Percentage of solid waste generation in each school canteen per day
Waste Per Capita
The waste per capita for each school is presented in Figure 5. This finding shows a higher waste per capita in the primary schools compared to the secondary schools. Specifically, SK Kuala Kubu Bahru 2 produced the highest waste per
13.6 9.7 6.3 4.7 7.1 7.6 14.4 13.1 11.5 13.3 2.5 2.5 1.9 1.7 2 2.1 4 4.3 3.9 4 1.8 1.6 2 2.4 2.4 1.5 2.6 3.6 1.9 3.3 0.4 0.5 0.2 0 0.3 0.3 0.5 1.2 0.7 1.1 0.4 0.6 0.4 0.2 0.3 0.3 0.6 0.4 0.5 0.6
0 5 10 15 20 25
SK Batang Kali SK Antara Gapi SK Ampang Pecah SK Kuala Kubu Bharu SK Kuala Kubu Bharu 1 SK Kuala Kubu Bharu 2 SK Bandar Baru Batang Kali SMK Ampang Pecah SMK Dato Hj Kamarudin SMK Bandar Baru Batang Kali
capita (39.7 g per capita per day) followed by SK Kuala Kubu Bahru 1 (33.8 g per capita per day). SMK Bandar Baru Batang Kali indicated the lowest waste per capita (12.6 g per person per day). In summary, waste generation at school canteens in this study is still lower as compared to school canteens from other countries. This is probably due to the limited number of sample size in our study. However, solid waste generation is skyrocketing as the number of students’ increase.
Figure 5 Waste per capita
Assumption of Economic Valuation for Recycling Solid Waste
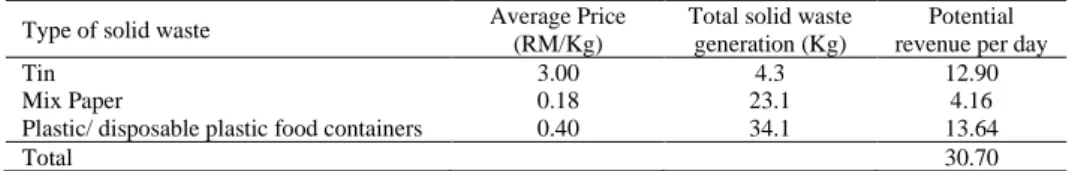
Table 2 shows that the price of solid waste collected for recycling. The rate was obtained from the 2016 data published by Alam Flora Sdn Bhd. As the price of tin cans for recycling is about RM 3.00 per kilogram, they can generate potential revenue of RM 12.90 per day, while the recycling of mixed paper can generate up to RM4.16 per day. Moreover, the value of recycling for each kilogram of plastic and disposable plastic food containers is RM 0.40, and it could generate the potential revenue of RM13.64 per day. Sending solid waste to the nearest recycling market could generate potential revenue from solid waste recycling to provide additional income for the school community.
SK Batang Kali (23.3g)
SK Antara Gapi (22.0g)
SK Ampang Pecah (13.6g)
SK Kuala Kubu Bharu (39.7g)
SK Kuala Kubu Bharu 1 (33.8g)
SK Kuala Kubu Bharu 2 (31.7g)
SK Bandar Baru Batang Kali
(20.8g)
SMK Ampang
Pecah (22.4g)
SMK Dato Hj Kamaruddin
(19.5g)
SMK Bandar Baru Batang Kali
(12.6g)
Table 2 Price of solid waste for recycling collected and potential revenue per day
Type of solid waste Average Price
(RM/Kg)
Total solid waste generation (Kg)
Potential revenue per day
Tin 3.00 4.3 12.90
Mix Paper 0.18 23.1 4.16
Plastic/ disposable plastic food containers 0.40 34.1 13.64
Total 30.70
*Note: Market price set by from Alam Flora Sdn Bhd. (2016)
DISCUSSION
Although solid waste seems to be a common problem in the hospitality sector, including at the schools’ level in both developed and developing countries, it is challenging to find a ‘quick fix’ solution for the precise scale of the problem. Thus, holistic and efficient waste management at the school level requires reliable and accurate data on solid waste generation and composition. While quantifying of solid waste is a challenging task, it is crucial to gain a better understanding of the sources of solid waste generation and to identify hotspots and strategies to optimize waste reduction. In the present study, solid waste was quantified with transparency at the school level by adopting a direct weighing solid waste method to get reliable and accurate information of solid waste generated. This method was used in similar past works (Miezah, Obiri-Danso, Kádár, Fei-Baffoe, & Mensah, 2015; Taghipour, Amjad, Aslani, Armanfar, & Dehghanzadeh, 2016). In this light, to the best of our knowledge, this study is one of the first study to conduct first-hand data collection based on solid waste generation in Malaysian schools. Even though the finding of this study is not the representative of estimation for the whole domestic solid waste produced by all schools, but it is useful to adopt a precise scale to collect data throughout a short quantification period to address the solid waste problem at school level in Malaysia. On the other hand, it is important to note that just like other single case studies, there are some limitations, for instance, this study did not include the solid waste generated in the other places at the school (e.g. classrooms, administration office, laboratories, libraries and playground field) and the quantification process is limited to the canteen at the school. Nevertheless, previous studies analysing the whole solid waste generation process at the school (Rada et al., 2016).
depends on the population of students and teacher in the schools. However, the results highlight that the generation of solid waste at the school level is not only related to the number of students and teachers but also the waste management that is carried out and intention of reduce waste among the students and teachers. For example, SMK Ampang Pecah generates the highest amount of solid waste (22.6 kg per day) compared to the SMK Bandar Baru Batang Kali (22.3 kg per day) which has a higher number of the school population (1659 students and 113 teachers).
The waste per capita analysis conducted in this study provides a benchmarking tool for waste generation quantification in the school canteen. It would be in the interest of the food service or canteen operators to conduct regular waste audits because the quantification of solid waste can help to improve waste management and subsequently, waste generation. The results of the study show that the average solid waste in schools is 19.6 g per capita per day and food waste are most commonly wasted, while other types of solid waste represent the minor waste. This discrepancy of waste per capita may arise from different food consumption pattern and waste management among the school community.
The issues related to waste will continue if wastes are still considered as non-valuable resources (Saraswathy Kasavan, 2017). This view needs to be changed, as waste has a economic value through changes in management system from land-filling to recovery of waste particularly on the recycling of solid waste. Changing the students’ and teacher’ perception is crucial where they should know that turning waste into valuable resources will reduce the dependency of the ecosystem as the space for waste disposal and also non-renewable natural resources. In terms of solid waste at schools, students may have the only superficial impact of waste on the environmental problem and do not clearly understand that sending waste to landfills will generate economic losses. This case study also demonstrates the assumption of economic valuation of solid waste for recycling, which rises the motivation towards reducing solid waste by applying the hierarchy of sustainable waste management, particularly on the recycling of solid waste.
CONCLUSION
kg/day. Although the waste per capita is not significantly high, it is important to measure it to find new ways of developing management strategies for waste reduction in their food service business operation. The total assumption for the economic value of solid waste per day for recycling at all 10 school canteens is about RM 30.70, which shows that recycling materials has a high revenue potential as well as economic benefits.
REFERENCES
Boschini, M., Falasconi, L., Giordano, C., & Alboni, F. (2018). Food waste in school canteens: A reference methodology for large-scale studies. Journal of Cleaner Production, 182, 1024–1032.
Chu, M. mei. (2019). Generating more waste than ever. Star Online, p. 1.
Karim Ghani, W. A. W. A., Rusli, I. F., Biak, D. R. A., & Idris, A. (2013). An application of the theory of planned behaviour to study the influencing factors of participation in source separation of food waste. Waste Management, 33(5), 1276–1281. Liao, C. (2019). Environmental Education , Knowledge , and High School Students ’
Intention toward Separation of Solid Waste on Campus. International Journal of Environmental Reseach and Public Health, 1659(16).
Malefors, C., Callewaert, P., Hansson, P.-A., Hartikainen, H., Pietiläinen, O., Strid, I., Eriksson, M. (2019). Towards a Baseline for Food-Waste Quantification in the Hospitality Sector—Quantities and Data Processing Criteria. Sustainability,
11(13), 3541.
Miezah, K., Obiri-Danso, K., Kádár, Z., Fei-Baffoe, B., & Mensah, M. Y. (2015). Municipal solid waste characterization and quantification as a measure towards effective waste management in Ghana. Waste Management, 46, 15–27.
Papargyropoulou, E., Wright, N., Lozano, R., Steinberger, J., & Padfield, R. (2016). Conceptual framework for the study of food waste generation and prevention in the hospitality sector. Waste Management, 49, 326–336.
Rada, E. C., Bresciani, C., Girelli, E., Ragazzi, M., & Schiavon, M. (2016). Analysis and Measures to Improve Waste Management in Schools. Sustainability, 840(8), 1– 12.
Saraswathy Kasavan, A. fariz M. and S. A. H. (2017). Sustainable food waste management in hotels: Case study langkawi UNESCO global geopark. Planning Malaysia, 15(4).
Saraswathy Kasavan, A. fariz M. and S. A. H. (2018). Knowledge and attitudes of hoteliers in Langkawi UNESCO Global Geopark towards Sustainable Food Waste Management (SFWM ). Social Sciences & Humanities, 26(3), 1941–1955. Saraswathy Kasavan, A. fariz M. and S. A. H. (2019). Drivers of food waste generation:
Case study of island-based hotels in Langkawi, Malaysia. Waste Management, 91, 72–79.
Tiew, K. G., Basri, N. E. A., Deng, H., Watanabe, K., Zain, S. M., & Wang, S. (2019). Comparative study on recycling behaviours between regular recyclers and non regular recyclers in Malaysia. Journal of Environmental Management,