Monitoring Java Applications
eG Enterprise v6.0
Restricted Rights Legend
The information contained in this document is confidential and subject to change without notice. No part of this document may be reproduced or disclosed to others without the prior permission of eG Innovations Inc. eG Innovations Inc. makes no warranty of any kind with regard to the software and documentation, including, but not limited to, the implied warranties of merchantability and fitness for a particular purpose.
Trademarks
Microsoft Windows, Windows NT, Windows 2003, and Windows 2000 are either registered trademarks or trademarks of Microsoft Corporation in United States and/or other countries.
The names of actual companies and products mentioned herein may be the trademarks of their respective owners.
Copyright
©2015 eG Innovations Inc. All rights reserved.
Table of Contents
MONITORING A JAVA APPLICATION ... 1
1.1 How does eG Enterprise Monitor Java Applications? ... 2
1.1.1 Enabling JMX Support for JRE ... 2
1.1.2 Enabling SNMP Support for JRE ... 14
1.2 The Java Transactions Layer ... 19
1.2.1 Java Transactions Test ... 20
1.3 The JVM Internals Layer ... 38
1.3.1 JMX Connection to JVM ... 39
1.3.2 JVM File Descriptors Test ... 40
1.3.3 Java Classes Test ... 41
1.3.4 JVM Garbage Collections Test ... 44
1.3.5 JVM Memory Pool Garbage Collections Test ... 47
1.3.6 JVM Threads Test ... 52
1.4 The JVM Engine Layer ... 62
1.4.1 JVM Cpu Usage Test ... 63
1.4.2 JVM Memory Usage Test ... 68
1.4.3 JVM Uptime Test ... 74
1.4.4 JVM Leak Suspects Test ... 78
1.5 What the eG Enterprise Java Monitor Reveals? ... 88
1.5.1 Identifying and Diagnosing a CPU Issue in the JVM ... 89
1.5.2 Identifying and Diagnosing a Thread Blocking Issue in the JVM ... 93
1.5.3 Identifying and Diagnosing a Thread Waiting Situation in the JVM ... 98
1.5.4 Identifying and Diagnosing a Thread Deadlock Situation in the JVM ... 102
1.5.5 Identifying and Diagnosing Memory Issues in the JVM ... 106
1.5.6 Identifying and Diagnosing the Root-Cause of Slowdowns in Java Transactions... 109
Table of Figures
Figure 1: Layer model of the Java Application ... 1
Figure 2: Selecting the Properties option ... 6
Figure 3: The Properties dialog box ... 7
Figure 4: Deselecting the ‘Use simple file sharing’ option ... 8
Figure 5: Clicking the Advanced button ... 8
Figure 6: Verfying whether the Owner of the file is the same as the application Owner ... 9
Figure 7: Disinheriting permissions borrowed from a parent directory ... 10
Figure 8: Copying the inherited permissions ... 10
Figure 9: Granting full control to the file owner ... 11
Figure 10: Scrolling down the jmxremote.password file to view 2 commented entries ... 12
Figure 11: The jmxremote.access file ... 13
Figure 12: Uncommending the ‘controlRole’ line ... 13
Figure 13: Appending a new username password pair... 14
Figure 14: Assigning rights to the new user in the jmxremote.access file ... 14
Figure 15: The snmp.acl file ... 16
Figure 16: The snmp.acl file revealing the SNMP ACL example ... 16
Figure 17: Uncommenting the code block ... 17
Figure 18: The edited block ... 18
Figure 19: The test mapped to the Java Transactions layer... 20
Figure 20: The layers through which a Java transaction passes ... 21
Figure 21: How eG monitors Java transactions ... 22
Figure 22: The eG Application Server Agent tracking requests using Java threads ... 24
Figure 23: The detailed diagnosis of the Slow transactions measure ... 32
Figure 24: The Method Level Breakup section in the At-A-Glance tab page ... 33
Figure 25: The Component Level Breakup section in the At-A-Glance tab page ... 34
Figure 26: Query Details in the At-A-Glance tab page ... 34
Figure 27: Detailed description of the query clicked on ... 35
Figure 28: The Trace tab page displaying all invocations of the method chosen from the Method Level Breakup section ... 35
Figure 29: The Trace tab page displaying all methods invoked at the Java layer/sub-component chosen from the Component Level Breakup section ... 36
Figure 30: Queries displayed in the SQL/Error tab page ... 37
Figure 31: Errors displayed in the SQL/Error tab page ... 37
Figure 32: The detailed diagnosis of the Error transactions measure ... 38
Figure 33: The tests associated with the JVM Internals layer ... 39
Figure 34: Editing the startup script file of a sample Java application ... 52
Figure 35: The STACK TRACE link ... 60
Figure 36: Stack trace of a resource-intensive thread ... 61
Figure 37: Thread diagnosis of live threads ... 61
Figure 38: The tests associated with the JVM Engine layer ... 63
Figure 39: The detailed diagnosis of the CPU utilization of JVM measure ... 67
Figure 40: The detailed diagnosis of the Used memory measure ... 73
Figure 41: A sample code ... 79
Figure 42: The detailed diagnosis of the Leak suspect classes measure ... 88
Figure 43: The detailed diagnosis of the Number of objects measure ... 88
Figure 44: The Java application being monitored functioning normally ... 89
Figure 45: The High cpu threads measure indicating that a single thread is consuming CPU excessively ... 90
Figure 46: The detailed diagnosis of the High cpu threads measure ... 90
Figure 47: Viewing the stack trace as part of the detailed diagnosis of the High cpu threads measure ... 91
Figure 48: Stack trace of the CPU-intensive thread ... 91
Figure 49: The LogicBuilder.java file ... 92
Figure 50: The High cpu threads measure reporting a 0 value ... 93
Figure 51: The value of the Blocked threads measure being incremented by 1 ... 94
Figure 52: The detailed diagnosis of the Blocked threads measure revealing the details of the blocked thread ... 94
Figure 53: The Stack Trace of the blocked thread ... 95
Figure 54: The DbConnection.java program file ... 96
Figure 55: The lines of code preceding line 126 of the DbConnection.java program file ... 96
Figure 56: Viewing the stack trace of the ObjectManagerThread ... 97
Figure 57: The lines of code in the ObjectManager.java source file ... 97
Figure 58: Comparing the ObjectManager and DbConnection classes ... 98
Figure 59: The Waiting threads ... 99
Figure 60: The detailed diagnosis of the Waiting threads measure ... 99
Figure 63 : The stack trace for the SessionController thread ... 101
Figure 64: The UserSession.java file ... 101
Figure 65: The JVM Threads test reporting 0 Deadlock threads ... 102
Figure 66: The Deadlock threads measure value increasing in the event of a deadlock situation ... 103
Figure 67: The detailed diagnosis page revealing the deadlocked threads ... 103
Figure 68: Viewing the stack trace of the dadlocked threads in the detailed diagnosis page ... 103
Figure 69: The stack trace for the ResourceDataOne thread ... 104
Figure 70 : The stack trace for the ResourceDataTwo thread ... 105
Figure 71: The lines of code executed by the ResourceDataOne thread ... 105
Figure 72: The lines of code executed by the ResourceDataTwo thread ... 106
Figure 73: The Used memory measure indicating the amount of pool memory being utilized ... 107
Figure 74: The detailed diagnosis of the Used memory measure ... 107
Figure 75: Choosing a different Sory By option and Measurement Time ... 108
Figure 76: The method that is invoking the SapBusinessObject ... 108
Figure 77: The layer model of a sample Java application indicating too many slow transactions ... 109
Figure 78: The detailed diagnosis of the Slow transactions response time measure ... 110
Figure 79: The At-A-Glance tab page of the URL tree ... 111
Figure 80: The Trace tab page highlighting the single instance of the org.dom5j.io.SAXReaer.read(InputSource) method in our example ... 112
Figure 81: The Component Level Breakup ... 113
Monitoring a Java Application
Java applications are predominantly used in enterprises today owing to their multi-platform nature. Once written, a Java application can be run on heterogeneous platforms with no additional configuration. This is why, the Java technology is widely used in the design and delivery of many critical web and non-web-based applications.
The prime concern of the administrators of these applications is knowing how well the application is functioning, and how to troubleshoot issues (if any) in the performance of these applications. Most web application server vendors prescribe custom APIs for monitoring – for instance, WebSphere and WebLogic allow administrators to use their built-in APIs for performance monitoring and problem detection. The details of these APIs and how eG Enterprise uses them to monitor the application server in question is discussed elaborately in the previous chapters of this document.
Besides such applications, you might have stand-alone Java applications that do not provide any APIs for monitoring. To enable users to monitor the overall health of such stand-alone Java applications, eG Enterprise offers a generic monitoring model called the Java Application.
Figure 1: Layer model of the Java Application
Each layer of Figure 1 above is mapped to a series of tests that report critical statistics pertaining to the Java application being monitored. Using these statistics, administrators can figure out the following:
a. Has the Java heap been sized properly?
b. How effective is garbage collection? Is it impacting application performance?
c. Often, Java programs use threads. A single program may involve multiple concurrent threads running in parallel. Is there excessive blocking between threads due to synchronization issues during application design?
d. Are there runaway threads, which are taking too many CPU cycles? If such threads exist, which portions of code are responsible for spawning such threads?
e. Is the JVM managing its memory resources efficiently or is the free memory on the JVM very less? Which type of memory is being utilized by the JVM increasingly?
f. Has a scheduled JVM restart occurred? If so, when?
1.1
How does eG Enterprise Monitor Java Applications?
The Java Application model that eG Enterprise prescribes provides both agentless and agent-based monitoring support to Java applications. The eG agent, deployed either on the application host or on a remote Windows host in the environment (depending upon the monitoring approach – whether agent-based or agentless), can be configured to connect to the JRE used by the application and pull out metrics of interest, using either of the following methodologies:
JMX (Java Management Extensions)
SNMP (Simple Network Management Protocol)
The eG agent uses the specifications prescribed by JSR 174 to perform JVM monitoring.
This is why, each test mapped to the top 2 layers of Figure 1 provides administrators with the option to pick a monitoring MODE - i.e., either JMX or SNMP. The remaining test configuration depends upon the mode chosen. Since both JMX and SNMP support are available for JRE 1.5 and above only, the Java Application model can be used to monitor only those applications that are runningJRE 1.5 and above.
The sections to come discuss how to enable JMX and SNMP for JRE.
1.1.1
Enabling JMX Support for JRE
In older versions of Java (i.e., JDK/JRE 1.1, 1.2, and 1.3), very little instrumentation was built in, and custom-developed byte-code instrumentation had to be used to perform monitoring. From JRE/JDK 1.5 and above however, support for Java Management Extensions (JMX) were pre-built into JRE/JDK. JMX enables external programs like the eG agent to connect to the JRE of an application and pull out metrics in real-time.
This section discusses the procedure for enabling JMX support for the JRE of any generic Java application that may be monitored using eG Enterprise. To know how to enable JMX support for the JRE of key application servers monitored out-of-the-box by eG Eterprise, refer to the relevant chapters of the Configuring and Monitoring Application Servers document.
By default, JMX requires no authentication or security (SSL). In this case therefore, to use JMX for pulling out metrics from a target application, the following will have to be done:
1. Login to the application host.
2. The <JAVA_HOME>\jre\lib\management folder used by the target application will typically contain the following files:
o management.properties o jmxremote.access
o jmxremote.password.template o snmp.acl.template
3. Edit the managerment.properties file, and append the following lines to it: com.sun.management.jmxremote.port=<Port No>
com.sun.management.jmxremote.ssl=false
com.sun.management.jmxremote.authenticate=false
For instance, if the JMX listens on port 9005, then the first line of the above specification would be: com.sun.management.jmxremote.port=9005
4. Then, save the file.
5. Next, edit the start-up script of the target application, and add the following line to it: -Dcom.sun.management.config.file=<management.properties_file_path> -Djava.rmi.server.hostname=<IP Address>
6. For instance, on a Windows host, the <management.properties_file_path> can be expressed as:
D:\bea\jrockit_150_11\jre\lib\management\management.properties
7. On other hand, on a Unix/Linux/Solaris host, a sample <management.properties_file_path> specification will be as follows: /usr/jdk1.5.0_05/jre/lib/management/management.properties
8. In the second line, set the <IP Address> to the IP address using which the Java application has been managed in the eG Enterprise system. Alternatively, you can add the following line to the startup script: -Djava.rmi.server.hostname=localhost
9. Save this script file too.
10. Next, during test configuration, do the following: Set JMX as the mode;
Set the port that you defined in step 3 above (in the management.properties file) as the jmx remote port;
Update the test configuration.
On the other hand, if JMX requires only authentication (and no security), then the following steps will apply:
1. Login to the application host. If the application is executing on a Windows host, then, login to the host as a local/domain administrator.
2. As stated earlier, the <JAVA_HOME>\jre\lib\management folder used by the target application will typically contain the following files:
o management.properties o jmxremote.access
o jmxremote.password.template o snmp.acl.template
3. First, copy the jmxremote.password.template file to any other location on the host, rename it as as jmxremote.password, and then, copy it back to the <JAVA_HOME>\jre\lib\management folder.
4. Next, edit the jmxremote.password file and the jmxremote.access file to create a user with read-write access to the JMX. To know how to create such a user, refer to Section 1.1.1.2 of this document.
5. Then, proceed to make the jmxremote.password file secure by granting a single user “full access” to that file. For monitoring applications executing on Windows in particular, only the Owner of the jmxremote.password file should have full control of that file. To know how to grant this privilege to the Owner of the file, refer to Section 1.1.1.1.
6. In case of applications executing on Solaris / Linux hosts on the other hand, any user can be granted full access to the jmxremote.password file, by following the steps below:
Login to the host as the user who is to be granted full control of the jmxremote.password file. Issue the following command:
chmod 600 jmxremote.password
This will automatically grant the login user full access to the jmxremote.password file.
7. Next, edit the management.properties file, and append the following lines to it: com.sun.management.jmxremote.port=<Port No>
com.sun.management.jmxremote.ssl=false
com.sun.management.jmxremote.authenticate=true
com.sun.management.jmxremote.access.file=<Path of jmxremote.access> com.sun.management.jmxremote.password.file=<Path of jmxremote.password>
For instance, assume that the JMX remote port is 9005, and the jmxremote.access and jmxremote.password files exist in the following directory on a Windows host: D:\bea\jrockit_150_11\jre\lib\management. The specification above will then read as follows:
com.sun.management.jmxremote.port=9005
com.sun.management.jmxremote.access.file=D:\\bea\\jrockit_150_11\\jre\\lib\\managem ent\\jmxremote.access
com.sun.management.jmxremote.password.file=D:\\bea\\jrockit_150_11\\jre\\lib\\manag ement\\jmxremote.password
8. If the application in question is executing on a Unix/Solaris/Linux host, and the jmxremote.access and jmxremote.password files reside in the /usr/jdk1.5.0_05/jre/lib/management folder of the host, then the last 2 lines of the specification will be:
com.sun.management.jmxremote.access.file=/usr/jdk1.5.0_05/jre/lib/management/jmxre mote.access
com.sun.management.jmxremote.password.file=/usr/jdk1.5.0_05/jre/lib/management/jmx remote.password
9. Finally, save the file.
10. Then, edit the start-up script of the target web application server, include the following line in it, and save the file:
-Dcom.sun.management.config.file=<management.properties_file_path> -Djava.rmi.server.hostname=<IP Address>
11. For instance, on a Windows host, the <management.properties_file_path> can be expressed as:
D:\bea\jrockit_150_11\jre\lib\management\management.properties
12. On other hand, on a Linux/Solaris host, a sample <management.properties_file_path> specification will be as follows: /usr/jdk1.5.0_05/jre/lib/management/management.properties
13. In the second line, set the <IP Address> to the IP address using which the Java application has been managed in the eG Enterprise system. Alternatively, you can add the following line to the startup script of the target web application server: -Djava.rmi.server.hostname=localhost
14. Next, during test configuration, do the following:
Set JMX as the mode;
Ensure that the port number configured in the management.properties file at step 5 above is set as the jmx remote port;
Make sure that the user and password parameters of the test are that of a user with readwrite rights to JMX. To know how to create a new user and assign the required rights to him/her, refer to Section 1.1.1.2.
eG Enterprise cannot use JMX that requires both authentication and security (SSL), for monitoring the target Java application.
1.1.1.1
Securing the ‘jmxremote.password’ file
To enable the eG agent to use JMX (that requires authentication only) for monitoring a Windows-based Java application, you need to ensure that the jmxremote.password file in the <JAVA_HOME>\jre\lib\management folder used by the target application is accessible only by the Owner of that file. To achieve this, do the following:
1. Login to the Windows host as a local/domain administrator.
2. Browse to the location of the jmxremote.password file using Windows Explorer.
3. Next, right-click on the jmxremote.password file and select the Properties option (see Figure 2).
Figure 2: Selecting the Properties option 4. From Figure 3 that appears next, select the Security tab.
Figure 3: The Properties dialog box
However, if you are on Windows XP and the computer is not part of a domain, then the Security tab may be missing. To reveal the Security tab, do the following:
Open Windows Explorer, and choose Folder Options from the Tools menu.
Select the View tab, scroll to the bottom of the Advanced Settings section, and clear the check box next to Use Simple File Sharing.
Figure 4: Deselecting the ‘Use simple file sharing’ option Click OK to apply the change
When you restart Windows Explorer, the Security tab would be visible. 5. Next, select the Advanced button in the Security tab of Figure 5.
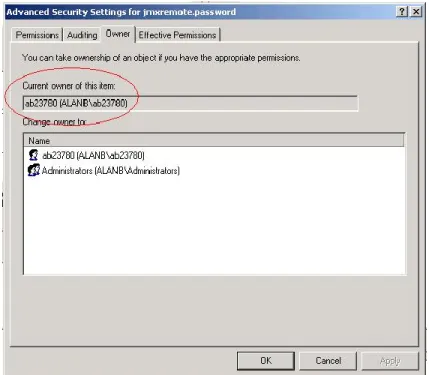
6. Select the Owner tab to see who the owner of the file is.
Figure 6: Verfying whether the Owner of the file is the same as the application Owner
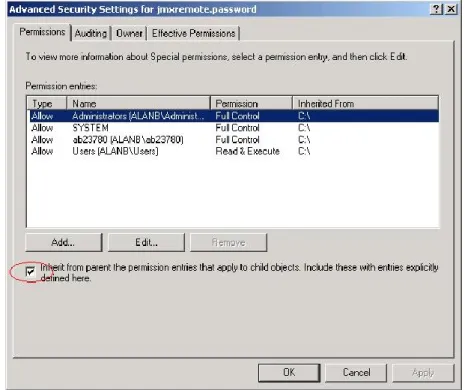
7. Then, proceed to select the Permissions tab in Figure 6 to set the permissions. If the jmxremote.password file has inherited its permissions from a parent directory that allows users or groups other than the Owner to access the file, then clear the Inherit from parent the permission entries that apply to child objects check box in Figure 7.
Figure 7: Disinheriting permissions borrowed from a parent directory
8. At this point, you will be prompted to confirm whether the inherited permissions should be copied from the parent or removed. Press the Copy button in Figure 8.
Figure 8: Copying the inherited permissions
9. Next, remove all permission entries that allow the jmxremote.password file to be accessed by users or groups other than the file Owner. For this, click the user or group and press the Remove button in Figure 9. At the end of this exercise, only a single permission entry granting Full Control to the owner should remain in Figure 9.
Figure 9: Granting full control to the file owner
10. Finally, click the Apply and OK buttons to register the changes. The password file is now secure, and can only be accessed by the file owner.
If you are trying to enable JMX on a Linux host, you might encounter issues with the way hostnames are resolved.
To solve it you might have to set the -Djava.rmi.server.hostname=<hostname or localhost or ip> property in the startup script of the target web application server.
If you are in local, simply try with -Djava.rmi.server.hostname=localhost or -Djava.rmi.server.hostname=127.0.0.1.
1.1.1.2
Configuring the eG Agent to Support JMX Authentication
If the eG agent needs to use JMX for monitoring a Java application, and this JMX requires authentication only (and not security), then every test to be executed by such an eG agent should be configured with the credentials of a valid user to JMX, with read-write rights. The steps for creating such a user are detailed below:
1. Login to the application host. If the application being monitored is on a Windows host, then login as a local/domain administrator to the host.
2. Go to the <JAVA_HOME>\jre\lib\management folder used by the target application to view the following files: o management.properties
o jmxremote.access
o jmxremote.password.template o snmp.acl.template
3. Copy the jmxremote.password.template file to a different location, rename it as jmxremote.password, and copy it back to the <JAVA_HOME>\jre\lib\management folder.
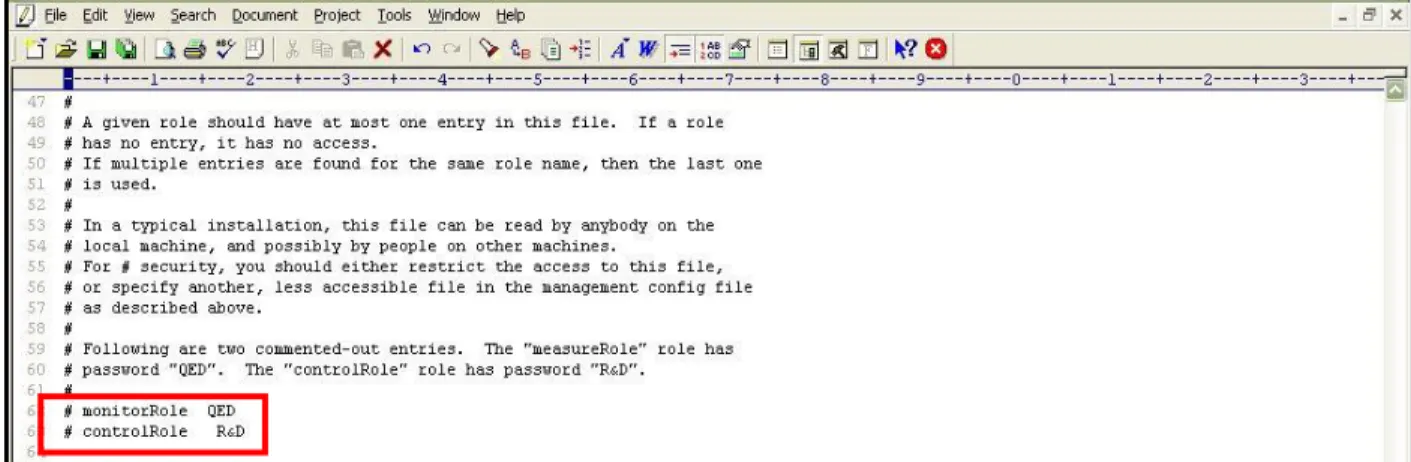
4. Open the jmxremote.password file and scroll down to the end of the file. By default, you will find the commented entries indicated by Figure 10 below:
Figure 10: Scrolling down the jmxremote.password file to view 2 commented entries
5. The two entries indicated by Figure 10 are sample username password pairs with access to JMX. For instance, in the first sample entry of Figure 10, monitorRole is the username and QED is the password corresponding to monitorRole. Likewise, in the second line, the controlRole user takes the password R&D.
6. If you want to use one of these pre-defined username password pairs during test configuration, then simply uncomment the corresponding entry by removing the # symbol preceding that entry. However, prior to that, you need to determine what privileges have been granted to both these users. For that, open the jmxremote.access file in the editor.
Figure 11: The jmxremote.access file
7. Scrolling down the file (as indicated by Figure 11) will reveal 2 lines, each corresponding to the sample username available in the jmxremote.password file. Each line denotes the access rights of the corresponding user. As is evident from Figure 11, the user monitorRole has only readonly rights, while user controlRole has readwrite rights. Since the eG agent requires readwrite rights to be able to pull out key JVM-related statistics using JMX, we will have to configure the test with the credentials of the user controlRole.
8. For that, first, edit the jmxremote.password file and uncomment the controlRole <password> line as depicted by Figure 12.
Figure 12: Uncommending the ‘controlRole’ line
9. Then, save the file. You can now proceed to configure the tests with the user name controlRoleand password R&D.
10. Alternatively, instead of going with these default credentials, you can create a new username password pair in the jmxremote.password file, assign readwrite rights to this user in the jmxremote.access file, and then configure the eG tests with the credentials of this new user. For instance, let us create a user john with password john and assign readwrite rights to john.
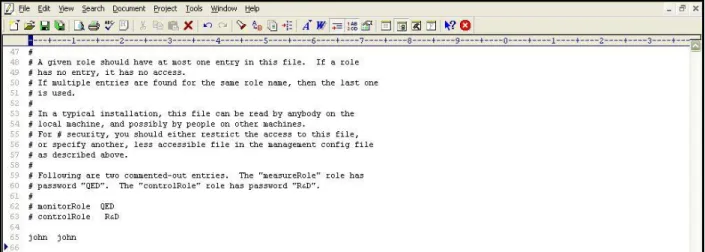
11. For this purpose, first, edit the jmxremote.password file, and append the following line (see Figure 13) to it: john john
Figure 13: Appending a new username password pair 12. Save the jmxremote.password file.
13. Then, edit the jmxremote.access file, and append the following line (see Figure 14) to it: john readwrite
Figure 14: Assigning rights to the new user in the jmxremote.access file 14. Then, save the jmxremote.access file.
15. Finally, proceed to configure the tests with the user name and password, john and john, respectively.
1.1.2
Enabling SNMP Support for JRE
Instead of JMX, you can configure the eG agent to monitor a Java application using SNMP-based access to the Java runtime MIB statistics.
In some environments, SNMP access might have to be authenticated by an ACL (Access Control List), and in some other cases, it might not require an ACL.
If SNMP access does not require ACL authentication, then follow the steps below to enable SNMP support: 1. Login to the application host.
2. Ensure that the SNMP service and the SNMP Trap Service are running on the host.
3. Next, edit the management.properties file in the <JAVA_HOME>\jre\lib\management folder used by the target application.
4. Append the following lines to the file:
com.sun.management.snmp.port=<Port No> com.sun.management.snmp.interface=0.0.0.0 com.sun.management.snmp.acl=false
For instance, if the SNMP port is 1166, then the first line of the above specification will be: com.sun.management.snmp.port=1166
If the second line of the specification is set to 0.0.0.0, then, it indicates that the JRE will accept SNMP requests from any host in the environment. To ensure that the JRE services only those SNMP requests that are received from the eG agent, set the second line of the specification to the IP address of the agent host. For instance, if the eG agent to monitor the Java application is executing on 192.168.10.152, then the second line of the specification will be:
com.sun.management.snmp.interface=192.168.10.152
5. Next, edit the start-up script of the target application, include the following line it, and save the script file. -Dcom.sun.management.config.file=<management.properties_file_path>
6. For instance, on a Windows host, the <management.properties_file_path> can be expressed as:
D:\bea\jrockit_150_11\jre\lib\management\management.properties.
7. On other hand, on a Unix/Linux/Solaris host, a sample <management.properties_file_path> specification will be as follows: /usr/jdk1.5.0_05/jre/lib/management/management.properties.
On the contrary, if SNMP access requires ACL authentication, then follow the steps below to enable SNMP support for the JRE:
1. Login to the application host. If the target application is executing on a Windows host, login as a local/domain administrator.
2. Ensure that the SNMP service and SNMP Trap Service are running on the host.
3. Copy the snmp.acl.template file in the <JAVA_HOME>\jre\lib\management folder to another location on the local host. Rename the snmap.acl.template file as snmp.acl, and copy the snmp.acl file back to the
<JAVA_HOME>\jre\lib\management folder.
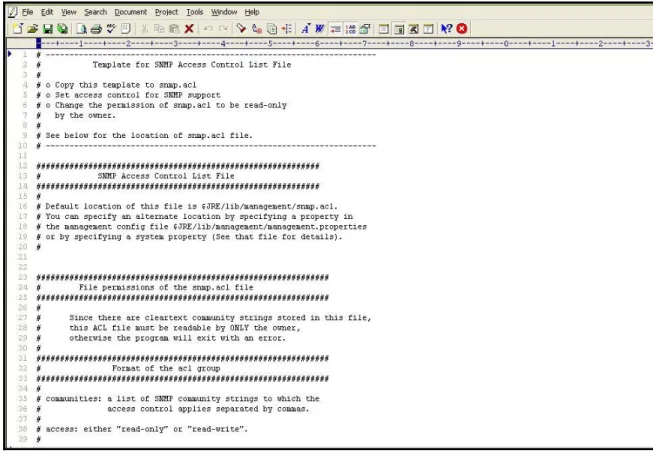
Figure 15: The snmp.acl file
5. For that, first scroll down the file to view the sample code block revealed by Figure 16.
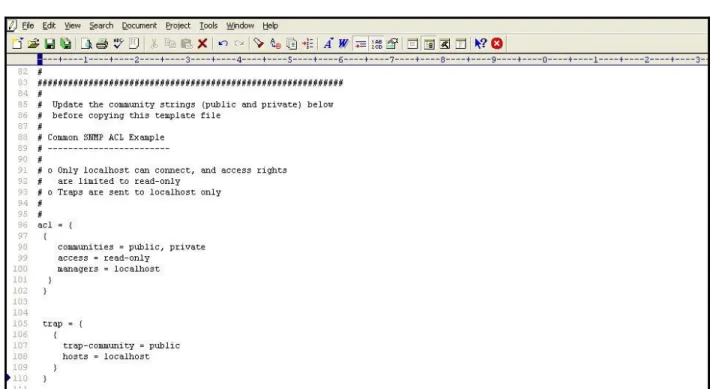
Figure 16: The snmp.acl file revealing the SNMP ACL example
17.
Figure 17: Uncommenting the code block 7. Next, edit the code block to suit your environment.
8. The acl block expects the following parameters:
communities : Provide a comma-separated list of community strings, which an SNMP request should carry for it to be serviced by this JRE; in the example illustrated by Figure 17, the community strings recognized by this JRE are public and private. You can add more to this list, or remove a community string from this list, if need be.
access : Indicate the access rights that SNMP requests containing the defined communities will have; in Figure 17, SNMP requests containing the community string public or private, will have only read-only access to the MIB statistics. To grant full access, you can specify rea-write instead.
managers : Specify a comma-separated list of SNMP managers or hosts from which SNMP requests will be accepted by this JRE; in the example illustrated by Figure 17, all SNMP requests from the localhost will be serviced by this JRE. Typically, since the SNMP requests originate from an eG agent, the IP of the eG agent should be configured against the managers parameter. For instance, if the IP address of the agent host is 192.16.10.160, then, to ensure that the JRE accepts requests from the eG agent alone, set managers to 192.168.10.160, instead of localhost.
9. Every acl block in the snmp.acl file should have a corresponding trap block. This trap block should be configured with the following values:
trap-community: Provide a comma-separated list of community strings that can be used by SNMP traps sent by the Java application to the managers specified in the acl block. In the example of Figure 17, all SNMP traps sent by the Java application being monitored should use the community string public only.
hosts: Specify a comma-separated list of IP addresses / host names of hosts from which SNMP traps can be sent. In the case of Figure 17, traps can be sent by the localhost only. If a single snmp.acl file is being centrally used by multiple applications/devices executing on multiple hosts, then to ensure that all such applications are able to send traps to the configured SNMP managers (in the acl block), you can provide the IP address/hostname of these applications as a comma-separated list against hosts.
10. Figure 18 depicts how the acl and trap blocks can be slightly changed to suit the monitoring needs of an application.
Figure 18: The edited block
11. Then, proceed to make the snmp.acl file secure by granting a single user “full access” to that file. For monitoring applications executing on Windows in particular, only the Owner of the snmp,.acl file should have full control of that file. To know how to grant this privilege to the Owner of a file, refer to Section 1.1.1.1. This section actually details the procedure for making the jmxremote.password file on Windows, secure. Use the same procedure for making the snmp.acl file on Windows secure, but make sure that you select the snmp.acl file and not the jmxremote.password file.
12. In case of applications executing on Solaris / Linux hosts on the other hand, any user can be granted full access to the snmp.acl file, by following the steps below:
Login to the host as the user who is to be granted full control of the snmp.acl file. Issue the following command:
chmod 600 snmp.acl
This will automatically grant the login user full access to the jmxremote.password file.
13. Next, edit the management.properties file in the <JAVA_HOME>\jre\lib\management folder used by the target application.
14. Append the following lines to the file:
com.sun.management.snmp.port=<PortNo> com.sun.management.snmp.interface=0.0.0.0 com.sun.management.snmp.acl=true
com.sun.management.snmp.acl.file=<Path_of_snmp.acl>
If the second line of the specification is set to 0.0.0.0, then, it indicates that the JRE will accept SNMP requests from any host in the environment. To ensure that the JRE services only those SNMP requests that are received from the eG agent, set the second line of the specification to the IP address of the agent host.
For example, if the Java application being monitored listens for SNMP requests at port number 1166, the eG agent monitoring the Java application is deployed on 192.168.10.152, and these SNMP requests need to be authenticated using the snmp.acl file in the D:\bea\jrockit_150_11\jre\lib directory, then the above specification will read as follows:
com.sun.management.snmp.port=1166
com.sun.management.snmp.interface=192.168.10.152 com.sun.management.snmp.acl=true
com.sun.management.snmp.acl.file=D:\\bea\\jrockit_150_11\\jre\\lib\\management\\sn mp.acl
15. However, if the application in question is executing on a Unix/Solaris/Linux host, and the snmp.acl file is in the
/usr/jdk1.5.0_05/jre/lib/management folder of the host, then the last line of the specification will be: com.sun.management.snmp.acl.file =/usr/jdk1.5.0_05/jre/lib/management/snmp.acl
16. Next, edit the start-up script of the target application, include the following line in it, and save the script file. -Dcom.sun.management.config.file=<management.properties_file_path>
17. For instance, on a Windows host, the <management.properties_file_path> can be expressed as:
D:\bea\jrockit_150_11\jre\lib\management\management.properties.
18. On other hand, on a Unix/Linux/Solaris host, a sample <management.properties_file_path> specification will be as follows: /usr/jdk1.5.0_05/jre/lib/management/management.properties.
The sections to come discuss the top 2 layers of Figure 1, as the remaining layers have already been discussed at length in the Monitoring Unix and Windows Servers document.
1.2
The Java Transactions Layer
By default, this layer will not be available for any monitored Java Application. This is because, the Java Transactions
test mapped to this layer is disabled by default. To enable the test, follow the Agents -> Tests -> Enable/Disable menu sequence, select Java Application as the Component type, Performance as the Test type, and then select Java Transactions from the DISABLED TESTS list. Click the Enable button to enable the selected test, and click the Update
button to save the changes.
The Java Transactions test, once enabled, will allow you to monitor configured patterns of transactions to the target Java application, and report their response times, so that slow transactions and transaction exceptions are isolated and the reasons for the same analyzed. For the Java Transactions test to execute, you need to enable the Java Transaction Monitoring (JTM) capability of the eG agent. The procedure for the same has been discussed in Section 1.2.1.1 of this document.
Java Transaction Monitoring (JTM) can be enabled only for those Java applications that use JDK 1.5 or higher.
Figure 19: The test mapped to the Java Transactions layer
1.2.1
Java Transactions Test
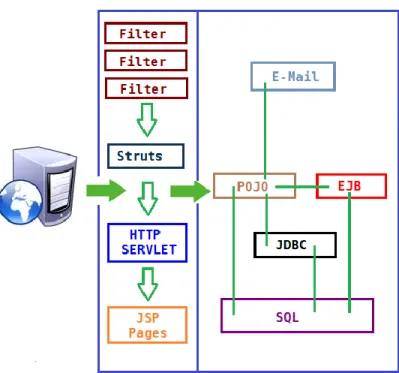
When a user initiates a transaction to a J2EE application, the transaction typically travels via many sub-components before completing execution and sending out a response to the user.
Figure 20: The layers through which a Java transaction passes The key sub-components depicted by Figure 20 have been briefly described below:
Filter: A filter is a program that runs on the server before the servlet or JSP page with which it is associated. All filters must implement javax.servlet.Filter. This interface comprises three methods: init, doFilter, and destroy.
Servlet: A servlet acts as an intermediary between the client and the server. As servlet modules run on the server, they can receive and respond to requests made by the client. If a servlet is designed to handle HTTP requests, it is called an HTTP Servlet.
JSP: Java Server Pages are an extension to the Java servlet technology. A JSP is translated into Java servlet before being run, and it processes HTTP requests and generates responses like any servlet. Translation occurs the first time the application is run.
Struts: The Struts Framework is a standard for developing well-architected Web applications. Based on the Model-View-Controller (MVC) design paradigm, it distinctly separates all three levels (Model, View, and Control).
A delay experienced by any of the aforesaid sub-components can adversely impact the total response time of the transaction, thereby scarring the user experience with the web application. In addition, delays in JDBC connectivity and slowdowns in SQL query executions (if the application interacts with a database), bottlenecks in delivery of mails via the Java Mail API (if used), and any slow method calls, can also cause insufferable damage to the 'user-perceived' health of a web application.
The challenge here for administrators is to not just isolate the slow transactions, but to also accurately identify where the transaction slowed down and why - is it owing to inefficent JSPs? poorly written servlets or struts? poor or the lack of any JDBC connectivity to the database? long running queries? inefficient API calls? or delays in accessing the POJO methods? The eG JTM Monitor provides administrators with answers to these questions!
With the help of the Java Transactions test, the eG JTM Monitor traces the route a configured web transaction takes, and captures live the total responsiveness of the transaction and the response time of each Java component it visits en route. This way, the solution proactively detects transaction slowdowns, and also precisely points you to the
sub-components causing it - is it the Filters? JSPs? Servlets? Struts? JDBC? SQL query? Java Mail API? or the POJO? In addition to revealing where (i.e., at which Java component) a transaction slowed down, the solution also provides the following intelligent insights, on demand, making root-cause identification and resolution easier:
A look at the methods that took too long to execute, thus leading you to those methods that may have contributed to the slowdown;
Single-click access to each invocation of a chosen method, which provides pointers to when and where a method spent longer than desired;
A quick glance at SQL queries and Java errors that may have impacted the responsiveness of the transaction;
Using these interesting pointers provided by the eG JTM Monitor, administrators can diagnose the root-cause of transaction slowdowns within minutes, rapidly plug the holes, and thus ensure that their critical web applications perform at peak capacity at all times!
1.2.1.1
How does eG Perform Java Transaction Monitoring?
Figure 21 depicts how eG monitors Java transactions.To track the live transactions to a J2EE application, eG Enterprise requires that a special eG Application Server Agent
be deployed on the target application. The eG Application Server Agent is available as a file named eg_jtm.jar on the eG agent host, which has to be copied to the system hosting the application being monitored. The detailed steps for deployment have been discussed hereunder:
In the <EG_INTALL_DIR>\lib directory (on Windows; on Unix, this will be /opt/egurkha/lib) of the eG agent, you will find the following files:
eg_jtm.jar aspectjrt.jar aspectjweaver.jar jtmConn.props jtmLogging.props jtmOther.props
Login to the system hosting the Java application to be monitored.
If the eG agent will be 'remotely monitoring' the target Java application (i.e., if the Java application is to be monitored in an 'agentless manner'), then, copy all the files mentioned above from the <EG_INSTALL_DIR>\lib directory (on Windows; on Unix, this will be /opt/egurkha/lib) of the eG agent to any location on the Java application host. Then, proceed to edit the start-up script of the Java application being monitored, and append the following lines to it:
set JTM_HOME=<<PATH OF THE LOCAL FOLDER CONTAINING THE JAR FILES AND PROPERTY FILES LISTED ABOVE>>
"-javaagent:%JTM_HOME%\aspectjweaver.jar"
"-DEG_JTM_HOME=%JTM_HOME%"
Note that the above lines will change based on the operating system and the web/web application server being monitored.
Then, add the eg_jtm.jar, aspectjrt.jar, and aspectjweaver.jar files to the CLASSPATH of the Java application being monitored.
Finally, save the file.
Next, edit the jtmConn.props file. You will find the following lines in the file:
#Contains the connection properties of eGurkha Java Transaction Monitor JTM_Port=13631
Designated_Agent=
By default, the JTM_Port parameter is set to 13631. If the Java application being monitored listens on a different JTM port, then specify the same here. In this case, when managing a Java Application using the eG administrative interface, specify the JTM_Port that you set in the jtmConn.props file as the Port of the Java application.
Also, against the Designated_Agent parameter, specify the IP address of the eG agent which will poll the eG JTM Monitor for metrics. If no IP address is provided here, then the eG JTM Monitor will treat the host from which the very first 'measure request' comes in as the Designated_Agent.
In case a specific Designated_Agent is not provided, and the eG JTM Monitor treats the host from which the very first 'measure request' comes in as the Designated_Agent, then if such a
Designated_Agent is stopped or uninstalled for any reason, the eG JTM Monitor will wait for a maximum of 10 measure periods for that 'deemed' Designated_Agent to request for metrics. If no requests come in for 10 consecutive measure periods, then the eG JTM Monitor will begin responding to 'measure requests' coming in from any other eG agent.
Finally, save the jtmConn.props file. Restart the Java application.
Each request in the J2EE architecture is handled by a thread.Once the Java application is restarted therefore, the eG Application Sever Agent uses the thread ID and thread local data to keep track of requests to configured URL patterns (see Figure 22).
Figure 22: The eG Application Server Agent tracking requests using Java threads
In the process, the eG Application Sever Agent collects metrics for each URL pattern and stores them in memory. Then, every time the Java Transactions test runs, the eG agent will poll the eG Application Server Agent for the required metrics, extract the same from the memory, and report them to the eG manager.
The table below explains how to configure the Java Transactions test and what measures it reports.
Purpose Traces the route a configured web transaction takes, and captures live the total responsiveness of the transaction and the response time of each component it visits en route. This way, the solution proactively detects transaction slowdowns, and also precisely points you to the Java component causing it - is it the Filters? JSPs? Servlets? Struts? JDBC? SQL query? Java Mail API? or the POJO? Target of the test A Java application Agent deploying the test An internal/remote agent
Configurable parameters for the test
1. TEST PERIOD - How often should the test be executed
2. HOST - The host for which the test is to be configured
3. PORT - The port number at which the specified HOST listens; if Java Transaction
Monitoring is enabled for the target Java application, then the JTM PORT has to be
specified here
4. JTM PORT – Specify the port number configured as the JTM_Port in the jtmConn.props
file described in the procedure outlined above.
5. URL PATTERNS - Provide a comma-separated list of the URL patterns of web
requests/transactions to be monitored. The format of your specification should be as follows: <DisplayName_of_Pattern>:<Transaction_Pattern>. For instance, your specification can be: login:*log*,ALL:*,pay:*pay*
6. FILTERED URL PATTERNS - Provide a comma-separated list of the URL patterns of
transactions/web requests to be excluded from the monitoring scope of this test. For example, *blog*,*paycheque*
7. SLOW URL THRESHOLD - The Slow transactions measure of this test will report the
number of transactions (of the configured patterns) for which the response time is higher than the value (in seconds) specified here.
8. METHOD EXEC CUTOFF - The detailed diagnosis of the Slow transactions measure
allows you to drill down to a URL tree, where the methods invoked by a chosen transaction are listed in the descending order of their execution time. By configuring an execution duration (in seconds) here, you can have the URL Tree list only those methods that have been executing for a duration greater the specified value. For instance, if you specify 5 here, the URL tree for a transaction will list only those methods that have been executing for over 5 seconds, thus shedding light on the slow method calls alone.
9. MAX SLOW URLS PER TEST PERIOD - Specify the number of top-n transactions (of a
configured pattern) that should be listed in the detailed diagnosis of the Slow transactions measure, every time the test runs. By default, this is set to 10, indicating that the detailed diagnosis of the Slow transactions measure will by default list the top-10 transactions, arranged in the descending order of their response times.
10. MAX ERROR URLS PER TEST PERIOD - Specify the number of top-n transactions (of a
configured pattern) that should be listed in the detailed diagnosis of the Error transactions measure, every time the test runs. By default, this is set to 10, indicating that the detailed diagnosis of the Error transactions measure will by default list the top-10 transactions, in terms of the number of errors they encountered.
11. DD FREQUENCY - Refers to the frequency with which detailed diagnosis measures are to
be generated for this test. The default is 1:1. This indicates that, by default, detailed measures will be generated every time this test runs, and also every time the test detects a problem. You can modify this frequency, if you so desire. Also, if you intend to disable the detailed diagnosis capability for this test, you can do so by specifying none against DD
FREQUENCY.
12. DETAILED DIAGNOSIS - To make diagnosis more efficient and accurate, the eG
Enterprise suite embeds an optional detailed diagnostic capability. With this capability, the eG agents can be configured to run detailed, more elaborate tests as and when specific problems are detected. To enable the detailed diagnosis capability of this test for a particular server, choose the On option. To disable the capability, click on the Off option. The option to selectively enable/disable the detailed diagnosis capability will be available only if the following conditions are fulfilled:
The eG manager license should allow the detailed diagnosis capability
Both the normal and abnormalfrequencies configured for the detailed diagnosis measures should not be 0.
Outputs of the test
One set of results for each configured URL pattern
Measurements made by the test
Measurement Measurement Unit Interpretation
Total transactions:
Indicates the total number of transactions of this pattern that the target application handled during the last measurement period.
Number
Avg. response time:
Indicates the average time taken by the transactions of this pattern to complete execution.
Secs Compare the value of this measure across patterns to isolate the type of transactions that were taking too long to execute.
You can then take a look at the values of the other measures to figure out where the transaction is spending too much time.
Slow transactions:
Indicates the number of transactions of this pattern that were slow during the last measurement period.
Number This measure will report the number of transactions with a response time higher than the configured SLOW
URL THRESHOLD.
A high value is a cause for concern, as too many slow transactions to an application can significantly damage the user experience with that application.
Use the detailed diagnosis of this measure to know which transactions are slow.
Slow transactions response time: Indicates the average time taken by the slow transactions of this pattern to execute.
Secs
Error transactions:
Indicates the number of transactions of this pattern that experienced errors during the last measurement period.
Number A high value is a cause for concern, as too many error-prone transactions to an application can significantly damage the user experience with that application.
Use the detailed diagnosis of this measure to isolate the error transactions.
Error transactions response time: Indicates the average duration for which the transactions of this pattern were processed before an error condition was detected.
Secs
Filters:
Indicates the number of filters that were accessed by the transactions of this pattern during the last
measurement period.
Number A filter is a program that runs on the server before the servlet or JSP page with which it is associated.
Filters response time:
Indicates the average time spent by the transactions of this pattern at the
Filters layer.
Secs Typically, the init, doFilter, and destroy methods are called at the
Filters layer. Issues in these method invocations can increase the time spent by a transaction in the Filters
Java component.
Compare the value of this measure across patterns to identify the transaction pattern that spent the maximum time with the Filters
component.
If one/more transactions of a pattern are found to be slow, then, you can compare the value of this measure with the other response time values reported by this test to determine where the slowdown actually occurred - in the filters, in JSPs, in servlets, in struts, in exception handling, when executing JDBC/SQL queries, when sending Java mails, or when accessing POJOs.
JSPs accessed:
Indicates the number of JSPs accessed by the transactions of this pattern during the last measurement period.
JSPs response time:
Indicates the average time spent by the transactions of this pattern at the
JSP layer.
Secs Compare the value of this measure across patterns to identify the transaction pattern that spent the maximum time in JSPs.
If one/more transactions of a pattern are found to be slow, then, you can compare the value of this measure with the other response time values reported by this test to determine where the slowdown actually occurred - in the filters, in JSPs, in servlets, in struts, in exception handling, when executing JDBC/SQL queries, when sending Java mails, or when accessing POJOs..
HTTP Servlets Accessed: Indicates the number of HTTP servlets that were accessed by the transactions of this pattern during the last measurement period.
Number
HTTP servlets response time: Indicates the average time taken by the HTTP servlets for processing the HTTP requests of this pattern.
Secs Badly written servlets can take too long to execute, and can hence obstruct the smooth execution of the dependent transactions.
By comparing the value of this measure across patterns, you can figure out which transaction pattern is spending the maximum time in
Servlets.
If one/more transactions of a pattern are found to be slow, then, you can compare the value of this measure with the other response time values reported by this test to determine where the slowdown actually occurred - in the filters, in JSPs, in servlets, in struts, in exception handling, when executing JDBC/SQL queries, when sending Java mails, or when accessing POJOs.
Generic servlets accessed: Indicates the number of generic (non-HTTP) servlets that were accessed by the transactions of this pattern during the last measurement period.
Generic servlets response time: Indicates the average time taken by the generic (non-HTTP) servlets for processing transactions of this pattern.
Secs Badly written servlets can take too long to execute, and can hence obstruct the smooth execution of the dependent transactions.
By comparing the value of this measure across patterns, you can figure out which transaction pattern is spending the maximum time in
Servlets.
If one/more transactions of a pattern are found to be slow, then, you can compare the value of this measure with the other response time values reported by this test to determine where the slowdown actually occurred - in the filters, in JSPs, in servlets, in struts, in exception handling, when executing JDBC/SQL queries, when sending Java mails, or when accessing POJOs.
JDBC queries:
Indicates the number of JDBC statements that were executed by the transactions of this pattern during the last measurement period.
Number The methods captured by the eG JTM Monitor from the Java class for the JDBC sub-component include: Commit(), rollback(..), close(),GetResultSet(), executeBatch(), cancel(), connect(String, Properties), getConnection(..),getPool edConnection(..) JDBC response time:
Indicates the average time taken by the transactions of this pattern to execute JDBC statements.
Secs By comparing the value of this measure across patterns, you can figure out which transaction pattern is taking the most time to execute JDBC queries.
If one/more transactions of a pattern are found to be slow, then, you can compare the value of this measure with the other response time values reported by this test to determine where the slowdown actually occurred - in the filters, in JSPs, in servlets, in struts, in exception handling, when executing JDBC/SQL queries, when sending Java mails, or when accessing POJOs.
SQL statements executed: Indicates the number of SQL queries executed by the transactions of this pattern during the last measurement period.
SQL statement time avg.: Indicates the average time taken by the transactions of this pattern to execute SQL queries.
Secs Inefficient queries can take too long to execute on the database, thereby significantly delaying the responsiveness of the dependent transactions. To know which transactions have been most impacted by such queries, compare the value of this measure across the transaction patterns.
If one/more transactions of a pattern are found to be slow, then, you can compare the value of this measure with the other response time values reported by this test to determine where the slowdown actually occurred - at the filters layer, JSPs layer, servlets layer, struts layer, in exception handling, when executing JDBC/SQL queries, when sending Java mails, or when accessing POJOs. Exceptions seen:
Indicates the number of exceptions encountered by the transactions of this pattern during the last measurement period.
Number Ideally, the value of this measure should be 0.
Exceptions response time: Indicates the average time which the transactions of this pattern spent in handling exceptions.
Secs If one/more transactions of a pattern are found to be slow, then, you can compare the value of this measure with the other response time values reported by this test to determine where the slowdown actually occurred - at the filters layer, JSPs layer, servlets layer, struts layer, in exception handling, when executing JDBC/SQL queries, when sending Java mails, or when accessing POJOs. Struts accessed:
Indicates the number of struts accessed by the transactions of this pattern during the last meaurement period.
Number The Struts framework is a standard for developing well-architected Web applications.
Struts response time:
Indicates the average time spent by the transactions of this pattern at the
Struts layer.
Secs If you compare the value of this measure across patterns, you can figure out which transaction pattern spent the maximum time in Struts. If one/more transactions of a pattern are found to be slow, then, you can compare the value of this measure with the other response time values reported by this test to determine where the slowdown actually occurred - in the filters, in JSPs, in servlets, in struts, in exception handling, when executing JDBC/SQL queries, when sending Java mails, or when accessing POJOs.
Java mails:
Indicates the number of mails sent by the transactions of this pattern during the last measurement period, using the Java mail API.
Number The eG JTM Monitor captures any mail that has been sent from the monitored application using Java Mail API. Mails sent using other APIs are ignored by the eG JTM Monitor.
Java mail API time:
Indicates the average time taken by the transactions of this pattern to send mails using the Java mail API.
Secs If one/more transactions of a pattern are found to be slow, then, you can compare the value of this measure with the other response time values reported by this test to determine where the slowdown actually occurred - in the filters, in JSPs, in servlets, in struts, in exception handling, when executing JDBC/SQL queries, when sending Java mails, or when accessing POJOs.
POJOs:
Indicates the number of transactions of this pattern that accessed POJOs during the last measurement period.
Number Plain Old Java Object (POJO) refers to a 'generic' method in JAVA Language. All methods that are not covered by any of the Java components (eg., JSPs, Struts, Servlets, Filters, Exceptions, Queries, etc.) discussed above will be automatically included under POJO.
When reporting the number of POJO methods, the eG agent will consider only those methods with a response time value that is higher than the threshold limit configured against the
POJO avg. access time:
Indicates the average time taken by the transactions of this pattern to access POJOs.
Secs If one/more transactions of a pattern are found to be slow, then, you can compare the value of this measure with the other response time values reported by this test to determine where the slowdown actually occurred - in the filters, in JSPs, in servlets, in struts, in exception handling, when executing JDBC/SQL queries, when sending Java mails, or when accessing POJOs.
The detailed diagnosis of the Slow transactions measure lists the top-10 (by default) transactions of a configured pattern that have violated the response time threshold set using the SLOW URL THRESHOLD parameter of this
test. Against each transaction, the date/time at which the transaction was initiated/requested will be displayed. Besides the request date/time, the remote host from which the transaction request was received and the total response time of the transaction will also be reported. This response time is the sum total of the response times of each of the top methods (in terms of time taken for execution) invoked by that transaction. To compute this sum total, the test considers only those methods with a response time value that is higher than the threshold limit configured against the METHOD EXEC CUTOFF parameter.
In the detailed diagnosis, the transactions will typically be arranged in the descending order of the total response time; this way, you would be able to easily spot the slowest transaction. To know what caused the transaction to be slow, you can take a look at the SUBCOMPONENT DETAILS column of the detailed diagnosis. Here, the time spent by the transaction in each of the Java components (FILTER, STRUTS, SERVLETS, JSPS, POJOS, SQL, JDBC, etc.)will be listed, thus leading you to the exact Java component where the slowdown occurred.
Figure 23: The detailed diagnosis of the Slow transactions measure
You can even perform detailed method-level analysis to isolate the methods taking too long to execute. For this, click on the URL Tree link. Figure 24 will then appear. In the left panel of Figure 24, you will find the list of transactions that match a configured pattern; these transactions will be sorted in the descending order of their Total Response Time (by default). This is indicated by the Total Response Time option chosen by default from the Sort by list in
Figure 24. If you select a transaction from the left panel, an At-A-Glance tab page will open by default in the right panel, providing quick, yet deep insights into the performance of the chosen transaction and the reasons for its slowness. This tab page begins by displaying the URL of the chosen transaction, the total Response time of the transaction, the time at which the transaction was last requested, and the Remote Host from which the request was received.
If the Response time appears to be very high, then you can take a look at the Method Level Breakup section to figure out which method called by which Java component (such as FILTER, STRUTS, SERVLETS, JSPS, POJOS, SQL, JDBC, etc.) could have caused the slowdown. This section provides a horizontal bar graph, which reveals the percentage of time for which the chosen transaction spent executing each of the top methods (in terms of execution time) invoked by it. The legend below clearly indicates the top methods and the layer/sub-component that invoked each method. Against every method, the number of times that method was invoked in the Measurement Time, the Duration (in Secs) for which the method executed, and the percentage of the total execution time of the transaction for which the method was in execution will be displayed, thus quickly pointing you to those methods that may have contributed to the slowdown. The methods displayed here and featured in the bar graph depend upon the METHOD EXEC CUTOFF
configuration of this test - in other words, only those methods with an execution duration that exceeds the threshold limit configured against METHOD EXEC CUTOFF will be displayed in the Method Level Breakup section.
Figure 24: The Method Level Breakup section in the At-A-Glance tab page
While the Method Level Breakup section provides method-level insights into responsiveness, for a sub-component or layer level breakup of responsiveness scroll down the At-A-Glance tab to view the Component Level Breakup section (see Figure 25). Using this horizontal bar graph, you can quickly tell where - i.e., in which Java component - the transaction spent the maximum time. A quick glance at the graph's legend will reveal the Java components the transaction visited, the number of methods invoked by Java component, the Duration (Secs) for which the transaction was processed by the Java component, and what Percentage of the total transaction response time was spent in the Java component.
Figure 25: The Component Level Breakup section in the At-A-Glance tab page
Besides Java methods, where the target Java application interacts with the database, long-running SQL queries can also contribute to the poor responsiveness of a transaction. You can use the At-A-Glance tab page to determine whether the transaction interacts with the database or not, and if so, how healthy that interaction is. For this, scroll down the At-A-Glance tab page.
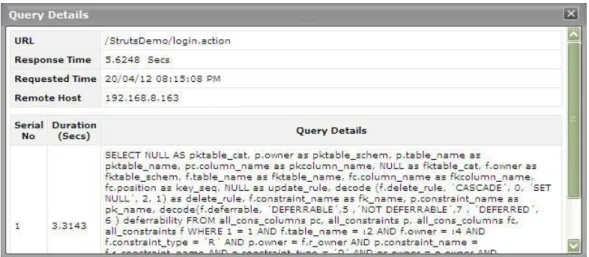
Figure 26: Query Details in the At-A-Glance tab page
Upon scrolling, you will find query details below the Component Level Breakup section. All the SQL queries that the chosen transaction executes on the backend database will be listed here in the descending order of their Duration. Corresponding to each query, you will be able to view the number of times that query was executed, the Duration for which it executed, and what percentage of the total transaction response time was spent in executing that query. A quick look at this tabulation would suffice to identify the query which executed for an abnormally long time on the
database, causing the transaction's responsiveness to suffer. For a detailed query description, click on the query. Figure 27 will then pop up displaying the complete query and its execution duration.
Figure 27: Detailed description of the query clicked on
This way, the At-A-Glance tab page allows you to analyze, at-a-glance, all the factors that can influence transaction response time - be it Java methods, Java components, and SQL queries - and enables you to quickly diagnose the source of a transaction slowdown. If, for instance, you figure out that a particular Java method is responsible for the slowdown, you can zoom into the performance of the 'suspect method' by clicking on that method in the Method Level Breakup section of the At-A-Glance tab page. This will automatically lead you to the Trace tab page, where all invocations of the chosen method will be highlighted (see Figure 28).
Figure 28: The Trace tab page displaying all invocations of the method chosen from the Method Level Breakup section
Typically, clicking on the Trace tab page will list all the methods invoked by the chosen transaction, starting with the very first method. Methods and sub-methods (a method invoked within a method) are arranged in a tree-structure, which can be expanded or collapsed at will. To view the sub-methods within a method, click on the arrow icon that