The Central Bank of the Russian Federation
Payment and Settlement
Systems
Analysis and Statistics
No. 20
Payment System of Russia
in 2008
P S S
P S S
© The Central Bank of the Russian Federation, 2008 107016 Moscow, Neglinnaya St. 12
Compiled by the Bank of Russia Settlements Regulation Department, using data provided by the Bank of Russia Payment System Regulation, Management and Monitoring Department, the Cash Circulation Department, the Bal-ance of Payments Department and the Banking Regulation and Supervision Department of the Central Bank of the
Russian Federation, as well as the central (national) banks of the CIS member countries and other organisations. E-mail: [email protected], tel. +7 495 771-45-64, fax +7 495 771-97-11
Contents
INTRODUCTION ... 7
Chapter 1. PAYMENT SERVICES PROVIDED BY THE BANKING SYSTEM OF RUSSIA ... 9
1.1. Cash ... 10
1.2. Banknotes and coin in circulation ... 11
Inset 1. Sociological survey as an instrument of cash circulation management ... 12
1.3. Cash turnover structure ... 13
1.4. Cashless payment instruments ... 15
1.4.1. Credit transfers ... 15
Inset 2. Cross-border money remittances of individuals ... 16
1.4.2. Direct debits ... 18
1.4.3. Bank cards ... 19
Inset 3. Development of bank card payments ... 20
1.4.4. Cheques ... 22
Inset 4. Electronic money development ... 22
1.5. General characteristics of cashless payments effected through the banking system of Russia ... 23
1.5.1. Funds turnover in the private payment systems ... 24
1.6. Methods of effecting payments in the private payment systems ... 24
1.6.1. Methods of forwarding payments to credit institutions ... 24
Inset 5. Development of Internet banking in Russia ... 25
1.6.2. Methods of effecting payments through the private payment systems ... 26
Inset 6. STP in payment process ... 27
1.7. Accessibility of payment services provided by the banking system ... 28
1.7.1. Banking system payment infrastructure ... 28
1.7.2. The development of devices used in effecting payments ... 29
Inset 7. Receipt of individual payments by payment agents and bank payment agents ... 31
ANALYSIS AND STATISTICS — 20. 2010 6
Chapter 2. PAYMENT SERVICES PROVIDED BY CREDIT INSTITUTIONS IN FEDERAL DISTRICTS ... 35
2.1. General characteristics of cashless payments effected through the private payment systems ... 36
2.1.1. Funds turnover in the private payment systems ... 37
2.2. Cash turnover structure ... 37
2.3. Cashless payment instruments ... 38
2.3.1. Credit transfers ... 38
2.3.2. Direct debits ... 40
2.3.3. Bank cards ... 40
2.3.4. Cheques ... 42
2.4. Accessibility of payment services provided by credit institutions ... 44
2.4.1. Banking sector payment infrastructure ... 44
2.4.2. Development of devices used in effecting payments... 47
Inset 8. Development of non-bank payment infrastructure ... 48
2.4.3. Concentration of banking sector payment services ... 50
Chapter 3. MAIN FEATURES OF RUSSIAN PAYMENT SYSTEMS IN 2008 ... 51
3.1. Payment system of the Bank of Russia ... 52
3.1.1. Participants in the payment system of the Bank of Russia ... 52
3.1.2. General characteristics of the payment system of the Bank of Russia ... 52
3.1.3. Technologies of effecting payments through the payment system of the Bank of Russia ... 53
3.1.4. Banking Electronic Speed Payment (BESP) system ... 54
3.2. Payment and settlement systems of stock exchange groups ... 54
3.2.1. MICEX Group ... 54
3.2.2. RTS Group ... 56
3.2.3. Characteristics of MICEX Group Foreign Currency Settlement System ... 57
3.2.4. Characteristics of MICEX Group Government Securities Settlement System ... 59
Addendum ... 61
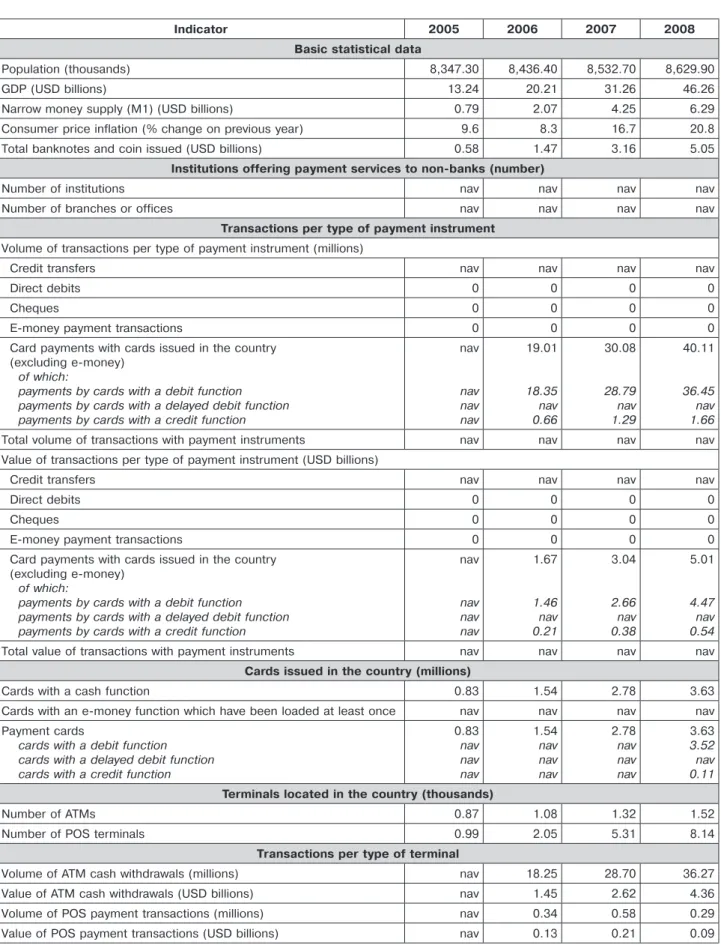
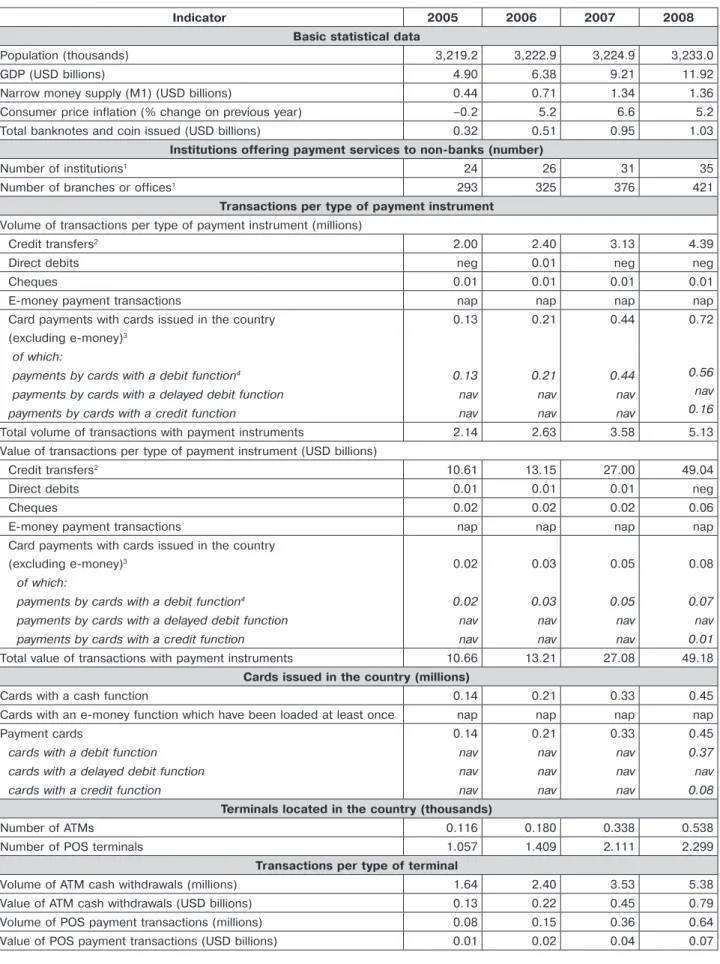
1. Payment system statistics for individual member states of CIS Payments and Securities Settlement Initiative (CISPI) ... 62
Introduction
By this survey the Bank of Russia continues the series of information and analytical publications on the development of the Russian payment system.
Under present-day conditions, which are characterised by the increasing impact of globalisation on the payment services market, the Bank of Russia gives significant consideration to information coverage of its efforts in reforming the national payment system. Data obtained as a result of statistical survey are used for economic analysis and development of a package of measures intended to maintain the smooth operation of the Russian payment system promoting overall economic stability. The amount of statistical and analytical information on payment system development provided to the public by the Bank of Russia is broadening.
The increased importance of the Russian payment system was reflected in international initiatives aimed at enhancing Russia’s involvement in activities of creating sound global payment architecture. In July 2009 the Bank of Russia became a member of the Bank for International Settlements Committee on Payment and Settlement Systems (CPSS), a major international body that develops standards for pay-ment and securities settlepay-ment systems. Participation in this organisation will widen the Bank of Russia’s opportunities to contribute to financial stability by improving the national and global payment and settle-ment infrastructure. It will also favour maintenance of a high level of oversight. A critical condition for this goal attainment is further development of the information analysis system, in particular perfection of the statistical study of the national payment system in compliance with international standards.
This analytical survey, which is aimed to inform the public about the major trends in the development of the Russian payment system in 2008, reviews this system from several angles. Chapter 1 describes the payment services provided by the Russian banking system in general. Chapter 2 analyses the payment services provided by credit institutions in the federal districts. Chapter 3 is focused on the principal char-acteristics of individual payment systems. The Addendum contains comparative tables of key indicators for the development of the payment systems of Russia and other member states of the CIS Payments and Securities Settlement Initiative (CISPI), and statistical tables illustrating the development of private payment systems by region.
This survey has been compiled by the Bank of Russia in cooperation with organisations ensuring functioning of the Russian payment systems; this has enabled the Bank of Russia to draw a more com-plete picture of their activity and illustrate the main trends in the development of the payment systems. The Bank of Russia expresses gratitude for the contribution to this project by CJSC “Moscow Interbank Currency Exchange”, OJSC “RTS Stock Exchange”, Russian Post and other organisations that provided information for this publication.
One of the special features of this survey is the statistical addendum containing data on the payment systems of CISPI member countries. The Bank of Russia would like to express its profound gratitude to the National Bank of the Republic of Belarus, the National Bank of the Republic of Kazakhstan, the National Bank of Ukraine, the Central Bank of the Republic of Azerbaijan and the Central Bank of the Republic of Armenia for their support of the project and for the information they provided, which allows to build a comprehensive view of the CISPI member countries’ payment systems.
Chapter 1. PAYMENT SERVICES PROVIDED
BY THE BANKING SYSTEM
ANALYSIS AND STATISTICS — 20. 2010 10
The Russian payment system continued to dem-onstrate favourable trends connected with improve-ments in the effectiveness of its performance in 2008. At the same time, however, the macroeco-nomic environment, affected by the global financial and economic crisis, led to the slowing of growth in the Russian payment services market by the end of year.
In 2008, Russia’s GDP gained only 5.6% (against 8.1% in 2007), consumer price inflation surpassed the previous year’s level and stood at 13.3%. By the end of 2008, the ruble had lost 12.7% of its value against the US dollar and 5.6% against the euro in nominal terms (December on December) owing to the con-traction of exports and capital outflow. The economic turbulence stifled growth in the payment services market, but the Russian payment system essentially remained stable.
1.1. Cash
The value of cash in circulation outside banks (M0) grew by only 2.5% in 2008 (as against an increase of 32.9% in 2007) and reached 3.8 trillion rubles as of end of 2008. The slowdown of growth in M0 was part of an overall trend towards the slowing of the moneti-sation process in the economy, which was the result of the global financial and economic crisis. Relative to GDP, money supply M2 increased by just 0.9 percent-age points on an averpercent-age annualised basis, to 32.8%, whereas in 2007 it had grown by 6 percentage points. Cash relative to GDP contracted to 8.9%. In per capita terms, average value of cash increased by 23.1% to the previous year and reached 26,100 rubles, or over $1,000.1
The period under review was characterised by the resumption of the dollarization of the economy, which had intensified by the end of the year be-cause of devaluation expectations. During 2008, the value of foreign currency in the non-banking sec-tor grew by $25 billion. The share of household in-come spent on foreign currency purchases increased from 5.2% in 2007 to 7.8% in 2008 and in Novem-ber it reached a high of 14.6%. The rise in house-hold demand for foreign currency had a major effect on the slowing of growth in cash in the economy, as most of this currency was purchased for cash rubles.
At the same time, transaction demand for cash, which remained the main payment instrument in re-tail payments, was as high as before. This use of cash may be largely attributed to the fact that it is a highly liquid financial asset and the use of cash does not involve any additional expenses for the population.
The share of cash in M1 expanded from 46.8% at the beginning of 2008 to 50.0% as of end of
1 At the average annual rate of exchange.
$IBSU4IBSFPGDBTIJODJSDVMBUJPO .JOOBSSPX NPOFZ .JOTFMFDUFEDPVOUSJFT #FMBSVT *OEJB ,B[BLITUBO 1PMBOE 3PNBOJB 4JOHBQPSF 64"
6LSBJOF $[FDI 3FQVCMJD +BQBO 3VTTJB
2008, which can be explained by a faster increase in the demand for cash comparing to the demand for other financial assets, especially in second half-year. The comparison of selected countries shows that although the role of cash had been declining in the past few years, its share in narrow money remained large.
1.2. Banknotes and coin
in circulation
The Bank of Russia banknotes and coin in circu-lation, including coins made of precious metals, to-talled 4,378.2 billion rubles2 as of end of 2008. Of these, banknotes had a total value of 4,354.4 billion rubles (6.4 billion sheets) and coins were valued at 23.7 billion rubles (40.1 billion pieces3). Banknotes accounted for 99.5% and coin for 0.5% of the total value of cash and for 13.8% and 86.2% of the total volume.
The total value of the Bank of Russia banknotes and coin, including coins made of precious metals, in-creased by 253.9 billion rubles, or 6.2%, during 2008. Of these, the value of banknotes grew by 250.7 bil-lion rubles (0.3 bilbil-lion sheets) and coins by 3.2 bilbil-lion rubles (4.8 billion pieces).
Growth in consumer prices for goods and ser-vices led to changes in the banknote structure of cash in circulation. The share of 5,000-ruble notes in the total value increased 1.6 times in 2008 and reached 33.7% as of end of 2008. Meanwhile, the share of 1,000-ruble notes contracted from 60.2% to 50.8%, 500-ruble notes – from 15.1% to 12.1%, and 100-ruble notes – from 2.7% to 2.5%. The share of 50-, 10- and 5-ruble notes remained virtually un-changed since 2007.
The share of 10-ruble coins in total the Bank of Russia coins in circulation increased by 0.3 percent-age points to 17.3% as of end of 2008. The share of 2-ruble coins grew from 14.6% to 15.1% and 50-ko-peck coins – from 7.8% to 7.9%. At the same time, the share of 5-ruble coins contracted from 33.0% to 32.3% and 1-ruble coins – from 19.4% to 19.3%. The aggregate share of small-denomination coins (1-kopeck and 5-kopecks) continued to shrink (from 1.5% to 1.4%).
2 Including cash kept in vaults at Bank of Russia branches and commercial banks.
3 Coins shown in pieces do not include coins made of pre-cious metals. $IBSU4IBSFPGDFSUBJODPJOTJOUIFUPUBMWBMVFPGDPJOT BTPGFOEPG LPQFDLDPJOTBDDPVOUFEGPSMFTTUIBOPGUIFUPUBMWBMVFPGDPJOT LPQFDLLPQFDL SVCMF SVCMF SVCMF SVCMF LPQFDL $IBSU4IBSFPGDFSUBJODPJOTJOUIFUPUBMOVNCFSPG DPJOTBTPGPGFOEPG LPQFDL LPQFDL LPQFDL SVCMFSVCMF SVCMF SVCMF LPQFDL $IBSU4IBSFPGDFSUBJOOPUFTJOUIFUPUBMWBMVF PGCBOLOPUFTBTPGFOEPG BOESVCMFOPUFTBDDPVOUFEGPSMFTTUIBOPGUIFUPUBMWBMVFPGCBOLOPUFT SVCMF SVCMF SVCMF SVCMF SVCMF $IBSU4IBSFPGDFSUBJOOPUFTJOUIFUPUBMOVNCFS PGCBOLOPUFTBTPGFOEPG SVCMF SVCMF SVCMF SVCMF SVCMF SVCMF SVCMFOPUFTBDDPVOUFEGPSMFTTUIBOPGUIFUPUBMOVNCFSPGCBOLOPUFT
ANALYSIS AND STATISTICS — 20. 2010 12
Inset 1
Sociological survey as an instrument of cash circulation management
4Lately many issuing banks have been using the results of sociological surveys and statistical observations when managing cash circulation (the most active research in this field has been conducted by De Neder-landsche Bank). Special emphasis in this work is made on determining the convenience of using banknotes and coins in cash settlements, their aesthetic attractiveness, and public knowledge of their security features. The results of statistical observations are of interest for the issuing banks because they create a kind of feedback from cash users to the issuing centre, helping the latter to take sound and sensible administrative decisions when organising cash turnover.
In 2008, the Bank of Russia used, for the first time, a sociological study to find out the demand for cash in the nation’s cash turnover. The study was conducted by Levada-Centre, an independent analytical agency. The task set for the researchers was to gather credible and objective information on the following issues:
- the need to change the denominations of banknotes and coins; - the need to improve coin parameters;
- the demand for notes and coins of various denominations.
The results of the study have shown that the most necessary denominations for everyday use are the 100-ruble note (81% of the sample), 50-ruble note (69%), 10-ruble note (58%) and 500-ruble note (53%).
The most frequently used coins are the 10-ruble, 5-ruble, 2-ruble and 1-ruble coins. The respective rates of use of these coins are 97.0%, 98.7%, 98.4% and 98%.
68% of respondents found it convenient to use coins with denominations of 2 rubles and more in settle-ments because of their size and weight. At the same time, 31% of respondents believed these coins were too large and heavy.
According to the survey, 1- and 5-kopeck coins are used rarely (13.5% and 27.9% of respondents, re-spectively). Commercial enterprises prefer to ignore these coin denominations when setting prices of goods and services, which can be confirmed by the absence of change when purchases are made. Only 7.3% of respondents said they received change in 1-kopeck coins and 12.8% – in 5-kopeck coins. Most of the respondents said they tried to get rid of 1-kopeck coins (82%) and 5-kopeck coins (76%).
Over 60% of respondents said that change smaller than 1 ruble was necessary in payment turnover. Most of the respondents (84%) noted that the current denomination range was practically optimal for everyday purchases. An absolute majority of respondents believe that small-denomination coins are exces-sive, given the current level of prices for goods and services. In particular, 91% of respondents said they would like to see the 1-kopeck coin withdrawn from circulation, 83% wanted the 5-kopeck coin to be with-drawn and 50% said they wanted the 10-kopeck coin out. This view was expressed by inhabitants of large and small cities as well as of rural areas, and by representatives of all social groups with different income, occupation, consumer status, sex and age.
4 Based on the article of A.V. Yurov ‘Sociological survey as an instrument of cash circulation management’ (Denghi i Kredit (Money and Credit), No. 10, 2008).
$IBSU6TFPGCBOLOPUFTJOIPVTFIPMEFWFSZEBZ TQFOEJOH SVCMF SVCMF SVCMF SVCMF SVCMF SVCMF $IBSU6TFPGDPJOTJOIPVTFIPMEFWFSZEBZ TQFOEJOH LPQFDL LPQFDL LPQFDL LPQFDL SVCMF SVCMF SVCMF SVCMF
1.3. Cash turnover structure
The value of cash that passed through the cash departments of credit institutions and Bank of Russia branches (hereinafter referred to as banks) in 2008 increased by 20.7% year on year and reached 41.6 trillion rubles. The expansion of cash turnover resulted from growth in revenues in the economy (Russia’s GDP increased by 25.8% year on year in nominal terms), the 19.9% rise in household money income and a 13.3% increase in the prices of goods and services. The ratio of cash passing through banks’ cash de-partments to GDP declined by 4.3 percentage points year on year, to 99.7%. Average daily cash turnover grew by 23.2 billion rubles to 137.6 billion rubles in the period under review.
The share of retail cash payments in total cash passed through banks’ cash departments in 2008 (24.1 trillion rubles), expanded by 1.5% year on year and reached 53.2%. Payments for consumer goods in total retail cash payments accounted for 33.9%, exceeding payments for services (9.3%), foreign ex-change purchases (8.3%) and real estate purchases (1.7%). In addition to retail cash payments, cash pay-ments to household deposits accounted for a signifi-cant share (15.8%) of total cash paid to banks’ cash departments.
As for cash withdrawals from banks’ cash depart-ments, which totalled 17.5 trillion rubles in 2008, with-drawals from household deposits made up 34.1%, wages, social allowances and students’ grants ac-counted for 18.3% and withdrawals from household accounts connected with settlements unrelated to commercial activities accounted for 6.7%.
The highest rates of growth in cash receipts, as compared with 2007, were registered in the receipts of payments on loans, which doubled year on year, re-ceipts from real estate transactions, which increased by 37.6%, receipts from taxes, duties and insurance premiums, which rose by 36.8%, and receipts from the sale of goods, which showed a growth of 28.0%. For the first time since 2004 there was a fall (by 2.7%) in payments to household accounts for settlements unrelated to entrepreneurial activities.
The share of cash withdrawals for payments re-ceived by individuals without opening an account ex-panded significantly (by 63.5%) within the structure of cash withdrawals from banks’ cash departments. There was substantial growth in the share of cash withdrawals from household deposits (28.5%) and payments of loans (27.2%).
Retail payments accounted for more than half of all cash payments to banks’ cash depart-ments in 2008.
In the second half of 2008, people tended to buy foreign currency to protect their incomes from devalu-ation, as the ruble weakened and public confidence
ANALYSIS AND STATISTICS — 20. 2010 14
in banks declined. Over the year, cash receipts from foreign exchange sales to households increased by more than 80% year on year. At the same time, cash withdrawals by credit institutions to individuals selling foreign currency to them decreased significantly (by 28%). This changed the ratio between the receipts and withdrawals associated with currency exchange operations: each ruble received in cash from foreign exchange sales in 2008 corresponded to 0.36 rubles of cash paid for foreign currency purchases from households (compared to 0.90 rubles in 2007). The balance of cash receipts and payments from banks’ cash departments related to currency exchange op-erations in Russia increased more than 11 times to 1,289.8 billion rubles.
A total of 7.5 trillion rubles passed through Russia’s ATMs in 2008, with daily turnover averaging 25 billion
Table 1.1. Major sources of cash receipts and purposes of cash withdrawals in 2008
Receipts Value, trillion rubles Share of total value, % Growth rate, % Withdrawals Value, trillion rubles Share of total value, % Growth rate, %
Proceeds from sale of goods 8.2 33.9 28.0 Payments for wages, social benefits and students’ grants
3.2 18.3 12.0 Receipts from commercial
non-bank organisations permitted to accept cash from individuals as payment for electronic communications services, rent and utilities
0.1 0.3 – Payments for expenses unrelated to wages and social benefits
0.2 1.2 22.5
Proceeds from provision of paid services (work performed)
2.2 9.3 12.5 Payments for purchase of agricultural products
0.1 0.8 0.7 Receipts from taxes, duties and
insurance premiums
0.4 1.7 36.8 Payments for pensions, allowances and insurance indemnities
0.3 1.7 6.1
Receipts from individuals for money remittances
0.5 2.1 –11.0 Money remittances (made without opening payee accounts)
0.3 2.0 63.5
Loan receipts and credit repayments
1.3 5.3 101.1 Lending 0.8 4.6 27.2
Receipts from real estate transactions
0.4 1.7 37.6 Receipts of funds to household
deposit accounts
3.8 15.8 18.0 Withdrawals from household deposit accounts
6.0 34.1 28.5 Receipts from Federal
Communications Agency organisations 0.4 1.6 8.0 Payments to Federal Communications Agency organisations 1.3 7.4 35.9
Receipts of funds to individual unincorporated entrepreneurs’ accounts
2.0 8.1 21.6 Withdrawals from individual unincorporated entrepreneurs’ accounts
0.7 4.1 15.6
Proceeds from transactions with government and other securities and promissory notes
0.1 0.4 –6.8 Payments for transactions with government and other securities and promissory notes
0.1 0.6 –49.3
Receipts from gambling business operations
0.1 0.4 –
Receipts from payment card operations
0.6 2.3 – Payments for payment card operations
1.0 5.7 –
Proceeds from sale of foreign currency to individuals
2.0 8.3 81.3 Purchase of foreign currency from individuals
0.7 4.1 –28.0 Receipts of funds to household
accounts
1.3 5.5 –2.7 Withdrawals from household accounts
1.2 6.7 –45.5 Other receipts 0.7 3.3 –24.9 Withdrawals for other purposes 1.6 8.7 –10
$IBSU
4USVDUVSFPGDSFEJUUSBOTGFSTCZUZQFPG
TFUUMFNFOUEPDVNFOUJO WPMVNF
-FUUFSTPGDSFEJUBDDPVOUFEGPSMFTTUIBO 1BZNFOU PSEFST *OEJWJEVBMTq EPDVNFOUT$IBSU
4USVDUVSFPGDSFEJUUSBOTGFSTCZUZQF
PGTFUUMFNFOUEPDVNFOUJO WBMVF
.POFZUSBOTGFST NBEFCZ JOEJWJEVBMT XJUIPVUPQFOJOH BCBOLBDDPVOU -FUUFSTPGDSFEJU 1BZNFOU PSEFSTrubles. On average, 53,100 rubles in cash passed through Russia’s ATMs, per inhabitant. The ratio of cash that passed through the ATMs to cash that passed through banks’ cash departments was 18%.
The volume of ATMs paying and/or accepting cash rose by 22.0% in the last nine months of 2008 and reached 79,400 as of end of 20085. As a result, at the end of 2008, one ATM had an average daily cash turnover of 315,000 rubles.
1.4. Cashless payment instruments
1.4.1. Credit transfers
In 2008, as in previous years, in Russia credit transfers were the most widely used cashless pay-ment instrupay-ment. Over the year, 2.0 billion transac-tions totalling 699.9 trillion rubles were carried out in the form of credit transfers: these included payments by customers of credit institutions (individuals and le-gal entities other than credit institutions), and credit institutions’ own payments.6 Despite the contraction of the share of credit transfers in total volume of pay-ments carried out by credit institutions compared to 2007, it remained significant – 75.6%. In value terms, this share expanded to 96.1%.
The volume and value of credit transfers rose by 12.1% and 7.0%, respectively. Limited growth in the value of this category of payments is attributable to a reduction in the average transaction value from 375,300 to 358,300 rubles.
No significant changes were registered in the structure of credit transfers in 2008. Payments by payment orders continued to play a major role, ac-counting for nearly 60% of the total volume of cred-it transfers and for 99.5% of their total value (in 2007 – 58.0% and 99.6%, respectively).
The volume and value of payments in rubles and foreign currency made by payment orders in-creased by 11.4% and 6.9%, respectively, and in 2008 1.1 billion transactions was executed total-ling 696.5 trillion rubles. Of these, payments made by legal entities other than credit institutions ac-counted for 75.6% of the total volume and 43.3% of the total value; credit institutions’ own payments accounted for 8.9% and 55.6%, respectively, and in-dividuals’ payments accounted for 15.5% and 1.1%, respectively.
Credit transfers remained the most commonly used cashless payment instrument.
Money transfers made by individuals without open-ing a bank account accounted for over 40% of the total volume of credit transfers and 0.4% of their total 5 Data on the number of cash-accepting ATMs have been collected since April 1, 2008.
6 Here and below in this chapter data are cited on payments made in Russian rubles and foreign currency.
7 Here and below in this survey neg stands for ‘negligible.
Table 1.2. Relative importance of cashless
payment instruments in payments made by customers of credit institutions and in credit institutions’ own payments in 2008
Share of volume, % Share of value, % Average payment, thousand rubles Credit transfers 75.6 96.1 358.3 Direct debits 4.1 3.7 252.3 Bank cards 20.3 0.2 2.2
ANALYSIS AND STATISTICS — 20. 2010 16 $IBSU4USVDUVSFPGNPOFZUSBOTGFSTNBEFCZ JOEJWJEVBMTXJUIPVUPQFOJOHBCBOLBDDPVOUJO WBMVF 'PSFJHO DVSSFODZ USBOTGFST 5SBOTGFST UPMFHBM FOUJUJFT 5SBOTGFSTUP JOEJWJEVBMT 3VCMFUSBOTGFST
value in 2008. Although their share in the total vol-ume and value of individuals’ payments contracted slightly (from 83.0% to 82.6% and from 28.7% to 26.8%, respectively), they remained one of the most common types of payment in the structure of credit transfers. Compared to 2007, the volume and value of these transfers increased by 12.9% and 18.3%, respectively, and reached 827.2 million transactions with a total value of 2,930.8 billion rubles. The aver-age money transfer remained virtually unchanged at 3,500 rubles. Ruble transfers accounted for 98.3% of the total volume and 88.6% of the total value of money transfers. Foreign currency transfers ac-counted for 1.7% and 11.4%, respectively. Individu-als transferred money without opening a bank ac-count mainly to pay their utility charges, internet bills, rent, taxes, fines, mobile phone and television services.
In 2008, the share of payments made by letters of credit did not exceed several hundredth of a per-cent in both volume and value. Nevertheless, letters of credit have become more popular. Over the year, their volume and value grew 1.2 and 2.1 times and reached 51,000 payments to the amount of 493.8 million
ru-Inset 2
Cross-border money remittances of individuals
The total value of cross-border money remittances8 in 2008 increased by 29.6% year-on-year and reached 51.9 billion US dollars. Such significant growth was largely the result of the rapid increase in money remit-tances from Russia, the value of which grew by 37.9% in 2008. Meanwhile, cross-border money remitremit-tances to Russia increased by just 5.9%. There has been a tendency of faster growth of money remittances of individuals from Russia comparing to similar remittances to Russia (a negative balance) for several years now. In 2008 alone, this balance increased from 19.6 to 30.3 billion US dollars.
In 2008, as in previous years, transaction volumes with non-CIS countries exceeded those with CIS coun-tries (69.3% versus 30.7%). At the same time, rates of increase of operations with CIS councoun-tries (38.2%) grew considerably faster than those with non-CIS countries (26.1%).
The top six sender countries (Switzerland, the United States, Cyprus, the United Kingdom, Germany and Kazakhstan) accounted for more than half of all money remittances to individuals in Russia, while the top six recipient countries (China, Switzerland, Uzbekistan, Tajikistan, Ukraine and the United States) accounted for more than 40% of all remittances from Russia.
Remittances from Russia accounted for almost 80% of the total value of cross-border transfers, in which transfers made by resident individuals (which grew by 38.4% in 2008) accounted for over 60%. The most sig-nificant resident operations in 2008, as in previous years, were remittances connected with the outflow of finan-cial resources (33.1%)9 and non-repayable remittances (28.6%),10 of which more than 80% were made through money transfer systems. Payments for goods and services accounted for over 17% of the total value of trans-fers abroad. Bank transtrans-fers totalling 3.3 billion US dollars were made for the purpose of buying goods, which is 1.7 times more than the previous year. Payments to travel agencies and operators accounted for two-thirds of private remittances. In addition, payments connected with education and tuition played a major role, accounting for 12.9%.
8 Cross-border money remittances in this survey signify cross-border cashless transfers (receipts) of resident and non-resident individuals to resident and non-resident individuals (in favour of resident and non-resident individuals) made with or without opening of an account through credit institutions, including remittances made through money transfer systems and Russian Post.
9 The outflow of financial resources in this survey includes remittances from resident individuals’ accounts with authorised banks to the same resident individuals’ non-resident bank accounts.
10 Non-repayable remittances in this survey include grants, donations, compensations, scholarships, pensions, alimony, inheri-tance payments, gifts and all payments made by resident individuals through money transfer systems.
$IBSU
$SPTTCPSEFSNPOFZSFNJUUBODFTJOCZ
SFHJPOCJMMJPO64EPMMBST
3FNJUUBODFTUP3VTTJB 3FNJUUBODFTGSPN3VTTJB $*4 /PO$*4 DPVOUSJFT $*4 /PO$*4 DPVOUSJFT$IBSU
$SPTTCPSEFSSFNJUUBODFTCZSFTJEFOU
JOEJWJEVBMTGSPN3VTTJBJO
1BZNFOUT GPSTFSWJDFT 1BZNFOUTGPS HPPET /POSFQBZBCMF SFNJUUBODFT 0VUGMPXPG GJOBODJBM SFTPVSDFT 3FBMFTUBUF PQFSBUJPOT 0UIFS $IBSU$SPTTCPSEFSSFNJUUBODFTUPSFTJEFOU JOEJWJEVBMTJO3VTTJBJO 1BZNFOUTGPSHPPETBOETFSWJDFT 8BHFTBOETBMBSJFT /POSFQBZBCMF SFNJUUBODFT *OGMPXPGGJOBODJBMSFTPVSDFT 3FBMFTUBUF PQFSBUJPOT 0UIFS$IBSU"WFSBHFDPNNJTTJPO GPSSFNJUUBODFTGSPN 3VTTJBWJBNPOFZUSBOTGFSTZTUFNT $PNNJTTJPO BTPGUSBOTGFSBNPVOU 64EPMMBST
The share of private non-resident remittances out of Russia in total value of cross-border transfers from Russia in 2008 remained unchanged compared to the previous year. In terms of value non-resident remit-tances from Russia increased by 36.8% and in 2008 totalled 15.5 billion US dollars.
Most of the remittances to individuals in Russia (75%) were made to residents and 25.9% of these were transfers from individuals’ foreign bank accounts to the same individuals’ accounts in Russian banks. Non-repayable remittances ranked second in the structure of remittances from abroad (23.3%), in which 86% were transfers made via money transfer systems.
In 2008 about 0.9 billion US dollars was transferred from abroad to resident individuals’ accounts in Russia as wages and salaries. Operations of foreign shipping companies that pay wages to employees by transferring funds to Russian banks accounted for nearly 15% of that amount.
An insignificant share in the structure of receipts (4.7%) was held by funds received from the sale of goods and services, which mostly consist of earnings from the sale of personal property by individuals (antiques, cars, etc.) and payments for the financial, legal, consulting and other services provided by individuals, as well as royalties.
The total value of cross-border remittances made through money transfer systems and the Federal Post (hereinafter referred to as money transfer systems) had increased 8 times since 2003 and reached 15.7 billion US dollars in 2008. Annual growth stood at around 150%. This high rate of growth was largely at-tributable to the transfers from Russia. Compared to 2007 the value of money remittances from Russia effected through money transfer systems increased by 45.1% and reached 13.7 billion US dollars in 2008. Money transfers to Russia grew more slowly: they increased by 17.6% and reached 2.0 billion US dollars. The world financial and economic crisis in the last quarter of 2008 slowed growth in money remittances through money transfer systems, as the average transfer contracted in dollar terms and growth in the vol-ume of transactions slowed down.
According to estimates, the commission the customer was charged for making a remittance from Russia through money transfer systems in 2008 averaged 3.3% of the transferred amount. In the past few years, commissions have fallen significantly, especially in the 100 to 200 US dollars transfer range. In comparison to 2007 in 2008 commissions decreased by an average of 6%.
ANALYSIS AND STATISTICS — 20. 2010 18
$IBSU
*ODSFBTFJOWPMVNFPGQBZNFOUTNBEF
JOUIFGPSNPGEJSFDUEFCJUTCZUZQFPGDVTUPNFSJO
BTPG
1BZNFOUPSEFST $PMMFDUJPOPSEFST *OEJWJEVBMT -FHBMFOUJUJFTPUIFSUIBO DSFEJUJOTUJUVUJPOT $SFEJUJOTUJUVUJPOT v *OEJWJEVBMT -FHBMFOUJUJFTPUIFSUIBO DSFEJUJOTUJUVUJPOT $SFEJUJOTUJUVUJPOT 1BZNFOUPSEFST $PMMFDUJPOPSEFST$IBSU
*ODSFBTFJOWBMVFPGQBZNFOUTNBEF
JOUIFGPSNPGEJSFDUEFCJUTCZUZQFPGDVTUPNFS
JOBTPG
v$IBSU
$SFEJUUSBOTGFSTBTPGUPUBMWPMVNFBOE
WBMVFPGQBZNFOUTJO
#ZWPMVNF #ZWBMVF 'SBODF *UBMZ (FSNBOZ 4XJU[FSMBOE 3VTTJB #FMHJVNbles. Of these, legal entities other than credit institu-tions accounted for 52.5% and 94.5%, respectively, individuals – 21.5% and 4.4%, and credit institutions’ own payments – 26.0% and 1.2%. The average pay-ment by a letter of credit increased 1.8 times in 2008 and reached 9.7 million rubles.
A comparison with data of the member countries of the Committee on Payment and Settlement Sys-tems11 shows that in Russia credit transfers are the most widely used cashless payment instrument. In 2008, the share of credit transfers in total cashless payments12 was 57.3% in Russia, 55.4% in Switzer-land, 42.2% in Belgium, 35.2% in Germany, 30.6% in Italy and 17.1% in France. At the same time, Rus-sia lagged behind these countries in terms of credit transfers per capita (14.5). In Switzerland there were 88.0 credit transfers per capita, in Belgium – 86.8, in Germany – 68.5, in France – 42.1 and in Italy – 17.9 transactions.
1.4.2. Direct debits
Payments in the form of direct debits were not used as widely as credit transfers in the Russian pay-ment system. In 2008, they accounted for 4.1% of the total volume and 3.7% of the total value of pay-ments effected through credit institutions. However, the volume of direct debits increased by 30.6% year on year and reached 106.5 million. This significant growth was largely the result of a 150% rise in the volume of payments made using collection orders. At the same time, payments conducted using pay-ment orders, which accounted for more than 70% of total volume of direct debits in 2008, increased by just 11.3%.
The growth in the volume of payments made via collection orders and payment orders was largely due to the increased use of these settlement docu-ments by credit institutions in settledocu-ments with in-dividuals. The volume of payments conducted from individuals accounts via payment orders rose 2.2 times in 2008; payments made via collection orders – 4.2 times.
The volume of payments effected from the ac-counts of corporate entities other than credit institu-tions in the form of direct debits increased by 5.6% year on year, whereas payments made by payment orders – by 4.8% and payments made by collec-tion orders – by 13.3%. The volume of credit insti-tutions own payments using payment and collec-tion orders in 2008 decreased by 10.1% and 20.0%, respectively.
At the same time, the value of payments effect-ed in the form of direct debits contracteffect-ed by 12.1%
11 Here and below in this chapter, the source of inter-national statistics is the Bank for Interinter-national Settlements Red Book (www.bis.org/publ/cpss87.pdf) and the European Central Bank Blue Book (www.sdw.ecb.europa.eu/reports. do?node=1000001964).
$IBSU
4USVDUVSFPGQBZNFOUTNBEFJOUIFGPSN
PGEJSFDUEFCJUTCZUZQFPGTFUUMFNFOUEPDVNFOUJO
1BZNFOUPSEFST $PMMFDUJPOPSEFST #ZWPMVNF #ZWBMVF$IBSU
4IBSFPGEJSFDUEFCJUTJOUPUBMWPMVNF
BOEWBMVFPGQBZNFOUTJO
(FSNBOZ *UBMZ $BOBEB 4JOHBQPSF 4XJU[FSMBOE 3VTTJB 4XFEFO #ZWPMVNF #ZWBMVF$IBSU
5PUBMWBMVFPGEJSFDUEFCJUTJO
BTPG(%1
4XJU[FSMBOE 4XFEFO 3VTTJB #FMHJVN *UBMZ 4JOHBQPSF 64" (FSNBOZto 26.8 trillion rubles. Payments made by payment orders, which accounted for 98.9% of the total val-ue of direct debits, contracted by 12.4% in valval-ue. There was a significant increase in the value of pay-ments by collection orders (42.7%), but they ac-counted for a mere 1.1% of the total value of direct debits.
The experience of other countries where cashless payment instruments are used reveals that direct debits are small in volume and in value. In Russia, direct debits accounted for 2.9% of the total vol-ume of payments and 1.2% of their value in 2008.13 The analysis of similar indicators in various countries has shown that on the whole, the situation in Rus-sia is comparable with that in Singapore (2.3% and 6.7%, respectively), Switzerland (3.6% and 1.5%) and Canada (7.9% and 4.9%). As for the CPSS member countries, the leader in terms of the use of direct debits is Germany, where direct debits ac-counted for 50% of all payments and 15.4% of their total value.
Relative to GDP, the value of direct debits in Rus-sia stood at 15.9% in 2008. In this respect, RusRus-sia was comparable to some developed countries, such as Switzerland (11.9%), Sweden (14.3%), Belgium (18.5%), Italy (22.0%) and Singapore (23.2%). In Germany, the value of direct debits exceeded the country’s GDP 3.5 times in 2008.
1.4.3. Bank cards
Bank cards are one of the most dynamically de-veloping cashless payment instruments in Russia, and bank card payments have been growing rapidly in the past few years. Compared to 2007, the volume and value of payments made by bank cardholders in and outside Russia increased by 47.8% and 78.6%, respectively, and in 2008 the number of bank card transactions reached 524.7 million and their value stood at 1,173.5 billion rubles. Such significant growth led to the increase in the volume and value of bank card payments in per inhabitant terms: 3.7 bank card payments with a total value of 8,300 rubles were made in 2008 per inhabitant (compared with 2.5 payments with a total value of 4,600 rubles in 2007).
The expansion by credit institutions of the range of payment services involving the use of bank cards (ATM payments, card-to-card transfers, etc.) has led to a change in the structure of cashless payments. In 2008, the share of bank card payments in total pay-ments processed by credit institutions increased by 4.1 percentage points year-on-year, to reach 20.3%. At the same time, when we take into consideration that bank card operations are mostly conducted by individuals, the share of bank card payments in the to-tal value of bank customer payments and credit insti-tutions’ own payments remained virtually unchanged and insignificant (0.2%).
ANALYSIS AND STATISTICS — 20. 2010 20
Inset 3
Development of bank card payments
The bank card market continued to make progress in 2008. The volume and value of bank card payments had increased in the preceding years, and was not just a result of the rise in the number of cards issued by credit institutions. This growth was attributable to a great extent to the dynamic development of the bank card processing infrastructure and to the innovations in the sphere of payment techniques responsible for the expansion of the range of banking services involving the use of bank cards.
By the beginning of 2009, over 60% of Russian credit institutions issued and/or acquired payment cards (707 out of 1,108 credit institutions). Of these, 678 credit institutions issued bank cards and 634 credit institutions acquired bank cards.
As of end of 2008, the number of bank cards issued to households and legal entities stood at 119.2 million, an increase of 15.2% over the year (in 2007 the growth was 38.4%). The slowdown is largely attributable to the saturation of the market with bank cards. By the end of 2008, there were 0.8 bank cards per inhabitant.
At the same time, in this respect Russia lagged far behind such industrialised countries as Singa-pore (with 3.3 cards per inhabitant), Sweden (1.6 cards per inhabitant), Germany (1.5 cards per in-habitant) and Italy (1.3 cards per inin-habitant). The corresponding figures for CIS member countries Be-larus and Kazakhstan at the end of 2008 were 0.6 and 0.5, respectively.
Cards issued by international payment systems accounted for nearly 90% of the total number of cards issued in Russia. However, the share of active cards14 in the total number of international payment system cards is rather small. In 2008, it was 45% per quarter on average, whereas the similar indicator for Russian payment system cards was 58%.
Debit cards accounted for over 90% of the total number of cards and in 2008 their number rose by 16.2% to 109.3 million. The main reason why this type of card is more widely used than other types is that the Russian market emerged and gained strength mainly as a result of the implementation by credit institutions of so-called ‘wage payment proj-ects’, which were designed to encourage the use of bank cards.
The trend towards growth in the number of credit cards continued in 2008, but this growth was con-siderably slower than it had been in previous years. The number of credit cards issued rose by just 3.9%, which represents a decrease of 14.7 times from a year earlier and of 32.9 times from 2006. This mas-sive decline is mainly the result of the scaling back by credit institutions of their consumer lending pro-grammes amid the world financial and economic crisis, and the increased risk of default on loans. The rate of growth in loans extended to households declined from 59.7% in 2006 to 35.2% in 2008. 14 Here and below ‘active cards’ are those that are used in at least one operation connected with cash withdrawal and (or) payment for goods and services, including customs payments, during the reporting quarter.
$IBSU
(SPXUIJOOVNCFSPGCBOLDBSETBOE
DBTIMFTTQBZNFOUTNBEFVTJOHCBOLDBSETBOECBOLDBSE
BDDFQUJOHEFWJDFT
7BMVFPGDBTIMFTTQBZNFOUTNBEFVTJOHCBOLDBSET 7PMVNFPGDBTIMFTTQBZNFOUTNBEFVTJOHCBOLDBSET %FWJDFTBDDFQUJOHCBOLDBSETGPSQBZNFOU /VNCFSPGCBOLDBSET$IBSU
/VNCFSPGCBOLDBSETQFSJOIBCJUBOU
JO
4JOHBQPSF 4XFEFO (FSNBOZ
*UBMZ 3VTTJB ,B[BLITUBO #FMBSVT
$IBSU
3BUFTPGHSPXUIJOMPBOTFYUFOEFE
UPIPVTFIPMETBOEJOOVNCFSPGDSFEJUDBSET
(SPXUIJOWBMVFPGMPBOT (SPXUIJOOVNCFSPGDBSETAlthough the share of prepaid cards in the total number of cards remained insignificant (0.5%), their growth in 2008 exceeded that of debit and credit cards. The number of prepaid cards rose by 30% in 2008 and by the end of the year reached 600,000. At the same time, taking into account the specifics of the prepaid cards15, the indicator that best characterises their development is the number of prepaid cards active during a certain period, rather than the number of prepaid cards active as of the end of the year. In 2008, this indicator averaged 1.7 million cards per quarter; the average quarterly rate of growth for this figure was 77.3% and its highest level (3.0 million cards) was registered in the 4th quarter of 2008. Growth in the number of prepaid cards is largely the result of efforts made by the Bank of Russia to im-prove the regulation of bank card operations. Specifically, prepaid cards can now be issued in electronic form16.
In 2008, as in previous years, operations conducted by bank cardholders in Russia and abroad increased at rapid rates. Over the year, their number rose by 31.3% to 2.1 billion and their value grew by 44.6% to 9.4 trillion rubles. Of these, cash withdrawal operations accounted for 75.3% in number and 87.5% in value, payments for goods and services17 accounted for 24.3% and 11.2%, respectively, and other operations18 accounted for 0.4% and 1.3%.
For several years now, the structure of bank card operations has revealed faster growth in payments for goods and services than cash withdrawal operations. In 2008, the volume of card payments for goods and services increased by 45.2%, or almost twice
as fast as cash withdrawals (23.1%), while in value terms card payments for goods and services grew by 72.4%, or more than three times as fast as cash withdrawals (23.1%). The accelerated growth in the value of card payments for goods and services, as compared with their volume is the result of the in-crease from 1,300 rubles to 1,600 rubles of the aver-age card payment for goods and services in 2008.
In 2008, bank cards were also used for customs payments and money transfers to bank accounts. A total of 0.5 million customs payments with an amount totalling 236.1 billion rubles were made over the year; the average payment made was 490,700 rubles. Bank cards were widely used to make card-to-card money transfers, charity payments, etc. Cardholders made 9.2 million payments of this kind for a total of 126.2 billion rubles, the average amount of payment being 13,700 rubles.
In 2008, as in previous years, bank card opera-tions to withdraw cash prevailed over cashless pay-ments, despite the latter’s rapid growth. The volume of such payments increased by 50% and their value increased by 80%. However, their share in the total volume and value of bank card operations expanded only slightly, to 23.8% and 11.0%, respectively (as against 21.9% and 8.4% in 2007). Bank cardhold-ers made the largest proportion of payments using ATMs. Over the year, the number of such payments grew by 50% and their value doubled. ATM payments were small as a rule (the average payment was about 250 rubles). Payments for goods and services made through point-of-sale (POS) terminals and imprinters increased by 31.2%
15 A prepaid card has a fixed nominal value of up to 5,000 rubles and, as a rule, it is not replenished, that is, the term of the card expires after the prepaid amount has been spent.
16 Bank of Russia Ordinance No. 2073-U, dated September 23, 2008, ‘On Amending Bank of Russia Regulation No. 266-P of December 24, 2004, on the Issue of Bank Cards and Operations Conducted Using Payment Cards.’
17 Including customs payments.
18 Card-to-card transfers, charity payments, etc.
$IBSU
7PMVNFPGCBOLDBSETBOEDBTIMFTTQBZNFOUT
NBEFVTJOHCBOLDBSET
NJMMJPODBSET CJ MMJP O SV CM FT /VNCFSPGCBOLDBSET 7PMVNFPGDBTIMFTTQBZNFOUT 7BMVFPGDBTIMFTTQBZNFOUT SJHIUIBOETDBMF$IBSU
4USVDUVSFPGCBOLDBSEPQFSBUJPOT
DPOEVDUFEJOBOEPVUTJEF3VTTJBJO
7PMVNF 7BMVF 7PMVNF 7BMVF $BTIXJUIESBXBMT $BTIMFTTQBZNFOUT *O3VTTJB 0VUTJEF3VTTJBANALYSIS AND STATISTICS — 20. 2010 22
in volume and 58.6% in value; payments made through the Internet grew by 4.6% and 46.1%, respectively.
The volume and value of bank card operations conducted outside Russia increased by more than 50% in 2008. Payments for goods and services accounted for almost 70% of the volume of these operations and 60% of their value. The average payment made was worth 6,200 rubles, an increase of 3.1 times on the average bank card payment made inside Russia.
Inset 4
Electronic money development
The rapid development of electronic money on the Russian retail payment services market began a few years ago. The emergence of this new advanced instrument of payment was facilitated by the precipitous development of information and telecommunications systems in recent years.
E-money is extremely easy to use and it is accessible to a wide range of users. It can be used, for ex-ample, to pay for goods, work and services in any place with an Internet connection or through a mobile telephone, which ensures instant payment.
International experience shows that the developers of these technologies attach great importance to the legal aspect of their application. In the European Union, for example, e-money is regulated by Directive 2000/46/EC, which defines e-money and sets requirements for its issuers with respect to e-money issue volumes, capital, e-money retirement, the supervision of the e-money issuers by authorised agencies, and other requirements.
In Russia e-money is planning to be regulated by the Federal Law on the National Payment System, which has special provisions regulating the use of e-money on the basis of its definition as a new instru-ment of payinstru-ment. The project of this law considers e-money as an electronic prepaid instruinstru-ment of pay-ment that is used as part of the banking operation to transfer funds on the instructions of individuals with-out opening a bank account, which is stipulated in Article 5 of the Federal Law on Banks and Banking Activities.
The legislative regulation is used as the basis for the elaboration of common systemic requirements de-signed to ensure the transparency of the retail payment services market, encourage the creation of a healthy competitive environment for market players, and safeguard the rights of consumers, bearing in mind the outlook for the development of e-money. These efforts are expected to make payment services better and more accessible to the public, stimulate the cashless retail payments market and facilitate the introduction of new technology and techniques to this market.
1.4.4. Cheques
Credit institutions processed 34,000 cheque payments for an amount totalling 9.7 billion rubles in 2008. The share of these payments in the to-tal number and value of ruble and foreign cur-rency payments did not exceed several thousandth of a percent. The average cheque payment was 285,300 rubles.
$IBSU
4USVDUVSFPGQBZNFOUTFGGFDUFEUISPVHI
UIFCBOLJOHTZTUFNPG3VTTJBJO
1BZNFOUTFGGFDUFEUISPVHI UIFQSJWBUFQBZNFOUTZTUFNT 1BZNFOUTFGGFDUFEUISPVHIUIF #BOLPG3VTTJB #ZWPMVNF #ZWBMVF$IBSU
4USVDUVSFPGQBZNFOUTFGGFDUFEUISPVHI
QSJWBUFQBZNFOUTZTUFNTJOCZDVSSFODZ
3VCMFQBZNFOUT 'PSFJHODVSSFODZQBZNFOUT #ZWPMVNF #ZWBMVF1.5. General characteristics of cashless payments effected through the banking system of Russia
In 2008, a total of 2.9 billion payments19 to the amount of 1,213.4 trillion rubles were effected through the Russian banking system institutions pro-viding payment services20. On average 11.4 million payment transactions were carried out daily to the amount of 4.9 trillion rubles. The average payment executed through the Russian banking system in-creased slightly in 2008 and reached 425,400 rubles (as against 415,400 rubles in 2007). Payments ef-fected through the Russian banking system in 2008 grew far more slowly than in 2007: by 13.6% in vol-ume and 16.3% in value (as against 61.4% and 88.0% in 2007). The slowdown of growth was registered in payments processed both through the payment system of the Bank of Russia and private payment systems.
Ruble payments effected through the Russian banking system in 2008 accounted for 97.5% of the total volume and 72.7% of the total value of pay-ments. Their value was such that the equivalent of annual GDP turned over in just 12 days21 (as against 11 days in 2007). The average size of this payment was 317,100 rubles (as against 303,800 rubles in 2007).
The payment system of the Bank of Russia plays a major role in the Russian payment system, account-ing for 33.0% of the total volume and 42.5% of the total value of payments executed through the Russian payment system. Daily, 3.8 million payments worth 2.1 trillion rubles passed through the payment system of the Bank of Russia, with the average payment being 549,200 rubles.
The payment system of the Bank of Russia ac-counted for over 40% of the total value of pay-ments effected through the banking system of Russia.
In 2008, credit institutions processed on average 7.6 million payments to the amount of 2.8 trillion ru-bles a day. Thus, in the period under review about two in three ruble and foreign currency payments were ef-fected through private payment systems. The average payment in the private payment systems was 364,500 rubles, or 1.5 times smaller than in the payment sys-tem of the Bank of Russia.
Almost a half of the total value of payment trans-actions conducted through credit institutions in
19 Here and below payments in Russian rubles and foreign currency.
20 Bank of Russia branches, credit institutions and their branches, additional offices, operations offices, cash and credit offices and cash operations departments outside cash settle-ment centres.
21 In the 15 leading EU countries, this indicator is 8 days on average (see Harry Leinonen. Payment habits and trends in the changing e-landscape 2010+. Bank of Finland, 2008).
$IBSU(SPXUIJOQBZNFOUTFGGFDUFEUISPVHI UIFCBOLJOHTZTUFNPG3VTTJB 1BZNFOUTFGGFDUFE UISPVHIUIF#BOL PG3VTTJB 1BZNFOUTFGGFDUFE UISPVHIUIF#BOL PG3VTTJB 1BZNFOUTFGGFDUFE UISPVHIQSJWBUF QBZNFOUTZTUFNT 1BZNFOUTFGGFDUFE UISPVHIQSJWBUF QBZNFOUTZTUFNT #ZWPMVNF #ZWBMVF
ANALYSIS AND STATISTICS — 20. 2010 24 7PMVNF 7BMVF 7PMVNF 7BMVF )PVTFIPMET -FHBMFOUJUJFT
$IBSU
(SPXUIJOFMFDUSPOJDQBZNFOUPSEFST
JO
2008 were in foreign currency. At the same time, these payments accounted for just 4% of the to-tal volume of payments passed through the private payment systems. On average 0.3 million foreign currency payments to the amount of 1.3 trillion rubles were effected through credit institutions a day.
Compared to 2007, the volume of foreign currency payments rose by 27.2% to 71.9 million transactions and the value of these payments increased by 11.5% to 331.4 trillion rubles. Such a relatively small increase in value was the result of the reduction of the aver-age transaction amount from 5.3 million rubles to 4.7 million rubles. However, foreign currency payments were usually much larger than ruble payments. In 2008 the average foreign currency payment was 8.5 times larger than the average ruble payment effected through the Bank of Russia payment system and in the private payment systems the average foreign cur-rency payment was 23.5 times larger than the average ruble payment.
1.5.1. Funds turnover in the private payment systems
In 2008, the turnover ratio of funds in credit insti-tutions’ correspondent accounts increased year-on-year (the average number of turnovers rose from 0.8 to 1.3 per day). In the first half of 2008, funds were used more intensively which was affected by increase in the demand for the servicing of the economic turn-over of business entities under rapid growth in the economy (in January-June 2008 real GDP expanded by 8.0% against the same period a year earlier) and money supply (39.1% on average). In the 3rd and 4th quarters, despite the negative effect of the financial and economic crisis on the Russian economy, be-cause of the government support measures to en-terprises taken by the Bank of Russia to maintain banking sector liquidity, the turnover ratio exceeded the average annual value, registering 1.6 and 1.4, respectively.
1.6. Methods of effecting payments
in the private payment systems
1.6.1. Methods of forwarding payments to credit institutions
In 2008 there was a positive trend of growth in payments forwarded by customers to credit institu-tions electronically, including via the Internet and mo-bile phones. Electronic payment orders increased by 21.9% in volume and 10.0% in value year-on-year. Their share in the total volume and value of payment orders grew slightly to 60.9% (624.5 million transac-tions) and 78.5% (243.0 trillion rubles).
Legal entities other than credit institutions used new methods more actively than households in 2008:
$IBSU
4USVDUVSFPGQBZNFOUTGPSXBSEFEUP
DSFEJUJOTUJUVUJPOTJO
1BZNFOUTNBEFCZQBZNFOUPSEFST #ZWPMVNF #ZWBMVF 1BQFSCBTFE &MFDUSPOJDBMMZ
they sent almost 70% of payment orders electroni-cally, which accounted for 80.1% of the total value of their payments. The development of Internet-based technology and the increased security of Internet payments largely affected the structure of electronic payments of legal entities. While in 2007, payments made via the automated bank-customer system pre-vailed, accounting for 69.6% of the total volume and 64.5% of the total value of payments made by legal entities other than credit institutions, in 2008 most of the payments were effected through the websites of credit institutions (61.4% of payments by volume and 58.8% by value).
As in previous years, private individuals preferred to make payments using paper-based payment
Inset 5
Development of Internet banking in Russia
In recent years Internet banking has become one of the methods most frequently used by credit institu-tions to provide remote banking services in Russia.
In 2001, fifty-four credit institutions had their own websites and several of them provided online pay-ment and settlepay-ment services. In 2005, nearly 900 credit institutions had their own websites and 320 of them provided online banking services (with access to accounts); in 2006, respectively – nearly 950 and over 380; in 2007, the number of credit institutions with their own websites remained the same, while 420 of them provided online services (this figure takes into account banking licence revocations). In 2008, the respective figures stood at about 1,000 and over 500. One of the characteristics of Internet banking in Russia is that credit institutions may use from 2 to 12 websites, each designed for a specific category of customers and performing specific functions. Another characteristic is the use by many credit institutions of several Internet banking systems (created by different developers): for legal entities and for individuals, for online trading, dealing and brokering, etc. It should be noted that by 2006 the total number of online banking software systems used by credit institutions had reached 100 and has not changed since then (some systems are removed of service, while other become more widely used). Nearly half of them have been developed by credit institutions themselves, while the remainder has been provided by independent Russian and foreign developers.
The number of customers using online banking services is steadily rising. Subsidiaries of foreign banks provide remote services to 95–100% of their customers. The customer base of the Russian credit institu-tions providing online banking services stands at about 7% on average.22
A study conducted by the Bank of Russia to gauge the spread of online banking in Russia has shown that new customers using its facilities appear virtually daily and the volume of customer orders sent via Internet is growing rapidly.
In the context of online banking in Russia, since most credit institutions underestimate the importance of predicting the development of the customer base and growth in customer orders, the processing and transmission capacity of their computer systems are often overloaded. In addition, they increasingly often become targets for attacks, such as distributed denial of service (DDoS), and their customers fall victim to fraud resulting in the unsanctioned transfer of funds from accounts. These problems are the result of insufficient attention to the security of automated banking systems, their relations with providers, information security support and financial monitoring.
Nevertheless, credit institutions consider online banking to be the most promising method of banking services development. That is why new versions with the use of WAP (Wireless Application Protocol) and Wi-Fi (Wireless Fidelity) systems appear.
ANALYSIS AND STATISTICS — 20. 2010 26
ders. Only one in four payments made by a private individual in 2008 was made electronically. At the same time, last year there was significant growth in the volume of individual payment orders sent to credit institutions electronically. Over the year, this growth totalled 41.1% in volume and 43.5% in value, where-as the respective percentages for legal entities were 20.7% and 9.8%.
Remote banking is becoming increasingly popu-lar with the public. The most rapid rates of growth have been registered in retail cashless payments of individuals effected through bank accounts by orders sent to credit institutions via the Internet and mobile phones. In 2008, the volume of such payments rose by 68.7% to 20.4 million and their value increased by 64.3% to 522.0 billion rubles. Despite the significant growth of mobile phone payments (they increased 2.3 times in volume and 4.8 times in value), their share in the total volume and value of individuals’ electronic payments remained insignificant, at 13.4% and 0.5%, respectively (as against 8.1% and 0.1% in 2007). This situation is attributable to the low level of financial lit-eracy of the population and low level of confidence in these technologies.
1.6.2. Methods of effecting payments through the private payment systems
Most payments are effected through credit insti-tutions electronically. In 2008 1.0 billion electronic payments to the amount of 585.3 trillion rubles were effected. Over the same period, 0.9 billion payments to the amount of 111.8 trillion rubles were paper-based.
As a result, electronic payments accounted for 53.0% of the total volume and 84.0% of the total value of payments, whereas paper-based payments accounted for 47.0% and 16.0%, respectively. The average paper-based payment was 124,500 rubles, which is 5 times less than the average payment con-ducted electronically.
Over 80% of the total value of cashless ments were effected through the private pay-ment systems electronically.
Compared to 2007, electronic payments increased by 10.6% in volume and 15.1% in value, while pa-per-based payments grew by 18.1% and 25.6%, respectively.
The overwhelming majority of payments conduct-ed by crconduct-edit institutions through inter-branch settle-ment accounts and correspondent accounts of other credit institutions were effected electronically: in 2008 their share remained unchanged at 97.9% and 96.7%, respectively, while the average payment in-creased from 296,400 to 341,900 rubles. As for electronic payments conducted through correspon-dent accounts, they accounted for 91.9% of the to-$IBSU4USVDUVSFPGQBZNFOUTFGGFDUFEUISPVHI UIFQSJWBUFQBZNFOUTZTUFNTJOCZNFUIPE CZWPMVNF 8JUIJOPOFCSBODIPGB DSFEJUJOTUJUVUJPO 5ISPVHIJOUFSCSBODI TFUUMFNFOUBDDPVOUT 5ISPVHIDPSSFTQPOEFOU BDDPVOUTPQFOFEGPS PUIFSDSFEJUJOTUJUVUJPOT 1BQFSCBTFE &MFDUSPOJDBMMZ
$IBSU
4USVDUVSFPGQBZNFOUTFGGFDUFEUISPVHI
UIFQSJWBUFQBZNFOUTZTUFNTJOCZNFUIPE
CZWBMVF
8JUIJOPOFCSBODIPGB DSFEJUJOTUJUVUJPO 5ISPVHIJOUFSCSBODI TFUUMFNFOUBDDPVOUT 5ISPVHIDPSSFTQPOEFOU BDDPVOUTPQFOFEGPS PUIFSDSFEJUJOTUJUVUJPOT 1BQFSCBTFE &MFDUSPOJDBMMZtal volume and 87.5% of the total value of payments. The average payment effected through credit insti-tutions’ correspondent accounts in 2008 increased by 5.3% year on year and reached 2.2 million rubles.
Paper-based payments are used most frequently within one division of a credit institution. In 2008, they accounted for almost 65% of all payments. At the same time, in the total value of payments the share of paper-based payments was relatively small (25.5%), owing to a small average amount of payment (85,800 rubles), which was 5.3 times smaller than the average electronic payment.
Inset 6
STP in payment process
Straight Through Processing (STP) originated about 10 years ago and gradually evolved from a term connected with securities trading to a strategy for the development of a financial market participant’s au-tomated information system. Initially the concept was used as part of the effort to cut settlement time in securities trading for the purpose of risk reduction. Later, however, as financial market participants realised its importance for enhancing the effectiveness of data processing and risk minimization, they spread it to other financial operations.
The wide use of new information and communications technologies in the financial sphere was a ma-jor factor in the spread of the STP concept. Given the constantly growing volume of trading operations and data processing, banks and payment systems confronted the need to use automated settlement and payment systems that would guarantee the speed, reliability and security of the information exchange and reduce transaction costs. The fundamental principle underlying the STP concept proved handy: it guaranteed the continuous processing of the entire inflow of financial information without manual inter-ference on an end-to-end basis (from the entry of data into the automated system to the completion of its processing) for the purpose of making operations as quick as possible, precluding errors and cutting costs.
Financial operations involve several parties and their automated systems exchange information con-stantly as data formed by one system are transmitted through electronic communications channels to the other automated system (for example, a message on money remittance is transmitted from the payer bank to the payee bank). Application of information exchange standards by automated systems is necessary to exclude manual interference at all stages of data processing. Therefore, STP may be considered as a strategy guaranteeing standardised approach to the exchange of financial information and upgrading the automated processing technology for the purpose of minimising (or, ideally, excluding) manual interference, enhancing effectiveness and cutting costs.
To quantify STP use, analysts often employ an indicator the STP level,23 which characterises the effec-tiveness of data processing and serves as a major performance index for the entire automated information system. Large banks, which consider settlements their primary activity, constantly evaluate the STP level, as it serves as a major indicator when calculating the cost of a settlement operation.
Although the term ‘Straight Through Processing’ has not gained wide spread in Russia, most of the Russian banks have upgraded their automated information systems in order to enhance their effec-tiveness and cut transaction costs. To a large degree this is connected with the growth in the volume of cross-border transactions, in which foreign banks demand that electronic payment messages should be composed in compliance with international standards. However, the STP level of cross-border trans-actions with Russian banks remains low, largely because there is no national standard for electronic in-terbank settlements and the electronic banking message formats used in exchanging information with the Bank of Russia payment system do not quite match the formats used by international payment systems.
23 The STP level is calculated as the percentage ratio of the amount of data processed automatically (without manual interfer-ence) to the total amount of processed data.
ANALYSIS AND STATISTICS — 20. 2010 28
Table 1.3. Banking system infrastructure providing payment services
01.01.07 01.01.08 Growth,
% 01.01.09
Growth, % Total banking system institutions 37,281 41,081 10.2 43,294 5.4 Of which:
– Bank of Russia branches24 923 782 –15.3 632 –19.2
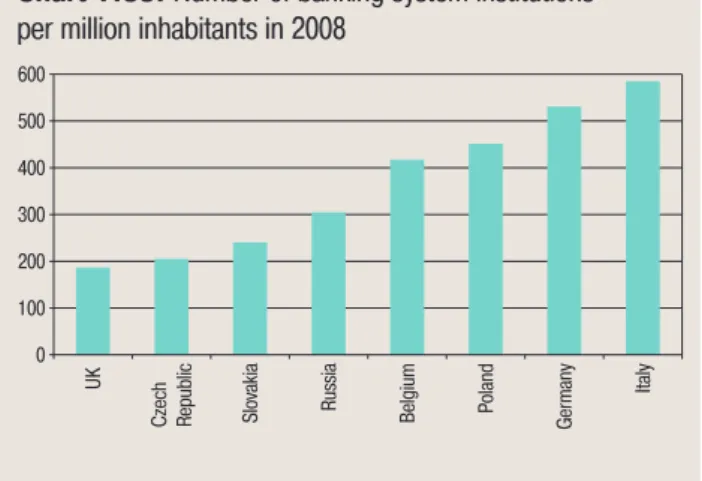
– divisions of credit institutions25 36,358 40,299 10.8 42,662 5.9 Banking system institutions per 1 mln inhabitants 261 289 10.7 305 5.5 $IBSU/VNCFSPGCBOLJOHTZTUFNJOTUJUVUJPOT QFSNJMMJPOJOIBCJUBOUTJO 6, $[FDI 3FQVCMJD 4MPWBLJB 3VTTJB #FMHJVN *UBMZ (FSNBOZ 1PMBOE
1.7. Accessibility of payment
services provided by the banking
system
1.7.1. Banking system payment infrastructure
One of the factors facilitating the accessibility of payment services is the development of the banking infrastructure that provides payment services. In 2008, the number of banking institutions providing payment services increased by 5.4% and reached 43,294 as of January 1, 2009.
At the end of 2008, Russia had 1.6 times more banking institutions per million inhabitants (305) than Britain, 1.5 times more than the Czech Republic and 1.3 times more than Slovakia. At the same time, it lagged behind Belgium (417), Poland (451), Germany (531) and Italy (585).
Compared to 2007, growth in the number of bank-ing institutions providbank-ing payment services slowed almost by half as the Bank of Russia continued to optimise its network of cash settlement centres (over the year their number declined by 150, or 19.2%, to 632 as of January 1, 2009) and growth in the num-ber of credit institution divisions slowed (their volume increased by 5.9% in 2008, whereas in 2007 it grew by 10.8%).
The number of operating credit institutions fell slightly (by 28, or 2.5%) and as of January 1, 2009, stood at 1,108.
The number of credit institution branches re-mained virtually unchanged. As of the beginning of 2009, they numbered almost 3,500 and grew at an annual rate of just 0.4% as against 5.3% in 2007. At the same time, the number of credit institution branches (less Sberbank branches) rose by almost 2%, while the number of Sberbank branches, which account for over 20% of all credit institution branch-es, declined by 4.2%, owing to branch network optimisation.
The slowing of growth in the total number of credit institution divisions was connected, above all, with
24 Main cash settlement centres, cash settlement centres, divisions, operations departments.
25 Credit institutions and their branches, additional offices, cash and credit offices, operations offices, and cash operations departments outside cash settlement centres.