and Development
Multi-Year
Program Plan
April 2014 (Updated May 2014)Prepared for:
Solid-State Lighting Program
Building Technologies Office
Office of Energy Efficiency and
Renewable Energy
This report was prepared as an account of work sponsored by an agency of the United States Government. Neither the United States Government, nor any agency thereof, nor any of their employees, nor any of their contractors, subcontractors, or their employees, makes any warranty, express or implied, or assumes any legal liability or responsibility for the accuracy, completeness, or usefulness of any information, apparatus, product, or process disclosed, or represents that its use would not infringe privately owned rights. Reference herein to any specific commercial product, process, or service by trade name, trademark, manufacturer, or otherwise, does not necessarily constitute or imply its endorsement, recommendation, or favoring by the United States Government or any agency, contractor, or subcontractor thereof. The views and opinions of authors expressed herein do not necessarily state or reflect those of the United States Government or any agency thereof.
Authors
Norman Bardsley Bardsley Consulting Stephen Bland SB Consulting Lisa Pattison SSLS, Inc. Morgan Pattison SSLS, Inc.
Kelsey Stober Navigant Consulting, Inc. Fred Welsh Radcliffe Advisors, Inc. Mary Yamada Navigant Consulting, Inc.
E X E C U T I V E S U M M A R Y
According to a recent United States (U.S.) Department of Energy (DOE) report, lighting consumed about 18 percent of the total site electricity use in 2010 in the U.S. A second DOE report also finds that by 2025, solid-state lighting (SSL) technology offers the potential to save 217 terawatt-hours (TWh), or about one-third of current site electricity consumption used for lighting in the U.S. This projected savings corresponds to about 2.5 quadrillion British thermal units, of primary energy generation, which is approximately equal to the projected electricity generation of wind power and twelve times that of solar power in 2025. At a price of $0.10/kilowatt-hour, this would correspond to an annual dollar savings of $21.7 billion.
The energy savings projections assume significant progress in the realization of efficient SSL sources, as well as widespread market adoption. Specifically, by 2025, SSL sources would need to realize a luminaire efficacy of 200 lumens per watt (lm/W) and market penetration, in terms of lumen-hours, of about 60 percent to achieve the 217 TWh energy savings potential. These formidable, but achievable, targets require a number of scientific and technical improvements.
During the past year, SSL has shown some very significant advances:
• Adoption of SSL products continues to increase. For 2013, the installed base of light-emitting diodes (LEDs) in the U.S. has increased in all LED applications, more than doubling from 2012 to about 105 million units.
• Correspondingly, the annual energy cost savings from LEDs more than doubled in 2013 from the previous year, increasing to $1.8 billion. That is enough money to pay the annual lighting electricity bill for over 14 million U.S. homes.
• Cree and Philips have both announced the development of luminaire prototypes that have achieved efficacies of 200 lm/W, demonstrating the feasibility of reaching these performance levels.
• LG Chem has commercialized organic light-emitting diode (OLED) panels with efficacy levels of 60 lm/W and a color rendering index of 90.
• Konica Minolta has developed a prototype OLED panel with an efficacy of 131 lm/W and lumen maintenance, L50, of 55,000 hours at 1,000 candelas per square meter for a device with an area of 15 square centimeters. They have also
developed a flexible OLED panel with a thickness of only 70 micrometers. • LED A-lamp pricing continues to decline, with non-dimmable 60W A19
replacement lamps now available for as little as $10 per bulb and dimmable lamps for as little as $13 per bulb. The price drops even further in regions with utility rebates.
• The City of Los Angeles has completed a four-year, citywide street lighting replacement program and has installed over 140,000 LED streetlights. The total installed base of U.S. outdoor area and roadway LEDs exceeds 3.3 million.
DOE's support for SSL is composed of three tightly integrated activities: Competitive Research and Development (R&D), Market-Based Technology Advancement, and Market Engagement.1 The first of these activities supports competitively awarded, cost-shared R&D projects to develop advances in efficacy and performance that might not otherwise happen without DOE funding. Three areas of
1
research are supported: Core Technology Research, Product Development, and Manufacturing R&D.
Core Technology Research projects focus on applied research for technology development, with particular emphasis on meeting efficacy, performance, and cost targets. Product Development projects use knowledge gained from basic or applied research to develop or improve commercially viable materials, devices, or systems. This document, the DOE SSL Multi-Year Program Plan (MYPP), specifically addresses these two areas of research and serves to provide analysis and direction in support of advancing SSL technology. A companion document, the DOE SSL
Manufacturing R&D Roadmap, addresses the third area of research and concentrates on what is needed to assure that high-quality, reduced cost products will be available in quantity and on time to meet rapidly rising demand.
The MYPP is updated annually, reflecting progress towards the goals and the shifting R&D priorities. The document provides a view of the global market for SSL and discusses in detail the barriers to adoption, particularly with regard to associated technology developments. Section 2 reviews applications where SSL is rapidly gaining traction and areas in which LEDs or OLEDs may have particular advantages. One of the greatest of the barriers to adoption is selling price, so the discussion of economic considerations gets special attention. SSL will probably always be more expensive than conventional lighting on a first-cost basis; however, higher operating efficiency and longer operating lifetimes (reduced maintenance/replacement costs) ensure that LED lighting is highly competitive on a life-cycle basis.
Section 3 examines the current state of the art for SSL technology, and includes sections on source efficacy, luminaire performance, and reliability. The various factors affecting source efficacy for LED packages and OLED panels are discussed and likely practical limits are identified. A detailed analysis is presented on the maximum projected source efficacies for warm white and cool white LED packages using a variety of architectures. Possible routes to achieving a goal of 250 lm/W are described and the key technological enablers are identified. An equivalent analysis for OLEDs identifies the various trade-offs that must be made in the design of an OLED panel to meet a goal of 190 lm/W. The incorporation of such components into luminaires involves additional losses and limits the ultimate efficacies achievable for SSL luminaires. These limits are analyzed, discussed, and compared to the state of the art for existing SSL products. From this analysis, we are able to identify the key scientific and technical breakthroughs required and use this information to help prioritize the research actions. Consideration is also given to SSL reliability and lifetime, the relationship between SSL and sustainability, and the status of global SSL R&D.
In Section 4, we derive LED and OLED performance projections, overarching DOE SSL Program milestones, and specific, priority R&D tasks and targets that will contribute to the achievement of the projections and milestones. The priority R&D tasks are identified based on inputs from technology experts and participants at the 2014 DOE SSL R&D Workshop, held from January 28th to 30th in Tampa, Florida. Each task, where possible, includes specific metrics, current status, and goals against which we can track progress. Additionally, projections of progress towards the program efficacy goals are discussed and compared to current performance.
Three Core Technology Research tasks and two Product Development R&D tasks have been identified as priorities for LED lighting, while two Core Technology Research tasks and two Product Development R&D tasks have been identified for OLED lighting. These priorities, listed in the following table, were selected based on written input, discussions during the R&D Workshop, more detailed discussions within a selected focus group, and internal DOE discussions.
LED OLED
Core Technology Research
A.1.2 Emitter Materials Research C.1.2 Stable White Devices A.1.3 Down-Converters
C.6.3 Novel Light Extraction and Utilization A.8.1 Light Quality Research
Product Development
B.6.3 System Reliability and Lifetime D.6.3 Panel Light Extraction B.6.4 Novel LED Luminaire Systems D.4.2 OLED Luminaire
Basic background material on LEDs and OLEDs, definitions of component parts, and information on DOE programs, metrics, and goals can also be found in in the report. Details of the legislation and policies defining the program are not included in this document but links to them may be found on the DOE’s SSL website.1
Multi-Year Program Plan
S O L I D - S T A T E L I G H T I N G R E S E A R C H A N D D E V E L O P M E N T
T A B L E O F C O N T E N T S
1 INTRODUCTION ... 1
2 MARKET AND APPLICATIONS ... 5
2.1 Global Lighting Market... 5
2.1.1 United States ... 7
2.1.2 Asia ... 8
2.1.3 Europe ... 9
2.1.4 Rest of the World ... 11
2.1.5 Summary ... 11
2.2 Applications for Solid-State Lighting ... 12
2.2.1 LED Replacement Lamps ... 14
2.2.2 LED Luminaires ... 14
2.2.3 Outdoor LED Lamps and Luminaires ... 15
2.2.4 OLED Luminaires ... 15
2.2.5 Emerging Applications ... 16
2.3 Economic Considerations ... 17
2.3.1 Cost of Lighting Sources ... 17
2.3.2 LED Package Prices ... 18
2.3.3 LED Lamp and Luminaire Prices... 20
2.3.4 OLED Panel and Luminaire Prices ... 22
2.3.5 Summary ... 23
2.4 Other Barriers to Adoption ... 23
3 TECHNOLOGY STATUS ... 26
3.1 Source Efficacy ... 26
3.1.1 LED Package Efficacy ... 26
3.1.2 OLED Panel Efficacy ... 36
3.2 Luminaire Performance ... 41
3.3 SSL Reliability and Lifetime ... 47
3.4 SSL Sustainability ... 49
3.5 Global R&D Efforts in SSL ... 51
3.5.1 LED-Based SSL Technology ... 51
3.5.2 OLED-Based SSL Technology ... 52
4 RESEARCH AND DEVELOPMENT PLAN ... 55
4.1 Goals and Projections ... 55
4.1.1 Efficacy Projections for LEDs ... 55
4.1.2 Efficacy Projections for OLEDs ... 57
4.2 Milestones and Interim Goals ... 59
4.4 LED Priority R&D Tasks ... 63
4.4.1 LED Core Technology Research Tasks ... 63
4.4.2 LED Product Development Tasks ... 66
4.5 OLED Priority R&D Tasks ... 68
4.5.1 OLED Core Technology Research Tasks ... 68
4.5.2 OLED Product Development Tasks ... 70
4.6 Current SSL Project Portfolio ... 71
5 APPENDICES ... 76
5.1 Program Organization ... 76
5.1.1 DOE Solid-State Lighting Program Goals ... 76
5.1.2 Significant SSL Program Accomplishments to Date ... 77
5.2 Definitions ... 78
5.2.1 Light-Emitting Diodes ... 78
5.2.2 Organic Light-Emitting Diodes ... 81
5.2.3 Summary of LED Applications ... 82
5.3 MYPP Task Structure ... 83
5.4 Patents ... 90
T A B L E O F F I G U R E S
Figure 1.1 2025 Projected Electricity Savings from SSL [3] ... 1
Figure 2.1 Global Commercial Lighting Revenue Forecast, 2013-2020 [23] ... 6
Figure 2.2 Forecast of Shipments of Commercial Lamps and Luminaires, 2013-2020 [23] ... 7
Figure 2.3 U.S. Lighting Inventory, Electricity Consumption, and Lumen Production, 2010 ... 7
Figure 2.4 U.S. Migration Toward Energy-Efficient Light [1] [2] [24] ... 8
Figure 2.5 Market Penetration of LED Lighting in China, 2010-2013 [26] ... 9
Figure 2.6 European Union Tertiary Lighting Stock Light Output, Teralumen-hours/year [27] ... 10
Figure 2.7 U.K. Residential Electricity Demand for Lighting [28] ... 11
Figure 2.8 OLED Panel-based Luminaires Configured as 2-D (left) and 3-D (Right) Light Sculptures ... 16
Figure 2.9 Price-Efficacy Trade-off for LED Packages at 35 A/cm2 and 25°C ... 19
Figure 2.10 A19 Replacement Lamp Price Projection (60W Equivalent; Dimmable) ... 21
Figure 2.11 K-Blade and Bonsai Table Lamps ... 23
Figure 3.1 Typical Simulated Optical Spectra for Each Approach Compared to Black-Body Curve (3000K, 85 CRI, R9>0) ... 28
Figure 3.2 Warm-White pc-LED Package Loss Channels and Efficiencies ... 33
Figure 3.3 Warm-White RGB cm-LED Package Loss Channels and Efficiencies ... 35
Figure 3.4 Emission Spectra from OLED Panels [48] ... 37
Figure 3.5 OLED Panel Loss Channels and Efficiencies ... 41
Figure 3.6 Comparison of SSL and Incumbent Light Source Efficacies ... 42
Figure 3.7 LED Luminaire Efficiency Factors ... 44
Figure 3.8 OLED Luminaires from Acuity, Selux, and Takahata Electronics ... 47
Figure 3.9 Energy Consumption Comparison from DOE LCA Study [54] ... 50
Figure 4.1 White-Light PC-LED Package Efficacy Projections for Commercial Product ... 56
Figure 4.2 White-Light OLED Panel Efficacy Projections ... 58
Figure 4.3 DOE SSL Total Portfolio Summary, April 2014 ... 72
Figure 4.4 Funding of SSL R&D Project Portfolio by Funder, April 2014 ... 73
L I S T O F T A B L E S
Table 2.1 U.S. Installed Base and Energy Savings of LED Lighting by Application [7] ... 13
Table 2.2 Comparison of Typical Market Prices for Various Lighting Sources ... 17
Table 2.3 Summary of LED Package Price and Performance Projections ... 20
Table 2.4 Typical Specifications and Prices for LED-Based Replacement Lamps ... 22
Table 3.1 Estimated Efficacies for aN RGB cm-LED with CCT of 3000K and CRI of 85 (R9>0) ... 29
Table 3.2 Estimated Efficacies for aN RGBA cm-LED with CCT of 3000K and CRI of 85 (R9>0) ... 29
Table 3.3 Estimated Efficacies for a pc-LED with CCT of 3000K and CRI of 85 (R9>0) ... 30
Table 3.4 Estimated Efficacies OF a Hybrid-LED with CCT of 3000K and CRI of 85 (R9>0) ... 31
Table 3.5 Summary of Warm-White pc-LED Package Efficiencies and Efficacies ... 34
Table 3.6 Summary of Warm-White cm-LED Package Efficiencies and Efficacies ... 36
Table 3.7 OLED Laboratory Panels Reported in 2013 and 2014 ... 40
Table 3.8 Components of OLED Panel Efficacy... 40
Table 3.9 SSL Performance Compared to Other Lighting Technologies ... 43
Table 3.10 Breakdown of Warm-White1 LED Luminaire Efficiency Projections ... 45
Table 3.11 Breakdown of OLED Luminaire Efficiency Projections ... 46
Table 4.1 Comparison of Projections for LED Package Efficacy (lm/W) with the Outcome of Analyses Reported in Section 3.1.1 ... 57
Table 4.2 LG Chem Performance Roadmap at 3,000 cd/m2 ... 57
Table 4.3 Progress Projections For OLED Commercial Panel Efficacy (lm/W) ... 59
Table 4.4 LED Package and Luminaire Milestones ... 60
Table 4.5 OLED Panel and Luminaire Milestones ... 61
Table 4.6 Priority R&D Tasks... 63
Table 4.7 Assumptions for Wavelength and Color as Used in the Task Descriptions ... 63
Table 4.8 SSL R&D Portfolio: Core Technology Research Projects, April 2014 ... 74
Table 4.9 SSL R&D Portfolio: Product Development Projects, April 2014 ... 74
1 INTRODUCTION
According to a recent United States (U.S.) Department of Energy (DOE) report, lighting consumed about 18 percent of the total site electricity use in 2010 in the U.S [1]. A second DOE report also finds that by 2025, solid-state lighting (SSL) technology offers the potential to save 217 terawatt-hours (TWh), or about one-third of current site electricity consumption used for lighting in the U.S. This projected savings in site energy consumption would correspond to about 2.5 quadrillion British thermal units (Btus), or “quads”, of primary energy generation, which is approximately equal to the projected electricity generation of wind power and twelve times that of solar power in 2025 (as shown in Figure 1.1). At a price of $0.10/kilowatt-hour, this would correspond to an annual dollar savings of $21.7 billion [2].
FIGURE 1.1 2025 PROJECTED ELECTRICITY SAVINGS FROM SSL [3]
This demonstrates that SSL provides a significant opportunity to reduce energy consumption, thereby improving domestic energy security and reducing greenhouse gas emissions. The U.S. Department of Energy has responded to this opportunity with the formation of the Solid-State Lighting Program.
The energy savings projections assume significant progress in efficient SSL sources, as well as widespread market adoption. Specifically, by 2025, this analysis assumes SSL sources will reach a
By 2025, the goal of the DOE SSL Program is to develop advanced solid-state lighting
technologies that — compared to conventional lighting technologies — are much more energy efficient, longer lasting, and cost competitive by targeting a product system efficiency of 50 percent with lighting that accurately reproduces sunlight spectrum.
100%
2025 Projected Wind Power Electricity Generation
12X
2025 Projected Solar Power Electricity Generation
20 Million
U.S. Household Electricity Use
217 TWh
The 2025 Projected Electricity Savings from Solid-State Lighting
luminaire efficacy of 200 lumens per watt (lm/W) and market penetration, in terms of lumen-hours, of about 60 percent. These are formidable but achievable targets. An analysis of the scientific and technical improvements necessary to achieve the 200 lm/W performance level is provided in Section 3. As we will discuss, significant progress has already been made, and market adoption is rapidly gaining momentum through product cost reductions, quality improvements, and consumer education [4].
The potential benefits described in the previous paragraphs are based on likely developments in inorganic light emitting diode (LED) technology. DOE also supports research and development (R&D) in organic light emitting diode (OLED) technology. While OLED technology is not quite at the level of LED performance or cost-competitiveness, OLEDs offer profoundly different lighting
capabilities that can complement LED sources. OLEDs can be large-area, low-brightness sources that could eventually be produced on large-area flexible sheets at low cost, whereas LEDs are small, high-brightness sources produced by semiconductor manufacturing processes. Analysis of OLED technology also shows a path to high efficacy, approaching that of LEDs. The combination of low-brightness and high-low-brightness sources can enable more effective utilization of light, further improving energy savings by using less light to achieve the target lighting levels (known as light utilization).
This SSL R&D Multi-Year Program Plan (MYPP) strongly emphasizes improving lighting system efficiency, but also addresses other performance requirements that influence market adoption such as product life, color quality, color stability, and electronic control. Technology developments discussed in this document are also expected to be consistent with a path toward lower costs in order to promote higher levels of adoption. In addition, advancements in energy efficiency of the lighting products will also contribute to cost reductions. It has been estimated that one-third of the cost reduction of LED sources is due to improved efficiency, which not only yields more lumens per watt but also, effectively, more lumens per manufactured material or cost.
There are two companion documents to the DOE SSL MYPP. The Market-based Technology Advancement Multi-Year Plan addresses other initiatives to promote adoption such as product quality testing (Caliper), innovative product competitions (Next Generation Luminaires), and deployment activities (Gateway). The DOE SSL Manufacturing Roadmap concentrates on what is needed to assure that high-quality, reduced-cost products will be available in quantity and on time to meet rapidly rising demand [5] [6].
During the past year, SSL has shown some very significant advances:
• Adoption of SSL products continues to increase. For 2013, the installed base of LEDs in the U.S. has increased in all LED applications, more than doubling from 2012 to about 105 million units [7].
• Correspondingly, the annual energy cost savings from LEDs more than doubled in 2013 from the previous year, increasing to $1.8 billion. That is enough money to pay the annual lighting electricity bill for over 14 million U.S. homes [7].
• Cree and Philips have both announced the development of luminaire prototypes that have achieved efficacies of 200 lm/W, demonstrating the feasibility of reaching these performance levels [8] [9].
• LG Chem has commercialized organic light-emitting diode (OLED) panels with efficacy levels of 60 lm/W and color rendering index (CRI) of 90.
• Konica Minolta has developed a prototype OLED panel with an efficacy of 131 lm/W and lumen maintenance, L , of 55,000 hours at 1,000 candelas per square
meter (cd/m2) for a device with an area of 15 square centimeters (cm2). They have also developed a flexible OLED panel with a thickness of only 70 micrometers [10].
• LED A-lamp pricing continues to decline, with non-dimmable, 60W A19
replacement lamps now available for as little as $10 per bulb and dimmable lamps for as little as $13 per bulb. The price drops even further in regions with utility rebates.
• The City of Los Angeles has completed a four-year, citywide street lighting replacement program and has installed over 140,000 LED streetlights. The total installed base of U.S. outdoor area and roadway LEDs exceeds 3.3 million [7].
SSL has progressed rapidly over the past few years to the point that SSL is assumed by many to become the dominant lighting technology by 2025 [2]. However, there are still many technical and market opportunities for reaching the full performance and adoption potential of SSL more rapidly. Some of these opportunities are listed below:
• While LED lights now have a lower cost of ownership in many applications, the first cost of LED lighting discourages adoption. Advancements in more efficient technologies and manufacturing can further reduce the first cost. There is also a corresponding opportunity to educate consumers to look beyond the first cost and consider the full cost of ownership in their purchasing decision.
• Power supply units for OLEDs and LEDs that are small, efficient, and low cost are needed. There is an opportunity to reduce waste, improve recyclability, and upgradability with appropriate designs.
• Uncertainties in product lifetime and reliability are also barriers to adoption. Lumen maintenance of LED-based lighting products is becoming better understood; however, predicting catastrophic failure and unacceptable color shift is still difficult and requires new research and an improved testing and modeling framework.
• LED replacement products for a 100W A19 incandescent lamp are still not widely available. • The development of new lighting form factors beyond replacement lamps and luminaires that
take full advantage of SSL technology has not yet widely occurred. SSL beneficial form factors and systems that take advantage of the inherent controllability of SSL are expected to enable further efficiency, cost, and lighting performance improvements.
• For OLEDs, the development of control over the beam shape would allow one to increase the effectiveness of light delivery and to provide contrasting light levels.
• Next generation lighting opportunities are becoming more abundant and demand for customizable, controllable lighting is increasing.
The MYPP serves to provide analysis and direction in support of advancing SSL technology. The document is organized into the following sections. Section 2 provides a view of the global market for SSL and discusses in detail the barriers to adoption, particularly with regard to associated
technology developments. The section on lighting applications reviews where SSL is rapidly gaining traction and areas in which LEDs or OLEDs may have particular advantages. The greatest of the barriers to adoption is selling price, so the discussion of economic considerations gets special attention. Section 3 delves more deeply into state-of-the-art SSL technology, including sections on source efficacy, luminaire performance, and reliability. It also includes a summary of worldwide R&D efforts.
Section 4 takes a deeper look at the key areas of R&D (referred to as “priority tasks”) that need attention by the community at this time. The tasks2 have been identified, with inputs from technology experts and participants at the 2014 DOE SSL R&D Workshop (hereafter referred to as R&D
Workshop), held this year from January 28th to 30th in Tampa, Florida. Each task, where possible, includes specific metrics, current status, and goals against which we can track progress.
Additionally, projections of progress towards the program efficacy goals are discussed and compared to current performance.
The MYPP is updated annually, reflecting progress towards the goals and the shifting R&D priorities. Basic background material on LEDs and OLEDs and information on DOE programs and goals has been moved to Appendix 5, as have the definitions of component parts and metrics. Details of the legislation and policies defining the program are not included in this document, but may be found elsewhere on the SSL website at www.ssl.energy.gov/about.html and
www.ssl.energy.gov/partnerships.html [11] [12] [13] [14].
2
2 MARKET AND APPLICATIONS
Although still at a very early stage of adoption, SSL accounts for a small but increasing share of the total lighting market. DOE's 2012 study, “Energy Savings Potential of Solid-State Lighting in General Illumination Applications,” suggests that SSL could account for over half of all of the light produced in the U.S. by the year 2025 [2]. Other studies of the global market have reached similar conclusions. This section reviews the market for lighting and SSL, discusses some of the promising applications for SSL, and looks at price trends and barriers to the adoption of LED and OLED technology.
2.1 Global Lighting Market
According to the United Nations Environment Programme, lighting accounted for 15 percent of the total global electricity demand in 2010 [15]. IHS estimates that the global lighting market generates total annual revenue of nearly $100 billion [16]. Rising electricity prices, mounting concerns about climate change, and desire for energy independence are causing the global lighting market to shift toward energy-efficient light sources, including SSL. At this time, the global market for SSL is dominated by LED-based lighting products, while OLED lighting is currently confined to decorative luminaires and custom-built fittings, designed more to enhance the ambiance than to produce light. For this reason, the remainder of this section focuses on LED-based lighting.
Globally, IHS estimates that LED products accounted for 18 percent of lighting revenues in 2013, which corresponds to revenues of $16 billion [17]. When expressed in terms of unit sales, the greatest contribution has come from replacement lamps. Strategies Unlimited estimates that 400 million LED lamps were sold globally in 2013, suggesting that market penetration is about three percent [18]. However, estimates of global sales vary significantly, with some analyses suggesting less, while others suggest the global sale of LED lamps has reached over 800 million units. While there is uncertainty concerning today’s total global unit sales of LED-based lighting products, there is agreement that revenue from LEDs is increasing. The largest global lighting company, Philips, reported that in the fourth quarter of 2013, revenues from LED-based lighting increased by 48 percent and now represents 34 percent of all their lighting sales [19]. Other companies with headquarters in Europe have reported similar results for the same time period, with LED products accounting for 33 percent of total revenues at Osram and 31.5 percent at Zumtobel [20] [21]. Among U.S.-based lighting companies, Cree’s revenue, which is primarily generated through the sale of LED lighting products, rose by 42 percent for the same quarter [22].
This transition to LED lighting is widely predicted to produce an initial increase in global industry revenues, followed by a period of saturation and subsequent decline. However, different analyses assume different time periods and magnitudes for this decline. A recent example from Navigant Research for the commercial lighting sector3 is shown in Figure 2.1.
3
Commercial lighting includes that for office, retail, education, healthcare, hotels/restaurants, institutional/assembly, warehouse, and transport spaces.
FIGURE 2.1 GLOBAL COMMERCIAL LIGHTING REVENUE FORECAST, 2013-2020 [23]
Source:Energy Efficient Lighting for Commercial Markets. Prepared by Navigant Research, 2Q 2013.
Navigant Research forecasts dramatic increases in revenue from global commercial LED sales at the expense of existing lamp technologies through 2019. From 2019 to 2021 there is a slight decrease in LED revenue, and a significant decrease in revenue from the sale of incumbent lighting technologies such as linear fluorescent lamps (including T5, T8, and T12), compact fluorescent lamps (CFL), and high-intensity discharge (HID) lamps. Despite this overall decrease in revenue, Figure 2.2 shows the forecasted unit shipments increasing through 2021, for both LED and
conventional lighting. The decrease in global lighting revenue through 2021 predicted in this model is likely due to an anticipated decrease in SSL product costs, as opposed to a slowdown in unit sales [23]. However, as more longer-lived LED lamps are sold, we can expect an eventual decline in unit lamp sales since the replacement cycle for the lamps will be much longer. Added features of SSL products, such as controllability, color tuning, and smart communications, will likely add value to LED lighting products and further increase LED revenue in the coming years.
FIGURE 2.2 FORECAST OF SHIPMENTS OF COMMERCIAL LAMPS AND LUMINAIRES, 2013-2020 [23] Source:Energy Efficient Lighting for Commercial Markets. Prepared by Navigant Research, 2Q 2013. 2.1.1 United States
Many of the lighting market trends seen on a global scale are similar to those within the U.S.
Growing installations of energy-efficient light sources in the U.S. are evident in a nine percent drop in annual lighting electricity consumption between 2001 and 2010, in spite of an 18 percent growth in number of installed lamps [1]. This growth is occurring in all sectors and applications; however, it is most notable in the residential sector due largely to the migration away from incandescent lighting.
FIGURE 2.3 U.S. LIGHTING INVENTORY, ELECTRICITY CONSUMPTION, AND LUMEN PRODUCTION, 2010 [1] Source:2010 U.S. Lighting Market Characterization. Prepared by Navigant Consulting, Inc., January 2012.
Figure 2.3 shows that although the majority of U.S. lamps are in the residential sector, both light production and energy use are largely influenced by the commercial and outdoor sectors, due to the high output of lighting fixtures coupled with long hours of use [1]. This demonstrates a large potential for energy savings in those sectors, should LEDs displace linear fluorescent and HID lamps.
Residential
Commercial
Industrial
Outdoor
Number of Lamps Energy Use
71%
25%
2%
2%
25%
50%
8%
17%
8%
60%
11%
21% Lumen Production
For 2013, LED penetration in the U.S. installed base was 1.3 percent for indoor and 5.8 percent for outdoor applications. This is described in more detail in Section 2.2. Adoption for indoor applications should increase in 2014, as the ban on 40W and 60W incandescent bulbs takes effect [12]. The trend toward increasing energy efficiency in the U.S. demonstrates that lighting customers are willing to modify their purchasing behavior in the face of compelling economics. The increase in energy-efficient lamps from 2001 to 2010 is illustrated in Figure 2.4 alongside DOE projections for LED penetration in 2030. Overall, DOE projects white-light LED sources to account for 74 percent of lumen-hour sales (roughly 71 percent of unit sales) in the U.S. and save 297 TWh4 in electricity consumption by 2030 [2].
FIGURE 2.4 U.S. MIGRATION TOWARD ENERGY-EFFICIENT LIGHT [1] [2] [24]
2.1.2 Asia
Within Asia, Japan has been a driving force in purchasing LED lighting products, and leads the globe in terms of relative installations, having an estimated LED adoption rate of 15 percent in 2012 and 19 percent in 2013 [25].
Figure 2.5, from the Chinese Solid State Alliance (CSA), shows that adoption is also accelerating very rapidly in China. In 2013, the penetration of LED-based lighting in China was reported to be 8.9 percent of sales and growing rapidly, as government attention shifts from providing monetary
support for investment in capital equipment to providing support for the purchase of lamps and luminaires [26].
4
Savings are estimated over a business-as-usual baseline forecast that represents the market composition in the absence of LED lighting.
0% 10% 20% 30% 40% 50% 60% 70% 80% 90% 100%
2001 2010 2030 2001 2010 2030 2001 2010 2030
In
st
al
led
B
ase
(%
)
Other LED CFL Incandescent
Residential GSL & Reflector Applications
Commercial Linear Fluorescent Applications
Outdoor HID Applications
FIGURE 2.5 MARKET PENETRATION OF LED LIGHTING IN CHINA, 2010-2013 [26]
Source: Industrial Data and Development Overview for China Solid State Lighting 2013. Prepared by Department of Industrial Research, CSA, January 2014.
2.1.3 Europe
Penetration of LEDs in Europe has also been growing rapidly, with estimates of 184 million unit sales in 2013 [25]. Substantial market penetration is now expanding from commercial, industrial, and municipal applications into the residential sector. The lighting stock model developed by the Center for Law and Social Policy (CLASP), an international agency promoting the use of energy-efficient appliances, predicts that by 2030, LEDs will provide two-thirds of all non-residential lighting needs, as shown in Figure 2.6. This means that, although lighting demand is expected to increase, the energy use will decrease by 24 percent, leading to annual savings of up to 53 TWh [27].
0.6% 1.0%
3.3%
8.9%
0.0% 2.0% 4.0% 6.0% 8.0% 10.0%
FIGURE 2.6 EUROPEAN UNION TERTIARY LIGHTING STOCK LIGHT OUTPUT, TERALUMEN-HOURS/YEAR [27]
Source: Estimating Potential Additional Energy Savings from Upcoming Revisions to Existing Regulations under the Ecodesign and Energy Labelling Directives - A Contribution to the Evidence Base. Prepared by CLASP, February 2013.
Note: The tertiary lighting sector refers to street, office, and industrial lighting (fluorescent lamps, HID lamps, and related ballasts and luminaires).
Looking within Europe, Figure 2.7 shows a reduction of about 30 percent in the energy used for residential lighting in the United Kingdom (U.K.) between 2007 and 2011. Increasing adoption of LEDs is expected to result in a further decrease, cutting the annual lighting demand by another 50 percent. Two future scenarios are shown. The “slow” progression assumes that most incandescent lamps will be replaced by halogen lamps until the next stage of European Commission regulation comes into effect in September 2016. The “gone green” scenario shows how the savings are accelerated if residential customers could be encouraged (or required) to switch directly to LEDs [28]. The anticipated rise in energy use after 2020 provides extra incentive for additional
improvements in efficacy and greater adoption of lighting controls in all sectors. 0
5,000 10,000 15,000 20,000 25,000 30,000
2010 2015 2020 2025 2030
T
e
rt
ia
ry
Li
ght
ing D
e
m
a
nd (
T
e
ra
lum
e
n
-h
rs
/y
FIGURE 2.7 U.K. RESIDENTIAL ELECTRICITY DEMAND FOR LIGHTING [28]
Source: UK Future Energy Scenarios: UK gas and electricity transmission. Prepared by UK National Grid, July 2013. 2.1.4 Rest of the World
Reductions in lighting electricity use through SSL adoption are expected to provide substantial relief from the pressure for additional power generation in almost all developed economies. In the rest of the world, the major impact of SSL might be to provide high-quality lighting in communities where lighting has previously been inadequate. For example, over one billion people do not have access to the electricity grid and have to rely on candles and kerosene lamps [29]. The resulting light is
insufficient for the performance of even simple tasks, with typical illuminance levels of 5 lux or less [30]. The use of these light sources is also dangerous due to the risk of fires and toxicity of the fuel, which contains a high proportion of heavy particulates [31]. For off-grid communities, the
development of SSL sources and photovoltaic technology offers a far more affordable solution for electric light sources than developing the grid to deliver electricity.
SSL will allow many countries to provide more adequate lighting with minimal additional energy demand. Nevertheless, the latent demand for good lighting is so great in the developing world that the increased energy consumption may offset energy savings that are made through increased efficacies. In particular, demand for lighting in Africa and certain parts of Asia is likely to increase over the next decade as the economies grow. This scenario provides even greater motivation for the development of higher efficacy SSL sources, the more efficient utilization of light, and the increased adoption of controls to minimize unnecessary light production.
2.1.5 Summary
There is a vast global market for SSL products. Most regions of the world, even with government policy support, still have experienced less than ten percent adoption of LED-based lighting products on a unit basis. Increased adoption driven by scientific and technological improvements represents an enormous energy savings opportunity for the world and an enormous market opportunity for LED lighting manufacturers, and component and materials providers.
0 2 4 6 8 10 12 14 16 18 20
2005 2009 2013 2017 2021 2025 2029 2033
A
nnua
l
Li
ght
D
e
m
a
nd (
TW
h)
Gone Green Slow Historic
2.2 Applications for Solid-State Lighting
In the U.S., today’s LED installed base is over 20 times larger than just three years earlier [7] [32]. While this growth is significant, the performance and quality of modern LED lamps and luminaires has improved even more dramatically. LED-based lighting solutions are constantly evolving and the first iterations of products hardly resemble those on the market today. The rapid innovation of LED technology creates challenges when characterizing the general lighting market; however, DOE makes an effort to profile domestic lighting applications in which LEDs are competitive and well positioned to gain ground against traditional light sources. This analysis is presented in the
“Adoption of Light-Emitting Diodes in Common Lighting Applications: Snapshot of 2013 Trend” [7].5 From 2012 to 2013, it was found that the U.S. installed base of LEDs had increased in all
applications, more than doubling to about 105 million units. As the number of LED installations continues to grow, so does the energy savings. Annual source energy savings from LEDs in 2013 more than doubled from the previous year to 188 TBtu, which is equivalent to an annual energy cost savings of about $1.8 billion.
Although these current savings are significant, LEDs have not even begun to scratch the surface of their potential. Future annual energy savings could approach 4,060 TBtu (4.1 quadrillion Btu or quads), if all current general illumination applications switched to LEDs “overnight.” Energy savings of this magnitude would result in annual energy cost savings of about $39 billion. Table 2.1 below provides a summary of U.S. installations and associated energy savings from this most recent analysis.
5
Previous editions of this report are available on the DOE SSL website under the title “Adoption of Light-Emitting Diodes in Common Lighting Applications” and “Energy Savings Estimates of Light Light-Emitting Diodes in Niche Lighting Applications.”
TABLE 2.1 U.S. INSTALLED BASE AND ENERGY SAVINGS OF LED LIGHTING BY APPLICATION [7] Application1 2013 LED Installed2 Penetration % 2013 LED Units Installed2 Millions 2013 Energy Savings TBtu (TWh) Energy Savings Potential TBtu (TWh)
A-Type 1.1% 34.2 40.5
(3.9)
802 (77.3)
3.4% 33.3 79.7
(7.7)
395 (38.0)
Small Directional 16% 7.5 15.3
(1.5)
71.9 (6.9)
Decorative 0.7% 8.3 2.3
(0.2)
269 (25.9)
Linear Fixture 0.7% 4.9 7.3
(0.7)
1,052 (101)
Industrial 2.1% 1.8 9.2
(0.9)
789 (76.0)
Other3 0.5% 3.8 7.4
(0.7)
178 (17.1)
Total Indoor 1.3% 95.5 162
(15.6)
3,556 (342)
Area/Roadway 7.1% 3.3 13.8
(1.3)
256 (24.7)
Parking Garage 2.4% 0.8 6.5
(0.6)
140 (13.5)
Building Exterior3 7.9% 4.7 5.4
(0.5)
59.3 (5.7)
Other3 2.9% 0.7 1.2
(0.1)
48.6 (4.7)
Total Outdoor 5.8% 9.5 26.9
(2.5)
504 (48.6)
Total All 1.4% 105 188
(18.1)
4,060 (391)
Notes:
1. Descriptions of each application group are provided in Appendix 5.2.3.
2. Installations are the total cumulative number of LED lamps and luminaires that have been installed as of 2013.
3. The “other” and “building exterior” applications were not analyzed in 2012.
OLED technology has yet to gain a measurable share of the general lighting market, but the OLED community is making strides toward commercializing products for certain applications. Most OLED prototypes have yet to attain light output levels suitable for many general lighting applications. Initial products have been largely decorative in nature although some OLED products have been
developed for task lighting applications, such as desk or table lamps and automotive interior lighting. Directional
2.2.1 LED Replacement Lamps
In 2013, replacement lamp applications were responsible for most of the LED lighting market, both domestically and globally [7], with omnidirectional A-type lamps, directional parabolic aluminized reflector (PAR) and multifaceted reflector (MR) lamps comprising the majority of the replacement lamp market.
The 60W-equivalent A-type is the most commonly used lamp in the world. According to IHS, LED-based products are predicted to account for 44 percent of global A-type shipments by 2020 [25], largely driven by lighting efficiency standards and regional regulatory phase-outs, as discussed in Section 2.1. In the U.S., it is estimated that LED A-type lamps accounted for about 33 percent of LED lighting installations in 2013, closely followed by LED reflector lamps at about 21 percent [7]. Compared to the A-type, which produces omnidirectional light, reflector lamps provide directional light and are commonly used in recessed can, accent, retail-display, and track-lighting fixtures. In retail-display applications, LED reflector lamps are already installed on a significant scale, which is evident in the high penetration level and large installed LED lamp base observed in these
applications. In 2013, growth in the retail-display and commercial markets was primarily fueled by the uptake of LEDs in commercial downlighting applications in Europe and, to a lesser extent, the U.S., Japan, and the rest of the world [33]. Global LED reflector lamp shipments were forecasted to surpass shipments of all other reflector lamp technologies by 2017 and climb to 58 percent by 2020 [25]. While LED A-type and reflector lamps represent the majority of LED installations in the U.S., they still represent less than 2 percent of the total installed stock.
As their quality improves and prices continue to drop, LED lamps will penetrate the general lighting market at a faster pace. The increasing adoption of LED lamps, combined with their extended lifetimes, will have a significant impact on regional lighting markets.
2.2.2 LED Luminaires
Luminaires are defined as fully integrated lighting products designed to replace an entire fixture (not just the lamp). An example of an LED luminaire would be a fully integrated 2’ X 2’ troffer
replacement. In many instances, integrated LED luminaires can have superior performance
compared with replacement lamps, since any design constraints imposed by an existing form factor or available space are usually less severe.
Commercial and industrial applications are an important market for LED luminaires as they represent about 30 percent of all lighting installations, but are responsible for well over half of the total
electricity consumption for all lighting in the U.S. Conversely, general service replacement lamp applications represent nearly 70 percent of all installations but are responsible for only slightly over 30 percent of the total lighting energy consumption [1]. This distinction is largely due to the high operating hours and light output of luminaire fixtures. Commercial and industrial lighting applications therefore present a significant opportunity for LED luminaires, with the potential to offer significant energy and life-cycle cost savings beyond that of LED lamps. By 2025, the annual energy savings associated with commercial and industrial luminaires is expected to approach 1.25 quads, based on the assumption that they account for half of the total energy savings of 2.5 quads [7].
LED luminaires are a rapidly growing segment of the overall LED lighting market and are beginning to prove themselves as a good choice for a variety of commercial applications including troffer, panel, suspended, strip, pendant lighting, and industrial low- and high-bay fixtures. Although the installed stock of LED luminaires jumped from an estimated 6.5 million units in 2012 to nearly 20 million units in 2013, they still represent only about one percent of all luminaires installed in U.S.
commercial and industrial applications [7] [32]. Assuming the continued performance improvement and decrease in price, LED luminaires could reach close to 15 percent of the installed stock by 2020 [2].
2.2.3 Outdoor LED Lamps and Luminaires
Outdoor lighting is another rapidly growing sector for LED luminaires, especially in roadway, area, and parking lot applications. LEDs are competitive in these applications because they offer longer lifetimes, energy savings, and better lumen maintenance than incumbent HID technologies. This drastically reduces costly maintenance and repair and gives LED luminaires a competitive life-cycle cost. Navigant Research estimates that the average maintenance cost of LED luminaires in general outdoor lighting applications is less than half that of their HID counterparts. The installed inventory of LED luminaires in highway, road, and parking lot applications in the 2012 world market was around 2.4 percent. Europe, which constitutes nearly 40 percent of the total global street lighting market with around 90 million installations, has currently less than one-half-million LED fixtures installed in this application [34].
In 2013, DOE estimates that LED luminaires in area, roadway, parking, exterior building, and other outdoor applications accounted for roughly 5.8 percent of the U.S. outdoor installed base6 [7]. Growth in LED outdoor lighting has continued, with programs such as Los Angeles’ LED Street Lighting Energy Efficiency Program leading the charge. With over 140,000 LED streetlights installed in the last four years, this effort is one of the largest LED street lighting retrofits undertaken to date [35]. Each year a growing number of U.S. cities undergo major LED retrofit projects – one of the most recent is for the city of Detroit, Michigan which announced its plan in February 2014 to overhaul the city’s entire street lighting system with an installation of over 42,000 LED streetlights [36]. In addition, the DOE SSL GATEWAY program has demonstrated installations of outdoor SSL systems in several areas across the country.7
2.2.4 OLED Luminaires
Although some early proponents of OLED lighting envisaged large luminous areas, such as OLED wallpaper or OLED curtains, OLEDs are now mostly being used in modular form, as arrays of small panels of area 100 cm2 or less. These panels can be configured either in two- or three-dimensional forms, offering light sculptures as a new form of architectural lighting. Figure 2.8 shows two
examples of OLED luminaires, the Acuity Trilia (left) and Lumen Being (right). In the Lumen Being luminaire, the relative intensity of the individual panels can be varied and controlled by gestures or personal devices, such as smart phones.
6
Excludes traffic signal applications.
7
FIGURE 2.8 OLED PANEL-BASED LUMINAIRES CONFIGURED AS 2-D (LEFT) AND 3-D (RIGHT) LIGHT SCULPTURES
Source: Acuity Brands
Currently, OLEDs can be difficult to use as the primary source of lighting in a room due to their limited light output and high cost. Many proponents are recommending their use in wall sconces and task lights, for example in desk lamps or under-cabinet lighting, in conjunction with ambient lighting. The low brightness of OLEDs allows them to be placed close to the task surface without being uncomfortable to the user, and improves light utilization. Methods of shaping the OLED light distribution may be required for efficient light utilization at greater distances.
2.2.5 Emerging Applications
Although SSL products have made meaningful inroads into the existing lighting market, the fundamental technology underlying SSL offers the promise of expanding the total lighting market through new lighting capabilities and controls. SSL is fundamentally fully and instantaneously dimmable (with appropriately designed power supplies). SSL also has the potential for fully
controllable color tuning with the ability to match any desired color point or color quality. These two attributes could enable a vast array of new lighting applications. Some of these new and growing applications for SSL are listed below:
• Spectrally controlled lighting for desired human physiological responses such as lighting to make people more alert or to facilitate sleep
• Spectrally optimized lighting for greenhouse crop growth • Efficient lighting designed for livestock production
• Lighting spectrally tuned for very specific inspection or enhanced visibility functions
In general, these applications use SSL primarily for the productivity enhancement and will leverage the full spectrum “palette” of colors offered by LED sources, the ability to control these sources in real time, and the general cost-effectiveness of using LED lighting. While the DOE SSL Program is focused on providing efficient, low-cost SSL products with excellent lighting performance, these new applications may be harnessed to further accelerate adoption of energy-saving products for general illumination and may provide energy savings and productivity benefits in applications beyond general illumination. A note of caution is warranted for these new applications, as there is a possibility that some claims of enhanced productivity will outstrip the scientific backing for such claims.
2.3 Economic Considerations
An evaluation of the economic benefit associated with the introduction of SSL sources must balance the longer term energy savings with the higher initial price. SSL will probably always be more expensive than conventional lighting on a first-cost basis, but higher operating efficiency and longer operating lifetimes (reduced maintenance/replacement costs) ensure that LED lighting is highly competitive on a life-cycle basis. A life-cycle cost analysis (LCCA) gives the total cost of a lighting system, including all expenses incurred over the life of the system. The payback period is the time it takes the consumer to recover the higher purchase cost of a more energy-efficient product as a result of lower operating costs. In a commercial setting with long hours of daily operation, this payback period might already be as short as one year.8
2.3.1 Cost of Lighting Sources
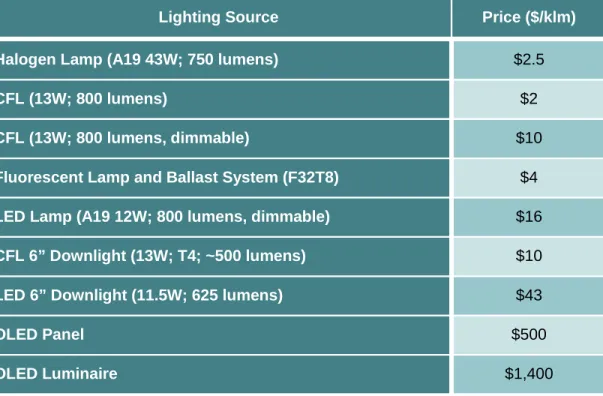
The prices of lighting sources are typically compared on a price per kilolumen ($/klm) basis. The prices for LED-based replacement lamps have dropped considerably over the past few years but remain significantly higher than conventional lighting sources, as shown in Table 2.2.
TABLE 2.2 COMPARISON OF TYPICAL MARKET PRICES FOR VARIOUS LIGHTING SOURCES
Lighting Source Price ($/klm)
Halogen Lamp (A19 43W; 750 lumens) $2.5
CFL (13W; 800 lumens) $2
CFL (13W; 800 lumens, dimmable) $10
Fluorescent Lamp and Ballast System (F32T8) $4 LED Lamp (A19 12W; 800 lumens, dimmable) $16 CFL 6” Downlight (13W; T4; ~500 lumens) $10
LED 6” Downlight (11.5W; 625 lumens) $43
OLED Panel $500
OLED Luminaire $1,400
On a normalized light output basis, an A19 LED lamp is currently around seven times the initial price of a halogen bulb and around 60 percent more than the price of an equivalent dimmable CFL. Nevertheless, on a life-cycle basis, an LED lamp reaches cost parity with a halogen lamp after only 1,700 hours (around 18 months at three hours per day). The availability of utility rebates can reduce
8
For examples, see: www.cree.com/news-and-events/cree-news/press-releases/2012/march/120329-expands-troffer-family and
the price of an A19 LED lamp to as low as $6/klm, creating a 500-hour payback period when compared to a halogen lamp (less than six months at 3 hours per day) and rendering the dimmable CFL largely redundant.
The first OLED products are only now becoming commercially available, and as the table above shows, these products are not yet cost competitive. Although lines designed for volume production are being brought up to full production, yields and throughput are still below planned levels.
2.3.2 LED Package Prices
The price estimates in this section represent typical retail prices for LED packages purchased in quantities of 1,000 from major commercial distributors such as Digi-Key, AVNET, Newport, and Future Electronics. Each LED manufacturer produces a number of variants for each package design covering a range of color temperatures and lumen output levels. The selected data is based on available datasheets and represents devices in the highest flux bins where this is reported (taking the average value within that bin) or typical flux values for the total available distribution. Chosen devices fall within specified ranges of correlated color temperature (CCT), stated in Kelvin (K), and CRI. In all cases, the price, expressed in units of $/klm, and efficacy, expressed in units of lm/W, have been determined at a fixed current density of 35 amperes per square centimeter (A/cm2) and a temperature of 25°C, unless otherwise indicated. Newly introduced packages are generally
measured at 85°C and have been normalized to a temperature of 25°C using data provided by the manufacturers.
FIGURE 2.9 PRICE-EFFICACY TRADE-OFF FOR LED PACKAGES AT 35 A/CM2 AND 25°C
Notes:
1. Cool-white packages assume CCT = 4746-7040K and CRI >70; warm-white packages assume CCT = 2580-3710K and CRI >80.
2. Rectangles represent region mapped by maximum efficacy and lowest price for each time period. 3. The MYPP projections have been included to demonstrate anticipated future trends.
Figure 2.9 charts the evolution of LED package efficacy and price. Each time period is characterized by a rectangle with an area bound by the highest efficacy and lowest price products. Efficacies as high as 159 lm/W (cool white) and 123 lm/W (warm white) have been reported during 2013 as well as prices as low as $5/klm (cool white) and $6/klm (warm white). The MYPP price-efficacy
projections are also included in Figure 2.9 for comparison purposes and are summarized in Table 2.4. The values achieved for efficacy and price are beginning to lag the projections and are not achieved simultaneously for the same device. As expected, higher efficacy products continue to demand higher prices, and lower prices correlate with reduced performance. However, while peak efficacy values have not increased significantly over the past year, prices for the highest performing products have continued to fall, and the spread in efficacy values has narrowed.
$0 $1 $10 $100
0 20 40 60 80 100 120 140 160 180 200 220 240 260
L E D P ackag e P ri ce ($ /kl m ) Efficacy (lm/W) Cool Target Warm Target 2015 2020 2015 Mid 2009 End 2009 Mid 2009 End 2009 2020 End 2010 End 2010 2011 2011 End 2011 End 2011 2013 2013 End 2012 End 2012 2010 End 2013 End 2013 2017 2017
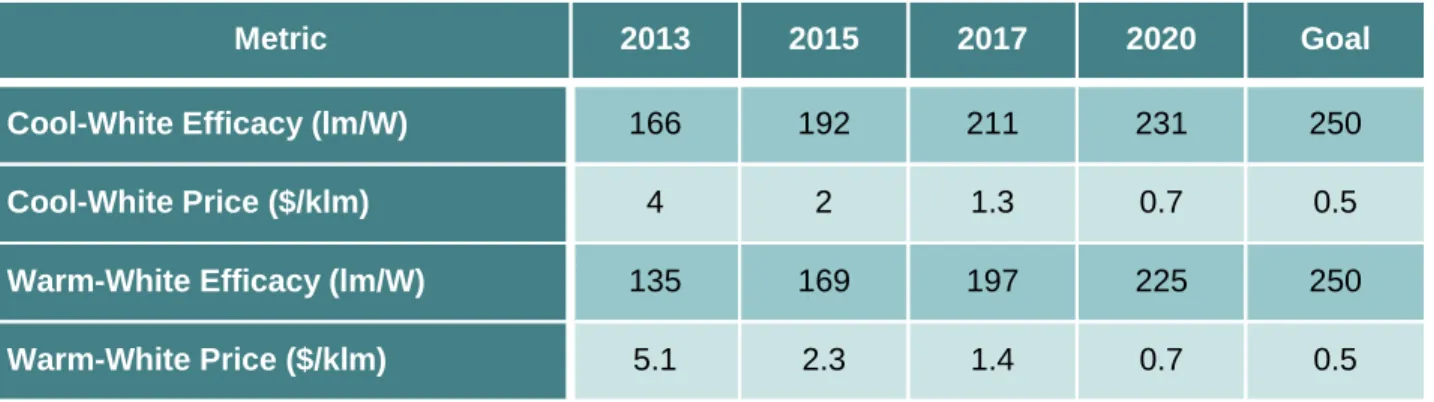
TABLE 2.3 SUMMARY OF LED PACKAGE PRICE AND PERFORMANCE PROJECTIONS
Metric 2013 2015 2017 2020 Goal
Cool-White Efficacy (lm/W) 166 192 211 231 250
Cool-White Price ($/klm) 4 2 1.3 0.7 0.5
Warm-White Efficacy (lm/W) 135 169 197 225 250
Warm-White Price ($/klm) 5.1 2.3 1.4 0.7 0.5
We have chosen to normalize the values used in this and previous reports to a specific current density and operating temperature in order to set projections and track progress. More recently, with the introduction of an ever-widening portfolio of package designs, it has become increasingly difficult to apply this method of normalization. In certain cases, the total die area cannot be accurately determined and in others the required current density cannot be achieved. The definition of a single current density for multi-die packages with mixed die types is problematic. Even where the specified current density can be achieved, it does not always correspond to the optimum operating conditions for that package and often provides a pessimistic indicator of package performance in a real
application. For example, Cree reports an efficacy of 200 lm/W for their MK-R product at 1W and 25°C (6500K). The same package has a normalized efficacy of 149 lm/W. Changing the
measurement conditions also impacts the normalized price. At 200 lm/W the normalized price is $40/klm but drops to $4/klm at 149 lm/W. A new normalization method needs to be introduced to cater to the different package designs and provide realistic real-word performance.
A more useful normalization method might take account of what is important in a real application, which involves a trade-off between lumen output, efficacy, and price. As the die cost has reduced, it has become more cost effective to operate a larger number of LED packages at lower current densities to achieve higher efficacy at the same lumen output. Lower current densities create less heat and allow for simpler and cheaper packaging to be employed. Mid-power LED packages are a good example. A typical 3535 or 5630 package9 costs 10 to 15 cents in modest volumes and produces around 30 lumens at 100 mA (300 mW), yielding an efficacy of 100 lm/W at a price in the $3/klm to $4/klm range.
Ultimately, it might be argued that the die area doesn’t matter, because what is important is the number of lumens emitted from a given package emitting area (lm/mm2), the cost of those lumens (lm/$), and the efficacy (lm/W). Further work is required to identify a suitable normalization
procedure that can be applied across the whole gamut of package types.
2.3.3 LED Lamp and Luminaire Prices
LED lamp and luminaire prices vary widely depending upon the application. To validate the progress on price reductions for LED-based lighting, a comparison of replacement lamps is both practical and appropriate. The most aggressive pricing has been associated with the most popular residential lamps, and consequently we have focused on the dimmable A19 60W-equivalent (800 lm)
9
3535 and 5630 packages are types of mid-power LEDs with package dimensions of 3.5 mm x 3.5 mm and 5.6 mm x 3.0 mm respectively.
replacement lamp for our projections. Figure 2.10 shows how the lowest retail price (neglecting subsidies) has dropped over the past five years and how it compares to a typical conventional 13W CFL. Also included in Figure 2.10 is the current MYPP projection. During 2013 we have continued to see a reduction in prices as manufacturing costs are reduced and competition intensifies. The retail price has dropped to a low of around $13, corresponding to a normalized price of $16/klm, in good agreement with the MYPP projection. Retail prices are projected to fall further during 2014 and approach the $10 range ($12.5/klm), which many believe may be a critical tipping point resulting in widespread adoption of such products in a residential setting. Generous rebates are available from many utilities, which can reduce the retail price to as low as $4.97, or $6/klm, helping to accelerate the adoption of LED-based A19 lamps.
FIGURE 2.10 A19 REPLACEMENT LAMP PRICE PROJECTION (60W EQUIVALENT; DIMMABLE)
Note: The shaded region illustrates the price range for a typical equivalent performance CFL (13W, self-ballasted CFL, non-dimmable at bottom, and dimmable at top).
$1 $10 $100 $1,000
2005 2010 2015 2020 2025
A
19
R
epl
acem
ent
Lam
p P
ri
ce
($/
kl
m
)
Year
Cool White Warm White
Compact Fluorescent Lamp (800 lm, 13W)
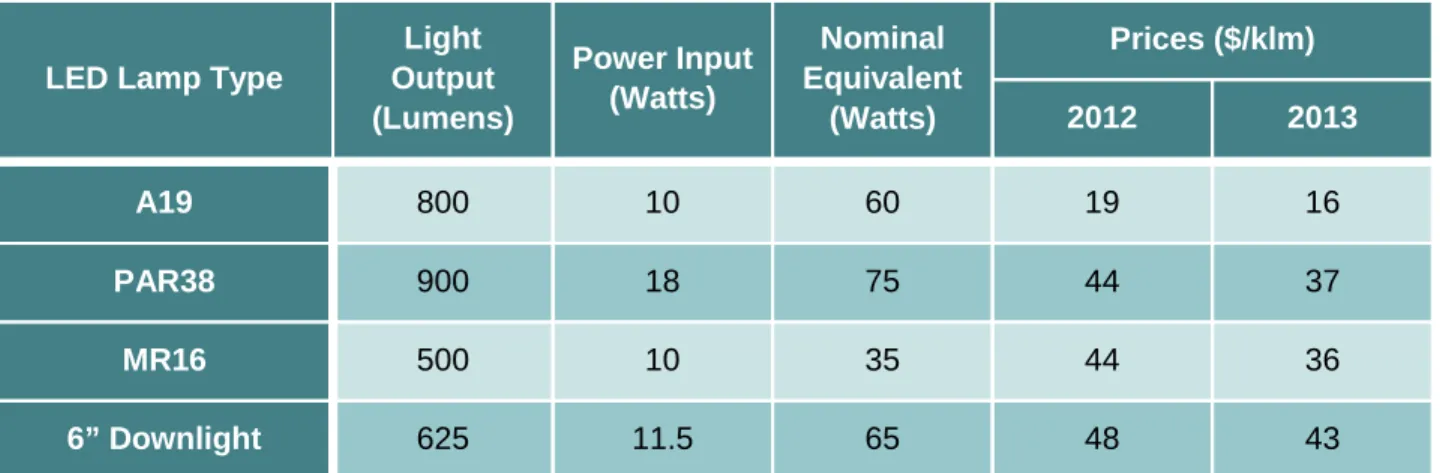
Typical prices for LED replacement lamps over the past two years are summarized in Table 2.5. Prices have continued to fall for each of the lamp types reported in the table, with reductions of between 10 and 20 percent over the last year. For existing product designs, it will become increasingly difficult to achieve further price reductions and new designs are constantly being introduced to realize lower prices while minimizing performance compromises. The energy usage is reduced by around a factor of four for LED-based MR16 and PAR38 lamps and a factor of six for downlights. Reducing energy consumption and/or reducing prices, combined with lifetimes ranging from 25,000 to 50,000 hours, continue to drive down the life-cycle costs and shorten the payback period.
TABLE 2.4 TYPICAL SPECIFICATIONS AND PRICES FOR LED-BASED REPLACEMENT LAMPS
LED Lamp Type
Light Output (Lumens)
Power Input (Watts)
Nominal Equivalent
(Watts)
Prices ($/klm)
2012 2013
A19 800 10 60 19 16
PAR38 900 18 75 44 37
MR16 500 10 35 44 36
6” Downlight 625 11.5 65 48 43
Note: The nominal equivalent (watts) column gives the approximate power consumption for an incandescent source providing an equivalent lumen output.
Outdoor lighting is another area where life-cycle costs are an important consideration. Over the past few years, the base price for LED outdoor fixtures providing around 8,000 to 10,000 lumens (i.e., typical replacements for 150W HPS or 175W MH lamps) has dropped from around $150/klm to around $50/klm, and the efficacy has increased from around 50 lm/W to an average of 80 lm/W [37]. As a specific example, the City of Los Angeles replaced 141,089 streetlights between 2009 and 2013 [38]. Over the course of the program, the average price of each light reduced from $432 to $245, while efficacy improved from 42 lm/W to 81 lm/W. Average energy savings are 63.1 percent and carbon emissions have been reduced by 47,583 metric tons a year. Annual financial savings for the city are in excess of $7 million. The smaller size of the LED sources also led to a significant improvement in the distribution of light and much less emission of light into neighboring houses and into the night sky. The lights are proving to be very reliable. The incidence of early failures was reduced from 10 percent, typical of HID lamps, to 0.3 percent. The lumen depreciation of the LEDs evaluated during trials in 2007 has been less than 13 percent over a six-year period.
Due to the efforts of the Municipal Solid-State Streetlight Consortium, even small municipalities can benefit from the experience gained in large cities such as Los Angeles and can install reliable LED systems with payback periods in the range of five to eight years[39].
2.3.4 OLED Panel and Luminaire Prices
Although samples of OLED panels have been available since 2009, most have been produced on R&D lines and are very expensive on a $/klm basis. Fabrication lines designed specifically for higher volumes have been built by LG Chem and First-O-Lite, and the main R&D lines operated by OSRAM
and Philips have been upgraded to enable commercial production. Prices should drop substantially as these factories move into full production.
The retail prices of luminaires are even higher than for the panels. Decorative luminaires, such as the K-Blade desk light from Riva 1920, which uses a Lumiblade panel from Philips, and the Bonzai from Blackbody, are priced in the range of $3,000/klm to $5,000/klm [40] [41]. More functional luminaires for commercial applications are now priced at around $1,500/klm.
FIGURE 2.11 K-BLADE AND BONSAI TABLE LAMPS Sources: Riva, Black-Body
2.3.5 Summary
Achieving widespread adoption of SSL lamps and luminaires will depend on the ability to
simultaneously satisfy performance and economic requirements. Demonstrating higher efficiency than conventional sources is not enough; the products must also be cost competitive. In this section we illustrate the historical and projected decline in price for LED packages, lamps, and luminaires. On a first-cost basis, LED lamps and luminaires remain more expensive than conventional sources; however, the true economic benefit is only realized when we take account of the reduced operating costs and longer lifetime. A LCCA shows that LED products are becoming increasingly competitive, with payback periods of one year or less in many applications. Conversely, commercial OLED products are in the beginning stages of development and prices remain high; therefore, a LCCA is premature.
2.4 Other Barriers to Adoption
The realization of energy savings from SSL will depend on both source efficacy and market
adoption. While the relatively high price of SSL is the primary barrier to adoption, there are a number of additional considerations and uncertainties that prevent consumers from buying energy-saving lighting products. The barriers described below already apply to LED-based light sources and are
![FIGURE 1.1 2025 PROJECTED ELECTRICITY SAVINGS FROM SSL [3]](https://thumb-us.123doks.com/thumbv2/123dok_us/8439389.2245717/10.918.260.666.340.778/figure-projected-electricity-savings-ssl.webp)
![FIGURE 2.3 U.S. LIGHTING INVENTORY, ELECTRICITY CONSUMPTION, AND LUMEN PRODUCTION, 2010 [1]](https://thumb-us.123doks.com/thumbv2/123dok_us/8439389.2245717/16.918.247.666.682.941/figure-u-lighting-inventory-electricity-consumption-lumen-production.webp)
![FIGURE 2.6 EUROPEAN UNION TERTIARY LIGHTING STOCK LIGHT OUTPUT, TERALUMEN-HOURS/YEAR [27]](https://thumb-us.123doks.com/thumbv2/123dok_us/8439389.2245717/19.918.215.665.112.423/figure-european-union-tertiary-lighting-stock-output-teralumen.webp)
![TABLE 2.1 U.S. INSTALLED BASE AND ENERGY SAVINGS OF LED LIGHTING BY APPLICATION [7] Application 1 2013 LED Installed2 Penetration % 2013 LED Units Installed2Millions 2013 Energy Savings TBtu (TWh) Energy Savings Potential TBtu (TWh) A-Type 1.1% 34](https://thumb-us.123doks.com/thumbv2/123dok_us/8439389.2245717/22.918.128.789.135.816/installed-lighting-application-application-installed-penetration-installed-potential.webp)