THE TOOLBOX REVISITED
Paths to Degree Completion From High School Through College
U.S. Department of Education
Archived Information
THE TOOLBOX REVISITED
Paths to Degree Completion from High School
Through College
Clifford Adelman Senior Research Analyst Policy, Research, and Evaluation Staff Office of Vocational and Adult Education
U.S. Department of Education Margaret Spellings
Secretary
Office of Vocational and Adult Education Beto Gonzalez
Acting Assistant Secretary February 2006
The views expressed herein are those of the author and do not necessarily represent the positions or policies of the U.S. Department of Education. No official endorsement by the U.S.
Department of Education of any product, commodity, service, or enterprise mentioned in this publication is intended or should be inferred. This document is in the public domain.
Authorization to reproduce it in whole or in part is granted. While permission to reprint this publication is not necessary, the citation should be:
Adelman, C. The Toolbox Revisited: Paths to Degree Completion From High School Through College. Washington, D.C.: U.S. Department of Education, 2006.
To order copies of this report,
write to: ED Pubs, Education Publications Center, U.S. Department of Education, P.O. Box 1398, Jessup, MD 20794-1398;
or fax your request to: (301) 470-1244;
or e-mail your request to: [email protected];
or call in your request toll-free: 1-877-433-7827 (1-877-4-ED-PUBS). If 877 service is not yet available in your area, call 1-800-872-5327 (1-800-USA-LEARN). Those who use a
telecommunications device for the deaf (TDD) or a teletypewriter (TTY) should call 1-877-576-7734;
or order online at: www.ed.gov/pubs/edpubs.html.
This report is also available on the Department’s Web site at: www.ed.gov/rschstat/research/pubs/toolboxrevisit/index.html
On request, this publication is available in alternate formats, such as Braille, large print, or computer diskette. For more information, please contact the Department’s Alternative Format Center at (202) 260-0852 or (202) 260-0818.
CONTENTS
List of Tables v
List of Figures xi
Acknowledgments xiii
Executive Summary xv
A Guide for Reading Tables and Terms xxvii
Organization of This Data Essay 1
Part I: Background 3
Part II: Variables Explored and Used in This Analysis 15
Part III: What Is and What Happens Before Matriculation 23
What if we knew nothing except demography? 23
High school background and history 24
Academic intensity of secondary school curriculum 26
Academic resources 35
Step 1: The first logistics 39
Part IV: Matriculation and Beyond: The Features of Postsecondary History 43
Step 2: Matriculation 44
Step 3: First year performance 46
Step 4: Adding financial aid to the question 50
A critical pause for the second calendar year 52
Step 5: Postsecondary attendance patterns 62
Step 6: Extended postsecondary performance 68
Step 7: Final factors 73
Summing up the logistic narrative 76
Summary of Parts III and IV: Investment Behaviors 80
Part V: Closing the Gap 85
Degree completion: How high can it go? 88
Part VI: The Missing Element of This Story 97
Beyond course titles to content standards 97
Part VII: Concluding Messages 103
Reiterations 108
Legacy 109
References 111
Appendix A: Changes in Demography, Geo-Demography, and Postsecondary Entry 123
from the High School & Beyond/Sophomores to the NELS:88/2000 Appendix B: Principal Features of the NCES Grade-cohort Longitudinal Studies 125
Appendix C: Differences Between the High School & Beyond/Sophomore 127
Cohort and NELS:88/2000 High School Record Variables, and Limited Imputation Procedures for the NELS:88/2000 Appendix D: Technical Issues 133
Appendix E: Populations Included and Excluded from the Study Universe 139
Appendix F: Gradations of the Academic Intensity of High School Curriculum 143
Appendix G: Logistic Models for Two Alternative Presentations of High School 147
Background Appendix H: The Timing of Departure 149
Appendix I : Course Categories Included in Aggregates for Participation 155
Rates in the First Two Calendar Academic Years of Attendance Appendix J: Collinearity Statistic (Tolerance) for the Seven Steps of the Logistic 157
Narrative Appendix K: So They Earned a Degree? Now, How Long Did It Take Them? 159
Appendix L: Tables on Miscellaneous Topics Raised in the Text 165
Tables
Table Number Page
Part I: Background
1. From macro to micro: Contraction of the universe of 1988 eighth-graders to the . . . 10 universe subject to analysis in The Toolbox Revisited
2. For each of four definitions of the universe of students in the NELS:88/2000, . . . 12 percentage distribution by gender, race/ethnicity, socioeconomic status quintile,
and second language background
Part III: What Is and What Happens Before Matriculation
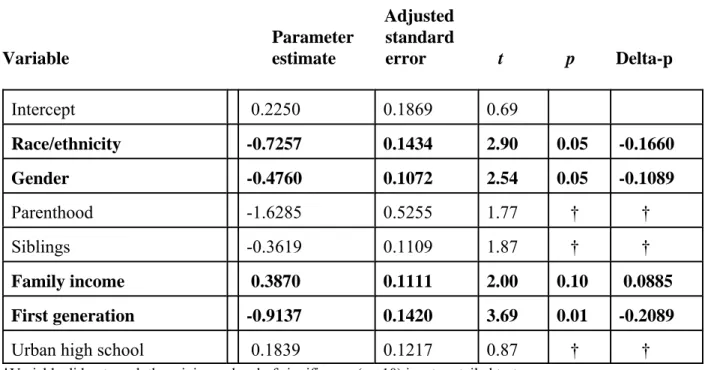
3. Logistic account of the relationships among major demographic variables and . . . 24 bachelor’s degree attainment for 1992 12th-graders who attended a four-year
college at any time
4. Percentage of 1982 and 1992 12th-graders and 1982 and 1992 12th-graders in . . . . . . 29 academic high school programs whose curriculum fell below selected content and
intensity thresholds
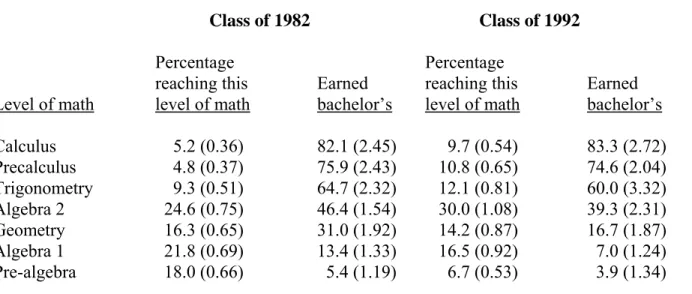
5. Bachelor’s degree attainment rate by highest level of mathematics reached in . . . 31 high school by 1982 and 1992 12th-graders
6. Percentage of 1992 12th-graders who attended high schools that offered courses in . . ..32 statistics, trigonometry, and calculus, by race/ethnicity and socioeconomic status
quintile
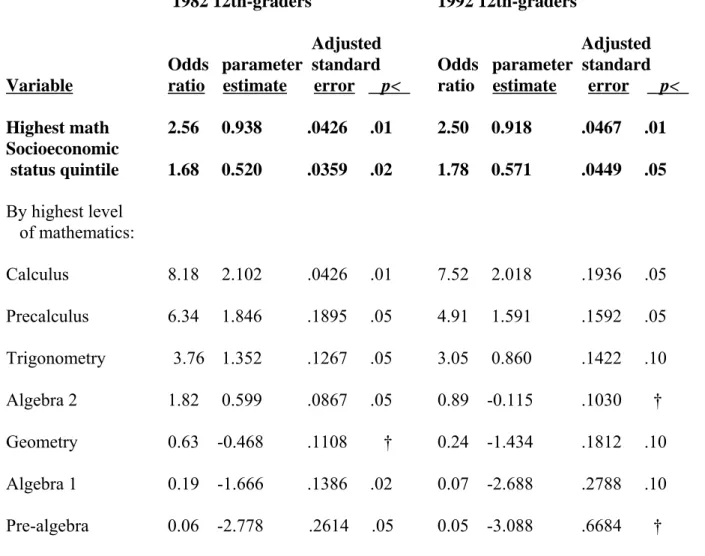
7. The math ladder for 1982 and 1992 12th-graders: Odds ratios and parameter . . . ..33 estimates of earning a bachelor’s degree at each rung, controlling for socioeconomic status quintile
8. Percentage of 1982 and 1992 12th-graders who attended a four-year college at . . . 34 any time, by type and amount of remedial courses taken in postsecondary education 9. Percentage of on-time 1992 high school graduates who continued their education . . . . 36 in any postsecondary institution who earned bachelor’s degrees by December 2000, by quintile performance in the three component variables of Academic Resources
10. Component weights of the high school Academic Resources variable for 1982 . . . 37 12th-graders and 1992 12th-graders who presented positive values for all three
components
11. Correlations of major precollege Academic Resources variables and high. . . . . 38 school graduation status, college entry, and bachelor’s degree attainment by
December 2000 for 1992 12th-graders
12. Logistic account of factors associated with earning a bachelor’s degree in the. . . 41 history of 1992 12th-graders who attended a four-year college at any time—
demographic and high school background, version 1: Using the composite variable for high school Academic Resources
Tables (continued) Page
Part IV. Matriculation and Beyond: The Features of Postsecondary History
13. Logistic account of factors associated with earning a bachelor’s degree . . . 45 in the history of 1992 12th-graders who attended a four-year college at any
time: Postsecondary entry phase
14. Percentage of 1992 12th-graders who earned credits in five categories of . . . 48 college-level mathematics courses in the first calendar year of attendance;
and among non-incidental students, the percentage who ever earned credits in those five categories, by type of institution first attended
15. Logistic account of factors associated with earning a bachelor’s degree in. . . 49 the history of 1992 12th-graders who attended a four-year college at any time:
First postsecondary year performance
16. Logistic account of factors associated with earning a bachelor’s degree in. . . 51 the history of 1992 12th-graders who attended a four-year college at any time:
Postsecondary financing
17. Percentage of 1992 12th-graders with complete postsecondary records who. . . 54 persisted in postsecondary education from their first calendar year of enrollment
to a second calendar year, by type of institution first attended, and, of those who persisted, percentage with lagging first-year performance
18. Of 1992 12th-graders who earned a standard high school diploma by . . . 56 December 1996 and attended a four-year college at any time, credits earned, and
GPA at the end of the second year following initial enrollment in postsecondary education, and extended postsecondary attendance and performance markers, by ultimate bachelor’s degree status
19. Status drop-out rates at the end of the second year following initial enrollment in . . . . 57 postsecondary education of 1992 12th-graders who attended a four-year college at
any time, and allied academic performance data
20. Of 1992 12th-graders who earned a standard high school diploma by . . . 58 December 1996 and attended a four-year college at any time, course participation
rates by the end of the end of the second year following initial enrollment in postsecondary education, by ultimate degree status
21. Of 1992 12th-graders who earned a standard high school diploma by . . . 60 December 1996 and attended a four-year college at any time, participation rates
in lower division course category aggregates and average number of credits earned in each aggregate by the end of the second year following initial enrollment in postsecondary education, by ultimate degree status
22. Relationships of GPA in first year of attendance to number of institutions . . . 63 attended by 1992 12th-graders, by type of first institution attended by 1992
Tables (continued) Page
23. Combinations of institutions attended by 1992 12th-graders who attended a . . . 64 four-year college at any time and who also attended more than one school, and
percentage earning bachelor’s degrees under each combination
24. Logistic account of factors associated with earning a bachelor’s degree in. . . . 66 the history of 1992 12th-graders who attended a four-year college at any time:
Postsecondary attendance patterns
25. Three trends in postsecondary GPA of 1992 12th-graders who attended a . . . 69 four-year college at any time through December 2000 and offered complete
postsecondary records, by GPA at three points in time, average undergraduate time, and percentage earning bachelor’s degree
26. Logistic account of factors associated with earning a bachelor’s degree in. . . 71 the history of 1992 12th-graders who attended a four-year college at any time:
Extended postsecondary performance
27. Logistic account of factors associated with earning a bachelor’s degree in. . . 75 the history of 1992 12th-graders who attended a four-year college at any time:
Final factors, with complete academic history
28. To what extent does the final ratio of undergraduate course withdrawal and . . . 76 no-credit repeat grades reflect the ratio and volume of withdrawal and no-credit
repeat grades in the first calendar year of enrollment? Answers from the history of 1992 12th-graders who attended a four-year college at any time
29. Seven steps of a logistic regression model with bachelor’s degree attainment. . . 78 by age 26 or 27 as the outcome for 1992 12th-graders who attended a four-year
college at any time Part V: Closing the Gap
30. Bachelor’s degree completion rates for students who began in four-year . . . 87 colleges according to three different national longitudinal studies of the 1990s
31. Of 1992 12th-graders who started their postsecondary careers in four-year . . . . 90 colleges, percent who earned bachelor’s degrees by number of credits earned
in summer terms, by race/ethnicity
32. Hypothetical cumulative consequences of variables critical to bachelor’s degree. . . . . 92 completion for 1992 12th-graders who earned a standard high school diploma by
December 1996, attended a four-year college at any time, and whose postsecondary records were complete, by race/ethnicity
33. Percent of credits earned during undergraduate summer terms by African- . . . 94 American 1992 12th-graders in aggregate course categories
34. Hypothetical cumulative consequences of variables critical to bachelor’s . . . 95 degree completion for 1992 12th-graders from the lowest, middle, and highest
socioeconomic status quintiles who earned a standard high school diploma by December 1996, attended a four-year college at any time, and whose postsecondary records were complete
Tables (continued) Page
Appendix A
A1. Contrasts in the percentage distributions of selected demographic backgrounds, . . . . .123 postsecondary plans, and postsecondary entry behavior of 1982 and 1992
12th-graders Appendix C
C1. Unweighted percent of 1982 and 1992 12th-graders missing precollegiate . . . 128 academic performance data.
C2. Differences in ratios of standardized betas for the three components of the. . . 131 Academic Resources composite, before and after limited imputation of
missing class rank/GPA data for 1992 12th-graders
C3. Differences in distribution of 1992 12th-graders across the values of the Academic . . 131 Resources composite variable, before and after limited imputation of missing
class rank/GPA data Appendix E
E1. Percentage distribution of participants in the 1992 survey of the NELS:88/2000. . . . 140 by participation status in The Toolbox Revisited universe, by demographic and
schooling background characteristics Appendix F
F1. Of 1992 12th-graders with complete high school transcripts, mean Carnegie units . . . 145 earned in core high school academic fields, percent of students whose highest level
of high school mathematics was above Algebra 2, and mean number of Advanced Placement (AP) courses, by quintile of academic curriculum intensity
Appendix G
G1. Logistic account of factors associated with earning a bachelor’s degree in the. . . ..147 history of 1992 12th-graders who attended a four-year college at any time,
version 2: Demographic and high school background using the three components of Academic Resources as discrete variables
G2. Logistic account of factors associated with earning a bachelor’s degree in the. . . ..148 history of 1992 12th-graders who attended a four-year college at any time,
version 3: Demographic and high school background using three proxy variables for high school academic curriculum intensity
Tables (continued) Page
Appendix H
H1. Percentage of 1992 12th-graders who entered postsecondary education and . . . ..150 withdrew without completing any credential by December 2000, by timing
of withdrawal and institution of first attendance
H2. Declining "hazard probabilities" for 12th-graders from the High School Class of . . . . 151 1992 who entered postsecondary education, by calendar year following the first
true date of enrollment
H3. Reasons for leaving postsecondary education without credentials by timing of . . . 152 exit: 1992 12th-graders who entered postsecondary education by December 1996
H4. Mean postsecondary GPAs of 1992 12th-graders who withdrew without . . . .154 completing any credential, by timing of withdrawal, and compared with GPAs
of those who had not completed a credential but were still enrolled in 2000, and those who earned bachelor’s degrees by December 2000
Appendix K
K1. Ordinary least squares regression indicating factors influencing time-to-degree . . . . ..162 for 1992 12th graders who earned bachelor’s degrees by December 2000
Appendix L
L1. Percentage of 1988 eighth-graders who graduated from high school, by timing . . . 165 and type of high school diploma (if any), by gender, race/ethnicity and
socioeconomic status quintile
L2. Percentage distribution of high school graduation status, postsecondary . . . ..166 participation and degree completion of students in the1992 NELS:88/2000
survey, by retention-in-grade
L3. Percentage distribution of 1992 12th-graders who entered postsecondary . . . . . 167 education, by selectivity of first institution of attendance, by standard demographics L4. Descriptive relationship of number of credits earned in the first calendar year of . . . . 168
attendance by 1992 12th-graders to highest degree earned by December 2000
L5. Percentage distribution of enrollment intensity over six years (1995/6–2001). . . .169 of students who started out in postsecondary education in 1995/96, by age as of
December 1995
L6. Mean Carnegie unit credits earned in grades 10–12 by (a) all 1992 12th-graders. . . 170 and (b) by those of known socioeconomic status who attended a four-year college
at any time and for whom high school transcript records and senior year test scores were complete
L7. Logistic account of the three components of Academic Resources in relation to . . . 170 bachelor’s degree attainment for all 1992 12th-graders with complete records
Tables (continued) Page
L8a. First season of postsecondary attendance of NELS:88/2000 students . . . 171 (a) who participated in the 1992 NELS survey and (b) who were 12th-graders
in 1992 and subsequently attended a four-year college
L8b. Percentage of two groups of NELS:88/2000 postsecondary students who entered . . . .171 in the fall term: (a) All who participated in the 1992 NELS survey and (b) those
who were 12th-graders in 1992 and subsequently attended a four-year college, by race/ethnicity and socioeconomic status quintile
L9. Percentage of 1992 12th-graders earning credits in college-level math courses, . . . . ..172 both in the first calendar year of attendance and cumulatively, by number of credits earned in college-level mathematics, and type and selectivity of first institution of attendance
L10. Logistic account of factors associated with bachelor’s degree completion for . . . ..173 1992 12th-graders who attended a four-year college at any time using second-year
cumulative credits and second-year cumulative GPA
L11. Institutional attendance patterns of 1982 and 1992 12th-graders who subsequently. . . 174 earned more than 10 postsecondary credits
L12. Percentage distribution of final (December 2000) education status of 1988 . . . 175 eighth -graders, by type and timing of high school diploma (if any), and including
those who did not earn high school diplomas
L13. Mean elapsed time to bachelor’s degree for all 1992 12th-graders who earned. . . 176 the degree by December 2000, by demographic, academic background, and
attendance pattern characteristics Glossary
Glossary-1. Percentage of 1995/96 beginning postsecondary students 20 years old and . . . . .188 younger who attended a four-year college at any time, and received
grants or scholarships in 1995/96, by source and average amount of award, and bachelor’s degree attainment rate by 2001
Figures Page
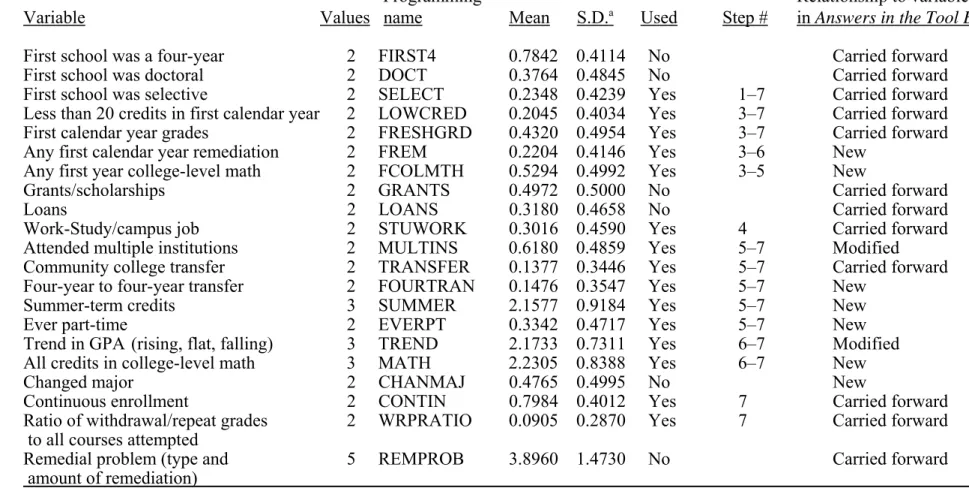
1. Values, means, standard deviations, use of variables considered, and step no., . . . ..20 if used, in the logistic narrative of The Toolbox Revisited, with universe confined to 1992 12th-graders with complete high school records and known socioeconomic status who attended a four-year college at any time through December 2000
2. Examples of credits earned at different institutions by 1992 12th-graders who . . . 82 earned standard high school diplomas by December 1996, attended afour-year
college at some time, earned a bachelor’s degree, and attended three institutions as undergraduates, by type of transfer
3. Curriculum components of the 31 gradations of the high school academic. . . 144 intensity measure of the NELS:88/2000, by Carnegie unit minimums
4. 1991 family income bands used in the NELS:88/2000 in 2005 dollars. . . ..180 5. Comparison of the education anticipations composite variables in the High . . . 182 School & Beyond/Sophomore cohort and the NELS:88/2000: Changes in students’ expectations between grade 10 and grade 12
Acknowledgments
For review of the drafts of The Toolbox Revisited, the author is deeply grateful to Laura Horn of MPR Associates, Alisa Cunningham of the Institute for Higher Education Policy, Rosa Aronson of the National Association of Secondary School Principals, Alberto Cabrera of the University of Wisconsin-Madison, six anonymous external reviewers selected by the Office of Vocational and Adult Education (OVAE) of the U.S. Department of Education, and expresses particular
appreciation for the meticulous review by Paula Knepper of the Department’s National Center for Education Statistics. In the final stages of review and revision, the author is especially appreciative of the efforts and insights of Jeffrey Owings of the National Center for Education Statistics and David Bergeron of the Office of Postsecondary Education, both of the U.S. Department of Education.
While cited in the text, it is appropriate to repeat gratitude for the paths blazed and inspirations offered by Karl Alexander of Johns Hopkins University and Vincent Tinto of Syracuse
University. C. Dennis Carroll and Jeffrey Owings, both of the National Center for Education Statistics, are responsible for the data sets used and the way they are used, and for continued support, encouragement, instruction, and tough oversight. All who invoke these national data treasures owe them.
Colleagues in the Policy, Research, and Evaluation Studies group of OVAE—Braden Goetz, Andrew Abrams, Ricardo Hernandez, and Chief of Staff, Jana Toner—are thanked for their management of the review process for this document, for instructive feedback, and for
shepherding the penultimate drafts of this document through the Department, while Joan Athen made sure that the community college role in the story of the students traced in this document was appropriately highlighted. The final shape of The Toolbox Revisited owes a considerable amount to its ultimate editor, Katherine Devine, and to the support of Jacquelyn Zimmermann, the Department’s Director of Editorial Policy and Publications. For the Web version, the author owes much to the skill and dedication of Carol Bryant.
Executive Summary
The Toolbox Revisited is a data essay that follows a nationally representative cohort of students from high school into postsecondary education, and asks what aspects of their formal schooling contribute to completing a bachelor’s degree by their mid-20s. The universe of students is confined to those who attended a four-year college at any time, thus including students who started out in other types of institutions, particularly community colleges.
The core question, data source, and legacy
The core question is not about basic “access” to higher education. It is not about persistence to the second term or the second year following postsecondary entry. It is about completion of academic credentials—the culmination of opportunity, guidance, choice, effort, and commitment. To answer the question, The Toolbox Revisited uses the most recently completed of the national grade-cohort longitudinal studies conducted by the National Center for Education Statistics. This study, known as the NELS:88/2000, began with a national sample of eighth-graders in 1988. They were scheduled to be in the 12th grade and graduate from high school in 1992. They were followed through December 2000. In addition to regular interviews with these students, the data set on which this essay draws includes the critical components of high school and college transcripts, and the transcript data are the principal sources for the academic history observed.
The Toolbox Revisited was designed as a replication of a noted previous study published by the U.S. Department of Education, Answers in the Tool Box: Academic Intensity, Attendance
Patterns, and Bachelor’s Degree Attainment (1999), hereinafter referred to as "the original Tool Box," which based its analysis on a national cohort of high school students who were scheduled to graduate in 1982, and who were followed through 1993. The question naturally arose as to whether the hypotheses and analyses based on that cohort’s history would hold up in the story of the slightly overlapping 1992–2000 period.
We have learned a great deal in a very short time from numerous initiatives of states and private foundations to prepare high school students better for higher education, and from major federal stimuli under the No Child Left Behind legislation to jump start the process of academic
momentum prior to high school. One of the reasons for examining the academic history of the NELS:88/2000 cohort is that its students attended high school after the wave of reforms in the 1980s that followed the critique of U.S. education offered by the seminal report, A Nation at Risk (1983), and, hence, may provide some clues as to the likely outcomes of current reform efforts. Much has changed in other ways, too, since the High School Class of 1982 (the subjects of the original Tool Box) moved through their scheduled 12th grade and through postsecondary education. A dramatically higher proportion of high school seniors of all race/ethnicity groups continue their education, though access gaps remain (Wirt et al. 2005, indicator 22).
complex, with nearly 60 percent of undergraduates attending more than one institution, and 35 percent of this group crossing state lines in the process; community college transfer rates rising nearly 10 percentage points; one out of eight undergraduates based in four-year institutions using community colleges to fill in pieces of their curriculum, and another eight percent “swirling” back and forth between the four-year and two-year sectors. Dual-enrollment while in high school, credit-by-examination, and use of summer terms all added to the dynamic mix of time and space that marked student pathways in the1990s.
With all this change, we still measure something called “college graduation rates” with
anachronistic formulas that do not track students through increasingly complex paths to degrees. As a result, we do not understand what is really going on. The dominant language
accompanying analyses bemoaning putatively low graduation rates is a language of “attrition,” with students labeled “at risk” or “minimally college-qualified,” and leaking out of “pipelines.” This study looks at student histories derived from transcript records in a different way and with a different tone. It follows the student, not the institution, because it is the student’s success that matters to families—and to the nation. It allows the maximum length of postsecondary time for the High School Class of 1992, 8.5 years, for students to earn degrees no matter how many institutions they attend. It notes that if the history of the Class of 1982 were truncated at 8.5 years, there has been a decent improvement in bachelor’s degree attainment among
non-incidental students (those who earned more than 10 credits, i.e. "made a go of it") who attended a four-year college at any time (from 60 to 66 percent). It is natural to ask how this happened, to identify the moments and aspects of schooling that may have made a difference, and to reflect on what might make the most difference in the future for narrowing degree-completion gaps by race/ethnicity. In that task, The Toolbox Revisited looks for the features of academic history that are realistically subject to change by institutions whose principal business is the generation, preservation, and dissemination of knowledge. While acknowledging that for degree-completion rates to improve, students themselves must respond, and that their response does not occur in a vacuum, the features of student histories that are the domain of this inquiry do not include social and psychological variables attendant on the passage from adolescence to adulthood.
It is important to note that, as was the case for the original Tool Box, the student universe for The Toolbox Revisited constitutes roughly half who reach the 12th grade (table 1). It does not include students who failed to graduate from high school, those who earned General Education Diplomas (GEDs), those who had not enrolled in any postsecondary institution by the age of 26, and those who entered the postsecondary system but never attended a bachelor’s degree-granting institution. The resulting demographics are slightly more female, slightly less minority, less with a second language background, and a higher socioeconomic status distribution than the cohort as a whole (table 2).
Organization
We learned from critiques of the original Tool Box to sort the chronology of events with greater care. There are seven steps in the analysis of The Toolbox Revisited, each of which involves a
1A Carnegie unit is the basic credit system for U.S. secondary schools. It is generally recognized as
representing a full year (36-40 weeks) in a specific class meeting four or five times per week for 40-50 minutes per class session (Martinez and Bray 2002).
collection of variables that are investigated in terms of the degree to which they help us explain bachelor’s degree completion for the population of students under investigation:
Step 1: Demographic background and high school history Step 2: Postsecondary entrance (timing and type of institution)
Step 3: First postsecondary year history (curriculum and performance) Step 4: Factors of financing postsecondary education in the early years Step 5: Postsecondary attendance patterns
Step 6: Extended postsecondary history (curriculum and performance) Step 7: Final model, with complete academic history
This essay also takes an important pause outside the steps of the core statistical model to
consider the characteristics of student progress through the second year following postsecondary entry.
As each step of the statistical model of student history is set forth, it is pointed out where the results are similar to the findings of the original Tool Box with its earlier population, and where they diverge. All seven steps are subsequently assembled together in one place (table 29) so that the reader can observe the factors that have consistently contributed to degree completion.
Principal Stories and Guidance
This executive summary offers themes, highlights, and implications of the data for those who comment on secondary and higher education and make decisions about institutional or system policy—editorial writers, legislators, researchers, education administrators.
Two national longitudinal studies, a decade apart, have told similar stories. When the second story reinforces the first—and sheds even more light—something has to be right, and it behooves us to pay attention. Both of them provide support for current efforts to improve the quality of high school curricula and the participation in those curricula of ever larger proportions of students. Both of them provide guidance for college and community college processes likely to lead students to degree completion.
Some of what was learned from the original Tool Box was taken to heart at the secondary school level, and, in some respects, we are seeing positive results in academic curricular participation in high schools. But counting Carnegie units1 in English or science is not the same as describing and validating what students have learned, and whether that learning links smoothly to the performance expectations of the postsecondary world. The Toolbox Revisited says we have more to do, that the bulk of our task lies both after the college matriculation line, and in
learn what we have to do? By following students in the richness and complexity of their postsecondary histories.
Curriculum, starting in high school, and continuing
However complex students’ attendance patterns, the principal story line leading to degrees is that of content. What one learns is what one studies, and what one brings to economic and
community life. The story starts in high school, but merely crossing the bridge to college or community college doesn’t mean the story is over. Furthermore, the bridge is not always aligned with the road on the other side.
The academic intensity of the student’s high school curriculum still counts more than anything else in precollegiate history in providing momentum toward completing a bachelor’s degree. At the highest level of a 31-level scale describing this academic intensity (see Appendix F), one finds students who, through grade 12 in1992, had accumulated:
3.75 or more Carnegie units of English 3.75 or more Carnegie units of mathematics
highest mathematics of either calculus, precalculus, or trigonometry
2.5 or more Carnegie units of science or more than 2.0 Carnegie units of core laboratory science (biology, chemistry, and physics)
more than 2.0 Carnegie Units of foreign languages
more than 2.0 Carnegie Units of history and social studies 1.0 or more Carnegie Units of computer science
more than one Advanced Placement course no remedial English; no remedial mathematics
These are minimums. In fact, students who reached this level of academic curriculum intensity accumulated much more than these threshold criteria (see table F1), and 95 percent of these students earned bachelor’s degrees (41 also percent earned master’s, first professional, or doctoral degrees) by December 2000.
Provided that high schools offer these courses, students are encouraged or required to take them, and, in the case of electives, students choose to take them, just about everybody could
accumulate this portfolio. Unfortunately, not all high schools present adequate opportunity-to-learn, and some groups of students are excluded more than others. Latino students, for example, are far less likely to attend high schools offering trigonometry (let alone calculus) than white or Asian students. Students from the lowest socioeconomic status (SES) quintile attend high schools that are much less likely to offer any math above Algebra 2 than students in the upper SES quintiles (table 6). If we are going to close gaps in preparation—and ultimate degree attainment—the provision of curriculum issue has to be addressed. In recent years, colleges and community colleges have begun to provide these courses to high school students, and distance learning provides additional options if students have access to the technology. The hypothetical
consequences of participating in curriculum configurations approaching that illustrated above for Latino degree completion rates, in particular, are stunning (table 32).
There is a quantitative theme to the curriculum story that illustrates how students cross the bridge onto and through the postsecondary landscape successfully. The highest level of mathematics reached in high school continues to be a key marker in precollegiate momentum, with the tipping point of momentum toward a bachelor’s degree now firmly above Algebra 2. But in order for that momentum to pay off, earning credits in truly college-level mathematics on the postsecondary side is de rigeur. The world has gone quantitative: business, geography, criminal justice, history, allied health fields—a full range of disciplines and job tasks tells students why math requirements are not just some abstract school exercise. By the end of the second calendar year of enrollment, the gap in credit generation in college-level mathematics between those who eventually earned bachelor’s degrees and those who didn’t is 71 to 38 percent (table 21). In a previous study, the author found the same magnitude of disparity among community college students in relation to earning a terminal associate degree (Adelman 2005a). The math gap is something we definitely have to fix.
A dominant feature of academic histories that cannot really be assessed until the end of the second year following college entry is the extent to which students successfully completed credits in a range of “gateway” courses. It is at this point that the postsecondary curricular story line fully emerges, with ratios of participation in the “gateways” between those who ultimately earned degrees and those who did not running 6:1 in American literature, 4:1 in general
chemistry, and more than 3:1 in precalculus, micro/macroeconomics, introduction to philosophy, and world civilization (table 20). These gaps in curricular participation argue for academic administrators to identify their key gateway courses and regularly monitor participation. College and community college expectations for their first-year students in those gateway courses—expressed through examinations, paper and laboratory assignments—need to be more public. Examples such as those offered by the American Diploma Project in its report, Ready or Not: Creating a High School Diploma That Counts (2004), should be shared with larger
audiences than policymakers and others who habitually read such reports. Parents should see those assignments even if they don’t understand them; high school teachers should ponder them to assess whether their exiting students are likely to be prepared; and, most importantly, high school students have got to see them as road signs to their next education destination. The Tool-box Revisited advocates making these examples part and parcel of admissions packets, publicity brochures, and Web sites. There is risk in this: Some students may be scared away. But there is no better way to enhance articulation and preparedness than to display what students can expect. Postsecondary benchmarks
In both colleges and community colleges, the curriculum story line intersects attendance patterns and performance in ways that set benchmarks for academic advisement and intervention:
! Less than 20 credits by the end of the first calendar year of enrollment (no matter in what term one started, whether summer, fall, winter, spring) is a serious drag on degree completion. The original Tool Box told the same story. It is all the more reason to begin the transition process in high school with expanded dual enrollment programs offering true postsecondary course work so that students enter higher education with a minimum of 6 additive credits to help them cross that 20-credit line. Six is good, 9 is better, and 12 is a guarantee of momentum. ! We falsely believe that beginning students drop out of higher education in
appalling numbers by the end of their scheduled first academic year of attendance. In fact, about 90 percent of traditional-age beginning students turn up somewhere (maybe not at the first school attended) and at some time (maybe not in the fall term) during the subsequent calendar academic year (which we measure as July 1 through June 30). However impressive this percentage, the quality of persistence counts more, and, for a third of these students, the quality of persistence leaves much to be desired (table 17). The Toolbox Revisited urges that institutions monitor and report the quality (as much as the fact) of persistence.
! More than 60 percent of the students in the sample under investigation enrolled during summer terms. Undergraduates are not only more geographically mobile, but have shattered observance of the traditional academic calendar. Summer term credits are more than metaphors for high octane persistence: Earning more than 4 credits during those terms held a consistently positive relationship to degree completion, and gave African-American students, in particular, a significant boost in hypothetical graduation rates (table 32). College and community college administrators can be very creative in expanding the use of summer terms. Student uses of time
The example of summer-term credits, particularly in combination with the complex multi-institutional attendance patterns, underscores another theme of The Toolbox Revisited: Student uses of time in undergraduate careers are now more important than their uses of place. In other words, when students do something academic has a more significant relationship to degree completion than where they do it. For example:
! For the High School Class of 1982 (the subjects of the original Tool Box), timing of entry to postsecondary education never rose to a level of statistical significance in the analysis, whereas variables for the type of institution first entered played inconsistent but positive roles in explaining degree completion. A decade later, with a higher proportion of high school students continuing to college, the
situation was reversed (table 13). What this means is that recruitment efforts have to insure that students enter postsecondary education immediately following high school graduation. The longer students wait, the less likely they will finish a degree.
! The only characteristic of the first institution of attendance to be admitted to statistical analysis was selectivity, but it never rose above the threshold of significance. Quite frankly, one isn’t worried about degree completion for the 5 percent of traditional-age undergraduates who enter highly selective colleges. One is more concerned with the rest of the river—particularly the 78 percent who start in either nonselective four-year colleges or open-door community colleges. ! The original Tool Box study declined to confront part-time status and its effects.
If one is using transcripts as evidence, there are a number of problems in
determining which students are part-time and when. The Toolbox Revisited found a way around these problems to mark whether a student’s enrollment intensity ever fell into part-time status, i.e., less than 12 credits per semester or its
equivalent. Part-time attendance by whatever means, as Carroll (1989) labeled it, proved “hazardous” to degree completion health (table 24; table 29).
! In longitudinal studies extending for as long a period of postsecondary time as does the NELS:88/2000 (8.5 calendar years), a student is allowed stop-out periods totaling one semester or its equivalent (e.g., two quarters), exclusive of summer terms, and still be considered "continuously enrolled." Continuous enrollment is a factor of attendance patterns, and another marker of the student’s use of time. It proves to be overpowering: with 16 other variables in play, continuous enrollment increases the probability of degree completion by 43 percent (table 27). The original Tool Box offered the same message, arguing for assiduous monitoring of student stop-out periods. Put another way: Keep the student continuously
enrolled, even part-time (less damaging than excessive stop-out periods). Purposeful migration versus "swirling"
The complexity of student postsecondary enrollment patterns, already a notable phenomenon for the population under study in the original Tool Box, accelerated in the subsequent cohort. The construction of the NELS:88/2000 postsecondary transcript files took advantage of what we learned from more sophisticated institutional and state system tracking studies of the 1990s; hence, some new attendance pattern variables were available and others (those describing different kinds of multi-institutional attendance) refined.
What we found for the students of the 1992-2000 period was this:
! Formal transfer from a community college to a four-year college and formal transfer from one four-year college to another were positively associated with degree completion, but wandering from one school to another was not. In fact, the nomadic multi-institutional attendance behavior increasingly known as ‘swirling,’ held a significant and negative relationship to degree completion (table 24, table 39). These statements are a very simple untangling of complex realities.
The basic question asked of the transcript data—did a student attend only one school or more than one?—begins a process of inquiry to determine how the student attended second and third institutions. Given very taut definitions of what transfer means, we are advised to ensure that multi-institutional attendance is purposeful and productive. For that, we require much better student tracking systems than we currently possess, and regular contact with students in motion. Student academic performance
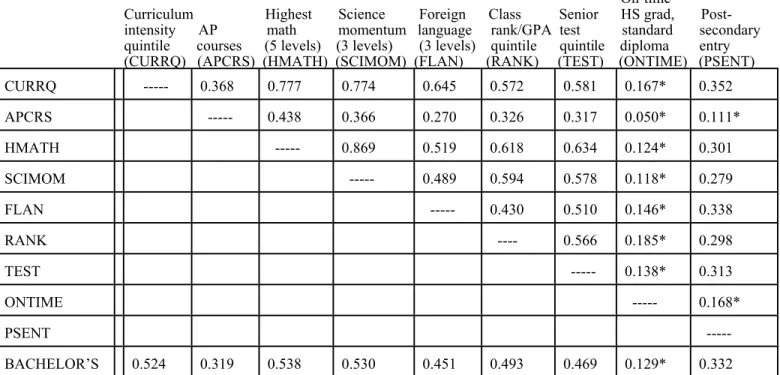
More than the original Tool Box, The Toolbox Revisited recognizes that the path of student academic performance, marked by grades, is a reflection of quality of effort, and pays off. It starts in high school: Academic curriculum participation is still the strongest of the precollegiate momentum indicators, but between the 1980s and 1990s, class rank/GPA moved markedly ahead of senior year test score in its contribution to students’ overall "Academic Resources" index, a composite indicator of high school curriculum intensity, class rank/GPA, and senior year scores on a 90-minute exam best described as a mini, enhanced SAT (see p. 16 and Glossary).
This story continues on the postsecondary side of the matriculation line:
! Earning grades that place one in the top 40 percent of first-year GPA for the whole cohort is a strong—and positive—contributor to academic momentum, and remains in the account of degree completion throughout the histories of both the class of 1982 and the class of 1992 (table 15).
! The theme of quality-of-student-effort, reflected in grades, is strengthened when the canvas covers the student’s entire undergraduate career. In the original Tool Box, the variable describing the trend in students’ GPA had only two reference points: first calendar year and final GPA. For The Toolbox Revisited, there are three such points: first calendar year GPA, cumulative GPA for the first two calendar years, and GPA as of the last date of attendance, whether or not a degree was earned. A rising trend in grades fits with attainment (table 25), contributing positively and significantly (table 26).
A story twice told should be a story to which we listen
Both the original Tool Box and The Toolbox Revisited revealed that one of the most degree-crippling features of undergraduate histories is an excessive volume of courses from which the student withdrew without penalty and those the student repeated. We set this up as a ratio, and marked those who withdrew from or repeated 20 percent or more of their course attempts. Doing so cuts the probability of completing a degree in half (table 27)!
The withdrawals counted here are not “drop” grades that apply during standard drop-and-add periods at the beginning of terms. They are the result of institutional policies that allow
in remedial courses, but when they reach destructive levels the question arises as to how many times an institution allows a student to repeat a course. Think of it this way: Every non-penalty withdrawal and no-credit repeat means that a seat in a course is not available to someone else. Add those seats up, and admission to an institution may not be available to someone else. Excessively lax withdrawal and repeat policy, then, ultimately blocks general access. And in terms of degree completion, such policies do students no favors.
What Does Not Count in The Account of Completion?
! Students’ education “anticipations” (the consistency and level of their vision of how far they will get in school) were not significant at any step of the logistic account for the High School Class of 1992. This is a change from the position of the “anticipations” variable in the original Tool Box, where it ducked in and out of significance. The new message is more clear: Among students who attend a four-year college at some time, expectations are distinctly secondary to one’s uses of academic time and to one’s academic performance.
! Whereas grants and student work-study were modestly significant contributors to degree momentum at early stages of students’ postsecondary careers in the history of the High School Class of 1982, the data on finance mechanisms for the High School Class of 1992 are poor, and the results inconclusive. Analysts are directed instead to the Beginning Postsecondary Students longitudinal studies, which contain detailed financial aid data (but skeletal information on high school histories and postsecondary course work).
! Of student demographic characteristics, only one—socioeconomic status—was significantly associated with degree completion, though in a modest manner. Gender and race/ethnicity were never significant in the logistic narrative, even though some indirect effects of these key demographic characteristics would probably be found in other statistical models. When each race/ethnicity group was treated as an independent variable, the basic story did not change.
! Both a dichotomous variable marking any remedial work in the first calendar year of attendance, and an elaborate variable describing types and extent of
remediation over the course of a student’s entire undergraduate career were employed in the analysis, but to no avail. The same procedure was used in the original Tool Box, where the variables were admitted to the statistical model but did not reach the threshold of significance. Sufficient numbers of students who took remedial classes successfully moved through them so that remediation did not make a strategic difference in degree completion.
! Half of the students in the sample for The Toolbox Revisited who earned bachelor’s degrees changed their major along the way. It was natural to ask whether change-of-major had any influence on degree attainment. It did not,
principally because, with few exceptions, community college transfer students come in to the four-year institution from a general studies program and
automatically are classified as “change-of-major” the minute they enter a specific program at the four-year school.
Students as active, responsible participants
The Toolbox Revisited does not treat students as passive creatures whose fate is wholly molded by schools and colleges. It demonstrates that, within the population of traditional-age students who attend a four-year college at any time (obviously including community college transfers), we can improve graduation rates and close some of the gaps in completion by race/ethnicity and socioeconomic status. But it also argues that there is a limit to what we can realistically do unless students respond to highly targeted advice and prodding.
The analysis of The Toolbox Revisited identifies features of academic history that are most tractable in terms of second party intervention. But there is also something we might dub “first party intervention.” Once the modest echoes of socioeconomic status are accounted for, each step of academic history offers students a set of decisions that require the commitment of time and effort likely to yield the return of earning a degree. Provided there is opportunity, the choices made by students, beginning with high school curriculum and quality of effort in high school, allow subsequent leverage. Entering a postsecondary institution directly from high school, earning 20 or more credits in the first calendar year of enrollment, and performing well enough in that first calendar year to fall in the top 40 percent of a GPA distribution build on previous academic investments, and are all signs of commitment.
Subsequent choices that may not be reflected in a bounded period of time, such as excessive course withdrawals, prove to be poor decisions with negative returns, breaking accumulated momentum. Other configurations of choice, including summer-term credit generation, meeting the challenge of college-level mathematics, effort required to yield a rising GPA, and most of all, remaining continuously enrolled, all reflect continuing leverage of attainment. This is what academic momentum is all about. While these choices do not take place in a social and
psychological vacuum, this is a story about the intersection of student choice with the structures of opportunity offered by institutions whose first order of business is the distribution of
knowledge. It is not a story about growing up, although that happens along the way.
Degree Completion: How High Can We Go? How Much Can the Gaps Be Closed? In Part V of The Toolbox Revisited, three different national longitudinal studies conducted during the 1990s are set side-by-side, so as to demonstrate a remarkable degree of agreement on the rate of bachelor’s degree completion for students who started out in four-year colleges (granted, that is only part of the broader universe addressed in this essay). Looking at the concordance of these three sources (table 30), it is fair to say that:
! A third of traditional-age students who started in a four-year college earned a bachelor’s degree from the same school in the "traditional" four-year period.
! Between 54 and 58 percent earned the degree from the same school in which they began within six years of entry.
! When the option of earning a degree from a different four-year college than the one in which these students commenced study, the six-year completion rates are in the 62–67 percent range.
! Only the NELS:88/2000 extends the time period for earning a degree beyond six years; at 8.5 years, its degree completion rate for students who started in a four-year college approaches 70 percent.
However, it is unfortunate to note that despite increased participation of minority students to postsecondary education over the past quarter century, the gap in bachelor’s degree completion between whites and Asians, on the one hand, and Latinos and African-Americans, on the other, remains wide.
What features of academic history might close the gaps, and by how much?
The data-driven exercise in Part V of The Toolbox Revisited can be characterized as "reasoned speculation." From the NELS:88/2000, we start with a degree completion gap between whites and Asians vis-a-vis African-Americans of 15 percent; and with reference to Latinos, 22 percent. We go back through our analysis and ask what factors:
(a) consistently contributed to bachelor’s degree completion at all stages of the model in which they were "in play," and
(b) were most subject to change by external parties with little-to-modest—but creative— effort that might improve the portrait of degree completion.
Five factors stand out, four of which affect small populations in which minority students are over-represented. Small populations can add up. These factors are:
1. First-year credit generation, i.e., the goal of making sure that postsecondary students end their first calendar year of enrollment with 20 or more additive credits.
2. The problem of excessive no-penalty withdrawals and no-credit repeats, which affect 10 percent of the cohort. Institutional policy and advising can cut the incidence of withdrawals and repeats in half.
3. Use of summer terms. Strategic enrollment management can move more sections of high demand courses into summer terms, offer credit-bearing internships in summer terms, and engage in other creative initiatives that will also smooth out the utilization of institutional resources over what has become an "academic calendar year."
4. No delay of entry. This is a matter of recruitment strategy among high school students whose commitment to postsecondary education is less than fervid. The later they show up, the more their postsecondary fate is in jeopardy.
5. The high school curriculum component of "Academic Resources." This is not a case of "little-to-modest" effort or a small population. It is a megawork in progress, much of which depends on students’ reading skills on entering high school. If students cannot read close to grade level, the biology textbook, the math problems, the history documents, the novel—all will be beyond them. And if high schools are not offering a full academic curriculum, there is little hope. But with those five factors in mind, and assuming full student response and success, potential degree completion rates were hypothesized based on the records of NELS:88/2000 high school graduates by race/ethnicity (table 32) and socioeconomic status quintile (table 34). Virtually every one of these factors contributed to closing degree completion gaps, but none more than high school academic curriculum participation—which, to repeat, is criterion-referenced, hence, open to everyone to rank at or near the top. For African-American students, the combination of moving into the top 40 percent of the high school academic curriculum intensity index plus earning more than four credits during postsecondary summer terms would lower the degree completion gap vis-a-vis white and Asian students from 15 percent to 6 percent. For students from the lowest socioeconomic status quintile, moving into the top 40 percent of the academic curriculum intensity index and entering postsecondary education directly from high school would improve degree completion from 36 to 59 percent. For Latino students, the same steps would improve degree completion from 45 to 69 percent. Does that mean that future degree completion rates will look like those in tables 32 and 34 if everyone meets the criteria on all five counts? No; not everybody will make it. But the tables suggest just where the improvements could be dramatic—and for whom.
Messages to Students and Commentators
Student responsibility (the intersection of choice with opportunity) is a major theme of The Toolbox Revisited in a way that was only implicit in the original Tool Box. The essay concludes with some recommendations for students, who are partners in their own education fate, who shouldn’t wait around for someone else to do something for them, and who are rarely addressed in studies of attainment.
The concluding messages also reflect on the dissonant data of public discourse on high school graduation rates, college attrition rates, and college graduation rates, examples of consequent "scare stories" that do not help us identify and address real problems, and a plea for creativity and cooperation in developing better student tracking systems. These messages also urge a considerable change in the language we use in describing what happens to students from a negative rhetoric that assumes passivity to one that respects students as active players, seeking and discovering paths to their education goals.
2For technical issues concerning standard errors and multiple comparisons, see Appendix D.
A Guide for Reading Tables and Terms
Interchangeable terms
This essay frequently compares the histories of two grade-cohort longitudinal studies carried out by the National Center for Education Statistics (NCES). Each of these studies can be referenced in a number of ways, and all of these references are used.
The following labels for the longitudinal study that began with a national sample of 10th-graders in 1980, the High School and Beyond/Sophomore cohort, are interchangeable:
HS&B/So
High School Class of 1982
class of 1982 (where inter-cohort comparisons of 12th-graders are at issue)
"High School & Beyond/Sophomore cohort" will also be spelled out when the entire longitudinal study, including all its data set components, is the subject.
The following labels for the longitudinal study that began with a national sample of eighth-graders in 1988, the National Education Longitudinal Study of 1988, are interchangeable:
NELS:88/2000
High School Class of 1992
class of 1992 (where inter-cohort comparisons of 12th-graders are at issue) On reading tables in this study, part 1: Descriptive cross-tabulations
All tables in this study are constructed to meet the statistical standards for table presentation of the National Center for Education Statistics (NCES 2002a). They are stand-alone tables, so that if they are reproduced outside the context of the essay, they tell a complete, self-contained story. To ensure a complete story, the descriptive cross-tabulations in this document include the
standard errors of the estimates. The reason for this election—instead of placing tables of standard errors in an appendix—is to enable the reader to judge, on the spot, whether the difference between any two estimates is statistically significant. While the text draws the reader’s attention to statistically significant (and insignificant) estimates important to the narrative, it does not comment on all statistically significant estimates. In general, the formula invoked for statistical significance is the simple student’s t test:
____________ t = (P1 - P2) ÷ % (se12 + se22)
where P1 and P2 are the percentage estimates to be compared and se1 and se2 are the
corresponding standard errors. If t >1.96, one has a statistically significant difference at p < .05 (which means that the probability that this observation would occur by chance is less than 1 in 20), a standard marker. In the case of multiple comparisons, the critical value for t rises.2
Variances in estimates
The reader will often find that estimates for the same phenomenon will differ somewhat, e.g., in one table a bachelor’s degree completion rate is 69.3 percent, in another table, 64.6 percent. These differences are due to the definition of the universe (i.e., who are we counting?) for each table and the weight employed in the calculation.
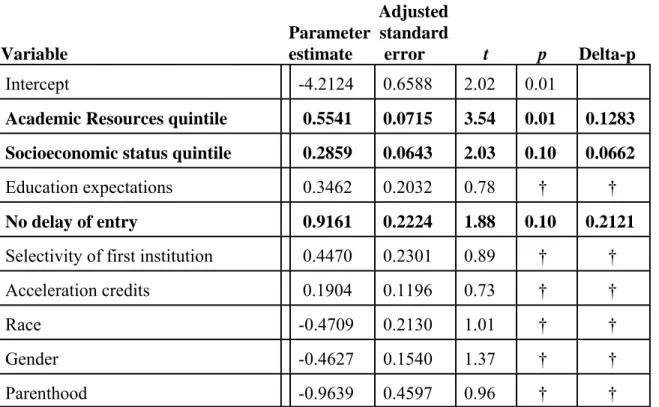
On reading tables in this study, part 2: Logistic models
The core analytic method employed in The Toolbox Revisited is a logistic regression, and there are a baker’s dozen tables in both the text and appendices that present the results of logistic models. There are many ways in which researchers have presented these results (Peng, So, St. John, and Stage 2002), and a number of statistics are employed in these representations. The Toolbox Revisited employs the following for each row of these tables:
The name of the variable—Variable names were created so that the realities to which they refer are self-evident.
The unadjusted parameter estimate—also known as the log odds, or the natural logarithm of the odds of the outcome of interest happening, e.g., whether a bachelor’s degree was earned. The reader should note whether the sign for this estimate indicates a positive or negative relationship to bachelor’s degree completion, as well as the magnitude of the estimate (though that alone does not indicate whether the estimate is significant).
The adjusted standard error of measurement for the estimate—Some researchers will say that this statistic is not necessary. The author provides it because, without it, one could not verify the accuracy of the other statistics on the row. We need the
adjustment because NCES longitudinal studies are based on complex sampling designs. The adjusted standard error is calculated by multiplying the simple standard error by the Root Design Effect for students who offer non-missing values for all variables in the logistic model at issue (see Appendix D). The t statistic—This is the measure that opens the gate to the judgment of degree of significance for the variable in question on that row. Again, some researchers
will say that this statistic is not necessary because in the next column, the p statistic indicating degree of significance is provided. The author offers the t statistic because a minimum t of 0.765 was selected as a threshold for keeping a variable in the sequence of logistic models, and the reader should see those instances where a variable fails to meet that criterion. Why 0.765? In any
statistics textbook, one will find an appendix with a table of relationships between levels of significance (p values) and t-values for two-tailed significance tests according to the number of degrees of freedom (number of variables in a model minus one). If one goes to the column for the lowest level of significance in this standard table (p < .50), and scrolls down to the t-value for the smallest number of
variables used in any of the logistic models in The Toolbox Revisited, three, one will find it equal to 0.765. This is a very generous threshold.
The p statistic—This notation tells us whether the observed relationship would occur by chance, and, if so, at what ratio of chance. A p of <.05 says that the odds of the relationship between independent and dependent variables in that model occurr-ing by chance are less than 1 in 20. This is also known as a 95 percent confidence level. In all of the logistic models in The Toolbox Revisited there are variables that do not meet the t requirements for even a marginal level of significance (p < .10). All variables with a p of <.10 or better are highlighted in bold. Delta-p is the critical statistic for telling the story of the association of the parameter
estimate with degree completion. It says that every unit change in the independent variable changes the probability that X will happen by Y
percent—and the Y is indicated by the Delta-p, e.g., 0.1285 would be translated in the text as 12.9 percent. The statement of change in probability is not a linear statement, and is always the result of relationships among the variables in a particular logistic model. It certainly should not be read as a statement of cause or prediction.
Three decision rules
In indicating whether a variable was used in the logistic models of The Toolbox Revisited, three criteria were observed:
• Any statistical software package (the Statistical Analysis System, or SAS, was used in this report) allows one to set a threshold of statistical significance for a variable to be admitted to a multivariate model. The default threshold is that 95 percent confidence level, represented as p <.05. For both the original Tool Box and The Toolbox Revisited this threshold was changed to a much more generous .2, i.e., the probability that the variable would be admitted by chance is less than 1 in 5. The purpose of the more generous threshold is to allow more variables to "compete," so to speak, within the boundaries of a statistical model, and then to see which variables survive.
• As noted above, the survival indicator in a model was a t value set to 0.765. If a variable failed to exceed that value when utilized in the step of the logistic series in which it was introduced, it was not carried forward to subsequent steps. • Collinearity—Think of the Venn diagrams you learned in high school
mathematics. If each circle in the Venn diagram represents a variable, you don’t want a situation where two or more of them overlap to a point approaching an eclipse, for if they do, analysis of either one is impossible. There are special statistics for determining the extent of collinearity, and these were employed to determine when this situation arose. When it arose, one of the variables had to be dropped. This often happens when one variable is a major component of another, e.g., family income in relation to socioeconomic status. The narrative will
Organization of This Data Essay
The following is a brief outline of The Toolbox Revisited so the reader knows what to expect. Part I: Background. The introduction presents the basic question, the data sets invoked, the purposes and statistics of the investigation, and the demography of the subject universe.
Part II: Variables Explored and Used in This Analysis. This short section of the study lists all the independent variables that were considered and provides brief definitions and basic statistical characteristics. A summary figure (pp. 20–21) indicates which of these met the criteria for inclusion in the logistic narrative of Parts III and IV. A more elaborate glossary
(pp.179–193) provides details on the construction of these variables, allied data and commentary, and will be of particular interest to researchers.
Part III: What Is and What Happens Before Matriculation. Here we begin the chronological narrative, using both descriptive and multivariate data, of what ultimately made a difference in bachelor’s degree attainment by December 2000 for 1992 12th-graders who attended a four-year college at any time. Part III begins with background demographic characteristics, then adds the critical components of high school academic history.
Part IV: Matriculation and Beyond. This section continues the cumulative steps of the logistic narrative, starting with the characteristics of entry to the postsecondary world, and continuing with first calendar year performance, financing considerations, attendance patterns, and extended performance (that is, taking students’ entire undergraduate careers into account). It includes a special consideration for the second calendar year of enrollment and concludes its logistic narrative with attention to two very powerful variables: continuous enrollment and the ratio of course withdrawals and repeats to the number of all courses attempted.
Part V: Closing the Gap. Having demonstrated how the universe of independent variables is related to degree completion, The Toolbox Revisited then asks two questions: (1) To what extent do the major national data sets agree on "graduation rates"? And (2) Given what we have learned about what makes a difference in degree completion, what variables provide the most promising guidance for closing the gap in graduation rates, by race/ethnicity and
socioeconomic status, for students who attend a four-year college at any time?
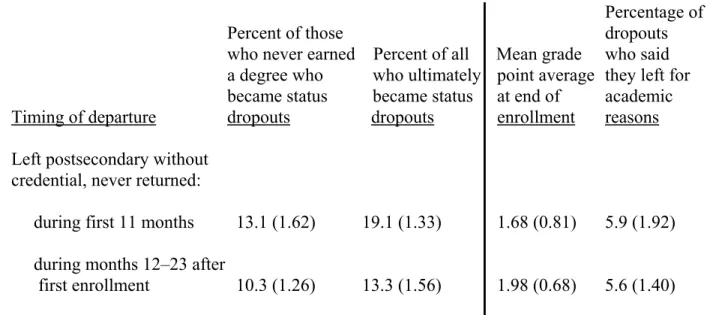
Part VI: The Missing Element of This Story. A key missing part of the story that is a by-product of the limited features of the NELS:88/2000 is addressed in this section: the content standards of high school and postsecondary course work. Other brief "excursions"—timing and reasons for permanent ("status") drop out from college, and time-to-degree—are placed in Appendices H and K respectively.
Part VII: Messages. Finally, The Toolbox Revisited offers some messages—to students and to those who engage in public discourse about the issues we have covered—and highlights the major conclusions of the study.
Appendices: With one exception, appendices are presented in the order in which they are cited in the text. The exception is the last appendix, Appendix L, that contains a variety of reference tables on miscellaneous topics raised in the text.