233
© 2017 by the Serbian Biological Society How to cite this article: Tubić B, Popović N, Raković M, Petrović A, Simić V, Paunović M. Comparison of the effectiveness of kick and sweep hand net and surber net sampling techniques used for collecting aquatic macroinvertebrate samples. Arch Biol Sci. 2017;69(2):233-8.
Comparison of the effectiveness of kick and sweep hand net and Surber net sampling
techniques used for collecting aquatic macroinvertebrate samples
Bojana P. Tubić1,*, Nataša Z. Popović1, Maja J. Raković1, Аna S. Petrović2, Vladica M. Simić2 and Momir M.
Paunović1,#
1University of Belgrade, Institute for Biological Research “Siniša Stanković”, Bulevar despota Stefana 142, 11060 Belgrade,
Serbia
2Institute of Biology and Ecology, Faculty of Science, University of Kragujevac, Radoja Domanovića 12, 34000 Kragujevac
Corresponding authors: *[email protected]; #[email protected]
Received: June 22, 2016; Revised: August 26, 2016; Accepted: September 20, 2016; Published online: September 28, 2016
Abstract: The objective of this work is to analyze the effectiveness of two widely used methods for collecting aquatic mac-roinvertebrate samples: the semiquantitative kick and sweep (K&S) and quantitative Surber net (SN) techniques. Based on our data, the methods were fully comparable as regards analysis of the macroinvertebrate metrics most often used in ecological status assessment (sensitivity/tolerance parameters), while K&S was found to be more successful in the evalua-tion of biodiversity. Thus, both methods could be used for routine monitoring of the status of water bodies, according to the recommendation of the EU Water Framework Directive, while for research, K&S is more advanced. K&S is also more effective timewise for material collecting. SN sampling is a quantitative method and could thus be used in studies of aquatic ecosystem productivity.
Key words: aquatic macroinvertebrates; kick and sweep technique; Surber net technique; sampling efficiency
IntRoduCtIon
Aquatic macroinvertebrates are among the most fre-quently used biological quality elements in the assess-ment of the ecological status of water bodies [1,2] ac-cording to the requirements of the EU Water Frame-work Directive [3]. Selecting an appropriate sampling technique is a prerequisite for effective research and a reliable monitoring of the status of aquatic ecosystems. Sampling success significantly influences the overall results of a study, since it affects the number of spe-cies identified by the investigation, the proportion of different species groups per sample or target location [4–6], as well as proportions of indicator organisms. Thus, our capacity to detect species richness of a target water body or to discover some rare species depends not only on the sampling design, but also on the re-sulting indices which are used to assess water status and that significantly rely on the choice of effective sampling techniques. Limitations in the resources for
monitoring and research (both financial and expert) have made the need for an effective methodology for collecting biological samples all the more important. The effectiveness of macroinvertebrate sampling and standardization of methodology has been extensively studied [7-12], but the issue remains open, especially in respect to some water types, such as large fluvial systems [13]. Sampling technique standardization is also important for studies on the relationship of biota and environmental factors, including analyses of the influence of single and multiple stressors on aquatic macroinvertebrates assemblages [14].
MAteRIAlS And MethodS
Sample collection
The material used in this study was collected in period 2005-2012 in different hilly and mountainous watercourses in Serbia. A total of 40 sites on 17 water-courses was sampled using two sampling techniques in parallel: the semiquantitative K&S technique using a standard hand net with mesh size of 500 µm, and a quantitative sampling using a SN with the same mesh size and 25x25 cm frame. The time needed for sample collection was measured using a stopwatch for 100 sampling occasions (50 for K&S and 50 for SN sam-pling). The K&S sampling technique was used in the shore region up to a 1.5-m water depth following the respective standard [16] and multihabitat procedure. The same sampling effort was made on each sam-pling occasion. About 100 m of the watercourse was taken into consideration for data collecting (visual assessment of dominant bottom substrate, evaluation of mean depth and width of the stream, assessment of shadow coverage, etc.) and sampling. Multihabitat sampling involves the assessment of available habitats within a sampling stretch and collection of material from at least 5% of accessible habitats [17].
Quantitative sampling with SN was done along the same sampling stretch as in the case of K&S. Each sampling occasion involved five subsamples, thereby providing a sample of 5 replicates with a surface area
of 3.125 cm2 (0.3125 m2). Subsamples were collected
from dominant substrate types in order to provide a representative sample for the stretch.
The visual classification of bottom substrate by particle size was performed using the following scale: 1) fine substrate (silt-clay and very fine sand; grains imperceptible by eye; <0.125 mm), 2) fine sand (grains
perceptible by eye; 0.125-0.5 mm), 3) coarse sand (0.5-2 mm), 4) gravel ((0.5-2-16 mm), 5) pebble (16-34 mm), 6) cobble (64-256 mm), and 7) boulder (>256 mm) [18].
data analysis
The initial dataset comprised 400 samples, of which 230 were collected by the K&S technique and 170 by the SN method. To reduce any error that may be caused by analyzing data from different watercourse types, only samples collected from sites with a domination of coarse bottom type – classes 5-7 based on visual bottom sub-strate assessment, were included in the analyses. In such a way, the dataset covered the type group of hilly and mountainous small- to medium-sized streams with a domination of hard bottom substrate – types 3-5 accord-ing to Serbian typology of runnaccord-ing waters. Thus, in the second step of analyses, 243 samples were included (133 collected by K&S and 110 by SN).
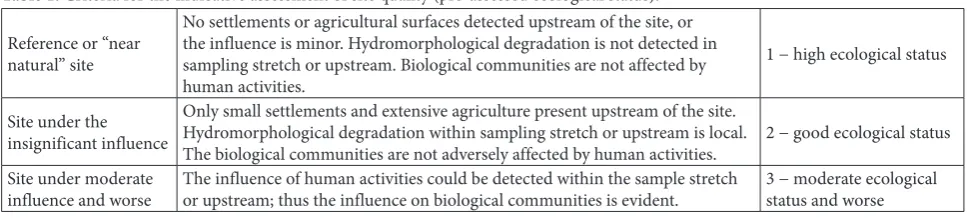
In the next step, out of 243 samples, 93 were se-lected (55 by K&S and 38 by SN) by the elimination of sites exposed to moderate to high anthropogenic pressure, and thus involved only the data from sites that were pre-assessed as possessing a good and bet-ter ecological status. This step was done to minimize the influence of stress factors on output results. Pre-assessment of ecological status (as identified in the EU Water Framework Directive [3]) was done based on previous studies [19], using the criteria described in Table 1.
For comparison of sampling techniques, the following biological metrics were used: 1) relative abundance parameters (total abundance of the com-munity, abundance of principal macroinvertebrate taxa groups, all expressed as number of individuals per sample); 2) diversity parameters (total number of species, genera and families per sample, number
table 1. Criteria for the indicative assessment of site quality (pre-assessed ecological status).
Reference or “near natural” site
No settlements or agricultural surfaces detected upstream of the site, or the influence is minor. Hydromorphological degradation is not detected in sampling stretch or upstream. Biological communities are not affected by human activities.
1 − high ecological status
Site under the insignificant influence
Only small settlements and extensive agriculture present upstream of the site. Hydromorphological degradation within sampling stretch or upstream is local.
The biological communities are not adversely affected by human activities. 2 − good ecological status Site under moderate
of species in principal macroinvertebrate taxa groups, number of Ephemeroptera, Plecoptera and Trichop-tera taxa – EPT Index, Shannon Diversity Index [20]); 3) functional traits (percentage share of functional
feeding groups – concept introduced by Cummins & Klug [21], and participation of taxa with defined saprobic preference); 4) number of sensitive taxa, as well as widely used indices, or tolerance/intolerance table 2. Tested metrics and results of MW-U-Test.
u Z p-level Z p-level
Total Number of ind./sample 5433.50 3.44967 0.00056 3.44974 0.00056
Total Number of Taxa 5889.50 2.61361 0.00896 2.61583 0.00890
Saprobic Index (Zelinka & Marvan) 6936.00 0.694885 0.487128 0.694890 0.487125
% of xenosaprobic taxa 7031.50 0.519788 0.603211 0.526394 0.598615
% of oligosaprobic taxa 7109.50 0.376778 0.706339 0.376801 0.706322
% of beta-mesosaprobic taxa 7254.50 -0.110925 0.911676 -0.110925 0.911676
% of alpha-mesosaprobic taxa 7187.00 0.234684 0.814454 0.234685 0.814453
% of polysaprobic taxa 7045.50 -0.494120 0.621222 -0.541611 0.588087
BMWP Score 6379.50 1.71521 0.086308 1.71536 0.086280
Average score per Taxon 7137.00 0.32636 0.744154 0.32640 0.744125
Simpson Diversity Index 7163.50 0.27777 0.781189 0.27778 0.781184
Shannon Weaver Diversity Index 6679.50 1.16517 0.243951 1.16517 0.243950
Evenness index 6641.50 -1.23484 0.216890 -1.23487 0.216881
No. of sensitive taxa 6555.00 1.39344 0.163489 1.40414 0.160278
% of grazers and scrapers 6522.00 1.45394 0.145964 1.45396 0.145957
% of shredders 6109.00 -2.21116 0.027025 -2.21921 0.026473
% of gatherers and collectors 6490.50 1.51170 0.130612 1.51170 0.130612
% of filtrators 6292.50 1.87472 0.060832 1.87510 0.060779
No. of taxa Turbellaria 7295.00 0.03667 0.970749 0.05703 0.954524
No. of taxa Gastropoda 6817.00 -0.91307 0.361208 -1.07114 0.284107
No. of taxa Bivalvia 6935.00 0.69672 0.485980 1.46294 0.143485
No. of taxa Oligochaeta 7113.00 -0.37036 0.711114 -0.38473 0.700440
No. of taxa Hirudinea 7257.50 -0.10542 0.916039 -0.15631 0.875788
No. of taxa Crustacea 6247.50 1.95723 0.050322 2.24106 0.025023
No. of taxa Ephemeroptera 5275.50 3.73936 0.000185 3.75931 0.000170
No. of taxa Odonata 6609.50 1.29351 0.195835 1.89813 0.057680
No. of taxa Plecoptera 6663.50 -1.19450 0.232281 -1.26036 0.207541
No. of taxa Trichoptera 6910.00 -0.74255 0.457752 -0.75156 0.452315
No. of taxa Coleoptera 6485.00 1.52178 0.128065 1.64457 0.100060
No. of taxa Diptera 5686.00 2.98672 0.002820 3.01517 0.002569
No. of EPT taxa 6541.00 1.41910 0.155869 1.42129 0.155232
No. ind. − Turbellaria 7189.50 0.230100 0.818014 0.356524 0.721448
No. ind. − Gastropoda 6935.50 -0.695801 0.486554 -0.809359 0.418309
No. ind. − Bivalvia 6931.00 0.704052 0.481401 1.477452 0.139556
No. ind. − Oligochaeta 7297.50 0.032086 0.974404 0.032983 0.973689
No. ind. − Hirudinea 7257.50 -0.105424 0.916039 -0.155718 0.876256
No. ind. − Crustacea 6334.00 1.798633 0.072078 2.016751 0.043722
No. ind. − Ephemeroptera 5306.50 3.682522 0.000231 3.689109 0.000225
No. ind. − Odonata 6601.00 1.309097 0.190503 1.916056 0.055359
No. ind. − Plecoptera 7178.50 -0.250269 0.802380 -0.261547 0.793671
No. ind. − Trichoptera 7246.00 -0.126509 0.899329 -0.127121 0.898844
No. ind. − Coleoptera 6352.50 1.764714 0.077613 1.892118 0.058476
No. ind. − Diptera 5626.50 3.095812 0.001963 3.098037 0.001948
Number of Families 6077.50 2.268918 0.023274 2.272.694 0.023045
measures – saprobic index [22], biological monitor-ing workmonitor-ing party (BMWP) score and average score per taxon (ASPT) [23]. The complete list of tested parameters is given in Table 2.
All mentioned parameters were calculated us-ing the ASTERICS Software Version 4.0.4. For the assessment of statistical differences between results obtained by the two sampling techniques, the non-parametric Mann-Whitney U test (MW-U-Test) was used. FLORA Statistical software [24] was used for the data processing.
ReSultS
Of the material collected, 478 species of aquatic mac-roinvertebrates were identified in the investigated hilly and mountainous watercourses. Insects were the most diversified with 343 species belonging to 272 genera and 120 families. Trichoptera, Diptera and Ephem-eroptera were found to be the principal components of macroinvertebrate communities with 92, 82 and 64 species, respectively. The number of species per macroinvertebrate taxa-groups is presented in Table 3.
Among identified species, organisms that indicate oligo- and beta-mesosaprobic conditions prevailed (35.39%), while alpha- and polysaprobic indicators were represented with 11.25%. For more than 50% of organisms, there were no data on saprobic
prefer-ence. In respect to feeding preference, scrapers/graz-ers, collector-gatherers and predators were almost equally represented in the communities, with 21.39, 23.27 and 23.26% of the total number of detected spe-cies, respectively.
All together 45 metrics out of numerous calcula-tions provided by the ASTERICS Software Version 4.0.4 were used for comparison of effectiveness of the two sampling approaches. Based on the MW-U-test results (Table 2), the following metrics showed statistically significant difference (p<0.05) when the two sampling techniques were analyzed: total number of individuals, number of individuals of Crustacea, Ephemeroptera and Diptera, total number of taxa, number of Crustacea, Ephemeroptera and Diptera species, as well as number of families (Fig. 1). In ad-dition, the share of shredders identified by the two table 3. Number of species per macroinvertebrates taxa group.
taxa group no. of species
Turbellaria 7
Nematoda 1
Gastropoda 28
Bivalvia 17
Polychaeta 1
Oligochaeta 53
Hirudinea 10
Crustacea 18
Ephemeroptera 64
Odonata 17
Plecoptera 39
Heteroptera 10
Megaloptera 2
Trichoptera 92
Coleoptera 37
Diptera 82
sampling techniques was significantly different. The other metrics, including the widely used tolerance/ intolerance measures (saprobic index) [22], BMWP score and ASPT [23] did not show differences between the sets of samples. After the reduction of the dataset, when only samples collected from sites that have been pre-assessed as to having high or good status (93 sam-ples; 55 collected by K&S and 38 by SN), we obtained similar results using the MW-U-test for comparison of the effectiveness, with the same set of metrics showing statistically significant difference, as well as number of individuals and number of Coleoptera taxa.
The results of time effectiveness are presented in Table 4. The time needed for the collection of data on the sampling sites (bottom substrate, stream width and depth, the level of hydromorphological degrada-tion, etc.) was not taken into consideradegrada-tion, but only the sampling collection, reduction of sample volume (by elimination of coarse debris), sample packing and fixation. As can be seen from the measurements, SN sampling was much more time-consuming in com-parison to the K&S technique.
dISCuSSIon
The effectiveness of the K&S sampling method is very often underestimated. One of the major short-comings of this approach is that it is often considered as qualitative [8], whereas the technique also allows for a semiquantitative approach (in defined time in-terval, or applying “the same sampling effort”), thus providing the data that are comparable along spatial and temporal gradients. Additionally, the sampling and processing of material collected by K&S are less time consuming in compare to other procedures, e.g. the Polyp grab [4], airlift sampling [25] or a de-tailed AQEM procedure [17]. Our data showed that K&S semiquantitative sampling in more effective in comparison to SN sampling as regards general taxa richness and taxa richness within the principal
com-ponents of the benthic communities in the type of watercourse covered by the study – small- to medium-sized streams with predominantly coarse bottom sub-strate. On the other hand, the metrics widely used for status assessment across Europe [1] belonging to the group of sensitivity/tolerance metrics, did not show significant differences in the resulting values based on the material collected by the two different sam-pling techniques. In that K&S was more effective in detecting the composition of the macroinvertebrate fauna, and that the tested sampling techniques were found to be of the same efficiency in respect to the mentioned metrics, indicates that both techniques are applicable in the routine monitoring of ecologi-cal status, but K&S is a better solution for investigative studies aimed at collecting information on taxa rich-ness. Based on the data presented, the two methods are comparable in respect to sensitivity/tolerance met-rics – e.g. saprobic index [22], BMWP and ASPT [23]. Similar results were obtained by comparing K&S with U-net sampling devices [26], where the methods were found to be similar in the values of benthic metrics and community composition. According to Brua et al. [26], U-shape net sampling provided slightly better data on diversity and thus the authors recommended this technique for biodiversity studies, despite the more time needed to complete sampling. It should be emphasized that K&S is much more efficient timewise than SN sampling, which is reflected in its economic effectiveness.
The advantage of the SN method is that it provides quantitative data, which is important in when dealing with the productivity of aquatic ecosystems, or if the aim of the research is to assess food availability for benthivorous fish, for example.
The selection of the most appropriate method to sample aquatic macroinvertebrates always depends on the particular goals, and there are several unanswered questions in this respect. Our study tried to answer a specific question regarding two widely used sampling methods for collecting appropriate faunistic informa-tion in small hilly water courses around Serbia.
Acknowledgments: This work was supported by the European Communities 7th Framework Program Funding, Grant Agreement No. 603629-ENV-2013-6.2.1-Globaqua.
table 4. Mean collection time for two tested sampling methods. Method Mean time needed for sampling measurementsno. of
K&S sampling 14±5 50
SN sampling
ReFeRenCeS
1. Birk S, Hering D. Direct comparison of assessment methods using benthic macroinvertebrates: A contribution to the EU Water Framework Directive intercalibration exercise. Hydro-biologia. 2006;566(1):401-15.
2. Verdonschot PFM, Nijboer RC. Testing the European stream typology of the Water Framework Directive for macroinver-tebrates. Hydrobiologia. 2004;516(1-3):35-54.
3. EC. Directive 2000/60/EC of the European Parliament and of the Council of 23 October 2000 establishing a framework for Community action in the field of water policy. Official Journal of te European Communities 2000; L327:1-72. 4. Csányi B, Paunović M. The Aquatic Macroinvertebrate
Com-munity of the River Danube between Klostenburg (1942 rkm) and Calafat – Vidin (795 rkm). Acta Biol Debrecina Suppl Oecologica Hungarica. 2006;14:91-106.
5. Rosenberg D, Resh VH. Freshwater biomonitoring and ben-thic macroinvertebrates. New York: Chapman and Hall; 1993. 488 p.
6. Birk S, Bonne W, Borja A, Brucet S, Courrat A, Poikane S, Solimini A, de Bund W, Zampoukas N, Hering D. Three hundred ways to assess Europe’s surface waters: an almost complete overview of biological methods to implement the Water Framework Directive. Ecol Indic. 2012;18:31-41. 7. Buffagni A. A Europe-wide system for assessing the quality of
rivers using macroinvertebrates: The AQEM Project and its importance for southern Europe (with special emphasis on Italy). J Limnol. 2001;60(SUPPL. 1):39-48.
8. García-Criado F, Trigal C. Comparison of several techniques for sampling macroinvertebrates in different habitats of a North Iberian pond. Hydrobiologia. 2005;545(1):103-15. 9. De Pauw N, Roels D, Fontoura AP. Use of artificial
sub-strates for standardized sampling of macroinvertebrates in the assessment of water quality by the Belgian Biotic Index. Hydrobiologia. 1986;133(3):237-58.
10. Resh VH, Norris RH, Barbour MT. Design and implemen-tation of rapid assessment approaches for water resource monitoring using benthic macroinvertebrates. Aust J Ecol. 1995;20:108-21.
11. Birk S, van Kouwen L, Willby N. Harmonising the bioassess-ment of large rivers in the absence of near-natural reference conditions - a case study of the Danube River. Freshw Biol. 2012;57(8):1716-32.
12. Resh VH, McElravy EP. Contemporary quantitative approaches to biomonitoring using benthic macroinverte-brates. In: Rosenberg D, Resh VH. Freshwater biomonitoring and benthic macroinvertebrates. New York: Chapman and Hall; 1993. p. 159-94.
13. Graf W, Csányi B, Leitner P, Paunović M, Huber T, Szekeres J, Nagy C, Borza P. Macroinvertebrates. In: Liška I, Wagner F, Sengl M, Deutch K, Slobodnik J, editors. Joint Danube
Sur-vey 3 A Comprehensive Analysis of Danube Water Quality. Vienna: International Commission for the Protection of the Danube River - ICPDR; 2015. p. 81-99.
14. Navarro-Ortega A, Acuña V, Bellin A, Burek P, Cassiani G, Choukr-Allah R, Dolédec S, Elosegi A, Ferrari F, Ginebreda A, Grathwohl P, Jones C, Rault PK, Kok K, Koundouri P, Lud-wig RP, Merz R, Milacic R, Munoz I, Nikulin G, Paniconi C, Paunović M, Petrović M, Sabater L, Sabaterb S, Skoulikidis NT, Slob A, Teutsch G, Voulvoulis N, Barcelo D. Managing the effects of multiple stressors on aquatic ecosystems under water scarcity. The GLOBAQUA project. Sci Total Environ. 2015;503:3-9.
15. Brumley J, Schuster J, McKone K, Evans R, Arnold M, Keat-ley A, Hicks L, Goodmann P. Methods for Sampling Benthic Macroinvertebrate Communities in Wadeable Waters. Frank-fort, Kentucky; 2015.
16. EN 27828:1994: Water quality - Methods for biological sam-pling - Guidance on hand-net samsam-pling of benthic macro-invertebrates. 1994.
17. AQEM Consortium. Manual for the application of the Aqem system: A comprehenssive method to assess Euro-pean streams using benthic macroinvertebrates, developed for the purpose of the Water Framework. Essen: University Duisburg-Essen, Germany; 2002. 198 p.
18. Verdonschot PFM. Micro-distribution of oligochaetes in as soft-bottomed lowland stream (Elsbeek; The Netherlands). Hydrobiologia. 1999;406:149-63.
19. Paunović M. Structure of macroinvertebrate communities a indicator of running water types in Serbia [dissertatuon]. Belgrade: University of Belgrade, Faculty of Biology; 2007. 20. Shannon CE, Weaver W. The Mathematical Theory of
Com-munication. 10th ed. Urbana: The University of Illinois Press; 1964. 132 p.
21. Cummins KW, Klug MJ. Feeding ecology of stream inverte-brates. Ann Rev Ecol Syst. 1979;10:147-72.
22. Zelinka M, Marvan P. Zur Präzisierung der biologischen Klas-sifikation der Reinheit fließender Gewässer. Arch Hydrobiol. 1961;(57):389-407.
23. Armitage PD, Moss D, Wright JF, Furse MT. The performance of a new biological water quality score system based on mac-roinvertebrates over a wide range of unpolluted running-water sites. Water Res. 1983;17(3):333-47.
24. Karadžić B. FLORA: A Software Package for Statistical Analy-sis of Ecological Data. Water Res Manag. 2013;3(2):45-54. 25. Graf W, Csányi B, Leitner P, Paunovic M, Chiriac G, Stubauer
I, Ofenböck T, Wagner F. Macroinvertebrates. In: Liška I, Wagner F, Slobodník J, editors. Joint Danube Survey 2 Final Scientific Report. Vienna: International Commission for the Protection of the Danube River - ICPDR; 2008. p. 41-53. 26. Brua RB, Culp JM, Benoy GA. Comparison of benthic