Published by Science and Education Publishing DOI:10.12691/ajams-8-3-2
Using Artificial Neural Network to
Predicted Student Satisfaction in E-learning
Dalia Kamal Fathi Alnagar*
1
Statistics Department, University of Tabuk, Tabuk, Ksa 2
Statistics and Econometrics Department, Omdurman Islamic University, Omdurman, Sudan *Corresponding author: Dalia_kk@hotmail.com
Received August 04, 2020; Revised September 05, 2020; Accepted September 14, 2020
Abstract Multi-Layer Perceptron Artificial Neural Network constructed model was established in this study. The
study suggests a model to examines the determining factors of student satisfaction in e-learning and identifying the factors that have an influence on student satisfaction using the artificial neural network for the University of Tabuk student. The study model is conducted using a questionnaire survey of 321participants were studied in the e-learning and predicted student satisfaction in e-learning depended on Instructor attitude and response, e-learning Course flexibility, interaction in the virtual classroom, diversity in assessments, the workshops and explanations prepared by the Deanship of E-Learning helped a student to use e-learning, internet quality and type of course. The model predicted student satisfaction in e-learning per correct classification rate, CCR, of (92.2%). The value of the area under ROC curve (AUC) of the model which was classified as excellent (0.990%). The results show that diversity in assessments strong determinants of learning satisfaction.Keywords
: artificial neural network, student satisfaction, e-learning, correct classification rate, ROC, AUCCite This Article: Dalia Kamal Fathi Alnagar, “Using Artificial Neural Network to Predicted Student
Satisfaction in E-learning.” American Journal of Applied Mathematics and Statistics, vol. 8, no. 3 (2020): 90-95. doi: 10.12691/ajams-8-3-2.1. Introduction
E-learning is the learning style supported by digital technology, commonly indicating to learning via the internet. Recently, e-learning has become a major fact and widely adopted as an encouraging solution by various institutions to offer learning-on-demand chances to students to improve the learning process.
The e-learning idea is understood with several different aspects, like a flexible Internet environment, distributed computing, virtual learning environment and, general distance learning, etc [1].
Many factors, such as the structure, quality of support systems, quality of content, quality of support networks and variety of assessments, and peer support networks, may influence the e-learning experience [2,3,4,5]. Thus, universities and instructors need to consider these factors to provide their students with successful learning. Hence it is essential to examine the determining factors of student satisfaction in e-learning.
Student satisfaction is the significance of the effective implementation and accomplishment of e-learning.
Overall, satisfaction is a factor used to monitoring the product or service quality and also to predict customer happiness or other behavioral consequences. This study is focusing on factors that are in the field of the university
or faculty management and have affected students' satisfaction [6].
In this study, we construct a model able to predict the satisfaction of students using Artificial Neutral Network. Independent variables include instructor attitude and response in a virtual class, E-learning Course flexibility, course type, interaction in virtual, variety in assessment, internet quality, and technology quality. Student satisfaction is discussed as a dependent variable. Seven independent variables are discussed, and supported through literature, for testing each variable associated with the dependent variable, were studied as inputs to construct an Artificial Neural Network (ANN) model capable to predict student satisfaction in terms of student point of view.
2. Goals and Hypothesis
The aim of this study constructed an Artificial Neural Network (ANN) model able to predict student satisfaction in e-learning to investigate the determining factors affecting student satisfaction to increase the level of student’ satisfaction.
Instructor Attitude and Response
Hypothesis 1. Instructor attitude and response will positively influence student satisfaction with e-learning.
Previous research indicated that Instructor attitude and response will positively influence student satisfaction with e-learning [1].
E-learning course flexibility Hypothesis 2. flexibility
ELearning course flexibility will positively influence student satisfaction with e-learning.
Interaction In Virtual Class
Hypothesis3.Interaction in virtual class
Interaction in virtual class will positively influence student satisfaction with e-learning.
Many researchers agree that interactive instructional design is an essential factor for learning satisfaction and success [1].
Workshop and Explanations Introduced
Hypothesis4. Workshop and explanations introduced Workshop and explanations introduced will positively influence student satisfaction with e-learning.
Workshop and explanations n introduced to help student to use technology .
Diversity in Assessments
Hypothesis5. Diversity in Assessments
Diversity in assessments will positively influence student satisfaction with e-learning.
The use of different evaluation methods in e-learning makes students satisfaction in their performance and learning efforts are correctly assessed [1].
Internet Speed
Hypothesis 6.Internet speed
Internet quality will positively influence student satisfaction with e-learning.
Internet speed help students to attend lecture and interaction in a virtual class
E-learning Course Type and quality
Hypothesis 7. E-learning course type will positively influence student satisfaction with e-learning.
type and quality of course content is the vital attribute that leads student’s satisfaction
3. Materials and Methods
The human brain can be formed through a gathering of artificial neurons using a machine learning method define as neural network [7]
Artificial Neural Networks are computing algorithms that can solve complex problems imitating animal brain processes in a basic way [8]. Perceptron-type neural networks depend on artificial neurons or nodes, which are information processing units arranged in layers and interconnected through synaptic weights (connections). Neurons can filter and transmit information in a supervised fashion in terms to construct a predictive model that classifies data stored in memory typical
ANN model is a three-layered network of interconnected nodes:
- the input layer - the hidden layer, - the output layer.
The nodes between input and output layers can form one or more hidden layers. The input layer gets information from the outside world, the hidden layer accomplishes the information processing and the output layer produces the class label or predicts continuous values. The values from the input layer entering a hidden node are multiplied by weights, a set of predetermined numbers, and the products are then added to produce a single number. This number is passed as an argument to a nonlinear mathematical function, the activation function, which returns a number between 0 and 1.
The neural network figure is shown in Figure 1. An Artificial Neural network consists of the following [7].
The net sum of the weighted inputs entering a node j and the output activation function that converts a neuron's weighted input to its output activation (the most commonly used is the sigmoid function) are given by the equations:
n
i i ij i 1
S xw .
=
=
∑
(1)And j si 1 o 1 e = + (2) respectively.
The neuron, and then the ANN, has two modes of operation, the training mode, and the using mode. In the training phase, a data set with actual inputs and outputs will be used to learn the system on how to predict outputs. This supervised learning begins with random weights and, by using gradient descent search algorithms like Back propagation, adjusts the weights to be applied to the task at hand. The difference between target output values and obtained values is used in the error function to drive learning [9]. The error function depends on the weights, which need to be modified to minimize the error For a given training set
(
) (
) (
)
{
x , t1 1 , x , t2 2 ,.., x , tk k}
consisting of k ordered pairs of n inputs and m dimensional vectors (n-inputs, m-outputs), which are called the input and output patterns, the error for the output of each neuron can be defined by the equation
(
)
2j j j
1
E o t
2
= − (3)
while the error function of the network that must be minimized is given by
(
)
k 2
j j j
j 1
1
E o t
2 =
=
∑
− (4)where oj is the output produced when the input pattern, xj from the training set enters the network, and tj is the target value [9]. During the training mode, each weight is changed adding to its previous value the quantity
where γ is a constant that gives the learning rate. The higher the learning rate, the faster the convergent will be, but the searching path may be trapped around the optimal solution and convergence become impossible. Once a set of good weights have been found, the neural network model can take another dataset with unknown output values and predict automatic the corresponding outputs [12].
Artificial neural networks (ANNs) are one of the strongest modeling applications that were used in modeling within statistical techniques [13]
4. Data Description
The data for this study was gathered during the second semester 2019 - 2020 academic year at the University of Tabuk in Ksa. 321 students enrolled in the faculty of science were randomly selected were studied in the Blackboard system.
Blackboard is a virtual learning environment and learning management system that keeps records, reports, or any accomplishments of various user activities
In this study, questionnaire items were constructed on the previous research. There are 7 Variables used to construct the ANN. Used a 5 Likert scale ranging from 1 as strongly disagree to 5 as strongly agree is used for the weight
1. E-learning Course flexibility. 2. Instructor attitude and response 3. Interaction in virtual classroom 4. Diversity in assessment
5. Workshop and explanations introduced (Technology quality)
6. Internet speed
7.Type of learning course Dependent variable:
Student satisfaction discusses as a binary dependent variable takes values: 0 and 1. The value 0 shows Independent variables unsatisfied, while the value 1 displays that the student satisfied.
5. ANN Design and Setup
Multi-layer Perceptions (MLPs) are layered feed-forward networks typically trained with static back propagation. These networks have found their way into uncountable applications demanding static pattern classification [15].
The (MLPs) Module of IBM SPSS Statistics 25 was used to build the neural network model and test its accuracy. MLP neural networks, trained with a back-propagation learning algorithm which uses the gradient descent to update the weights towards minimizing the error function
The data were arbitrarily assigned to training (60%), testing (20%), and holdout (20%) subsets. The training dataset is used to find the weights and construct the model. The testing data is used to find errors and prevent overtraining during the training mode. The holdout data is used to validate the model [10]. The softmax function takes real numbers as arguments and maps them into real
values between zero and one that has a sum equal to one. Then the sum of the output activations is one, the softmax layer can be thought of as a probability distribution and the O j value can be explained as the network's estimated probability of the classification of input.[12]
6. Result
This study constructs the MLP neural network model able to predict student satisfaction in e-learning (satisfied
or unsatisfied), and it can be help university to raise satisfaction by analyzing data
Table 1 gives information about the datasets used to construct the ANN model:
Table 1, shows that 191 cases are assigned to training sample, 66 cases are assigned to testing sample and 64 case is assigned to holdout sample. 321 cases are total.
Table 1. Process summary
Sample N Percent
Training 191 59.9%
Testing 66 20.6%
Holdout 64 19.9%
Total 321 100%
Figure 1 shows network diagram that used to predict student satisfaction (unsatisfied =0, satisfied =1) from 7 inputs variable, is shown in Figure 1. The diagram shows the 7 input nodes, the 4 hidden nodes and the two output nodes showing satisfaction and unsatisfaction categories
Table 2. Model summary
Sample Training Testing Holdout
Percent Incorrect Predictions 4.7% 4.5% 7.8% Percent correct prediction 95.3% 95.5% 92.2%
The result from the Table 2 model summary, gives information. According to the table, the percentage of incorrect predictions based on training and testing samples respectively are 4.7% and 4.5%, while the rate of incorrect predictions in the holdout data set drops to 7.8%. The learning procedure was performed until 10 consecutive steps with no decrease in error function was attained from the testing sample.
Table 3. Classification (matrix fusion)
Sample Observed Predicted
Unsatisfied Satisfied Percent
Training
Unsatisfied 52 3 94.5%
Satisfied 6 130 95.6%
Overall percent 30.4% 68.1% 95.3%
Testing
Unsatisfied 17 1 94.4%
Satisfied 2 46 95.8%
Overall percent 28.8 % 71.2% 95.5%
Holdout
Unsatisfied 15 2 88.2%
Satisfied 3 44 93.6%
Figure 1. Network diagram
For each case, the predicted student satisfaction e-learning is defined as satisfied if the predicted probability is greater than 0.5. As can be seen, the MLP network correctly classified 182 students, out of 191, in the training sample and 63 out of 66 in the testing sample.
Overall 95.6% of the training cases were correctly classified.
In the holdout sample, the sensitivity was found to be 88.2%, the specificity was 93.6% and the accuracy of the model, was 92.2 that we means have highly accurate model.
The MLP network model misclassified 5 students (7.8%) as false positive. the probability to predict satisfied for a student who is going to unsatisfied should be minimum.
Figure 2 presents The ROC diagram that shows the classification performance for all possible cutoffs is accurate The area value under AUC is 0.990 has excellent discrimination ability, that means the model-predicted pseudo-probability for the student of being in the satisfied category.
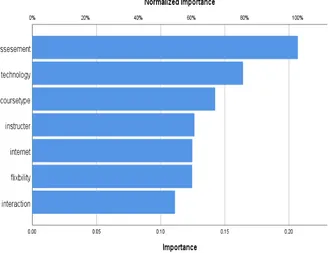
Figure 3. Neutral network importance chart
The chart in Figure 3 also describes the importance of the variables and gives the impact of each independent variable in the ANN model in order of relative and normalized importance. The chart depicts; the normalized importance of a diversity of assessments ratio is highest whereas instructor ratio has least normalized importance.
The results show that diversity in assessments and type of e-learning course significantly affect student satisfaction .
Table 4, Normalized Importance of Inputs Variable
Inputs Importance Normalized Importance
assessments 0.207 100.0%
Interaction 0.111 53.7%
Instructor 0.126 61.1%
Flexibility 0.124 60,2%
Type of course 0.142 68.9%
Internet speed .0.125 60.2%
The workshops and
explanations prepared 0.164 60.2%
Table 4 shows that the diversity of assessments were the most important determinant of student's satisfaction in e-learning.
7. Conclusion
This study aimed to construct the effectiveness of artificial neural networks in predicting student satisfaction, based on data collected from students' e-learning. The literature background indicated that neural networks exceed all other classifiers, in terms of accurate prediction. A multilayer perceptron neural network was published by the back-propagation algorithm, to predict students' satisfaction in e-learning.
The classification accuracy rate was high, with 92.2% accurate in classifying the students into the predicted satisfied and unsatisfied categories. The empirical results indicate that diversity in assessments and type of e- learning course learning are two strong determinants of learning satisfaction. The results from the study also shows the AUC is 0.990 has excellent discrimination ability. The results of this study are very interesting, drawing attention to them, inviting the researcher and encouraging them to conduct similar future studies that expand and deepen a study student satisfaction with e-learning.
Regardless future study will need to investigate these results in a larger area and diverse samples, there are positive results that the proposed model can be able to predict student satisfaction and help the university to raise student satisfaction in e-learnig.
Acknowledgement:
Students of Faculty science, University of Tabuk was strongly acknowledged for participating in the questionnaire for research.
References
[1] Stefanovic, Darko, et al. "Empirical study of student satisfaction in e-learning system environment." Technics technologies education management 6.4 (2011), 1152-1164.
[2] Arbaugh, J. B. Virtual classroom characteristics and student satisfaction with internet based MBA courses. Journal of Management Education,24(1), (2000). 32-54.
[3] Areti, V. Satisfying distance education students of the Hellenic Open University. E-mentor, 2 (14), (2006). 1-12.
[5] Roberts, T. G., Irani, T. A., Telg, R. W., & Lundy, L. K. The development of an instrument to evaluate distance education courses using student attitudes. The American Journal of Distance Education, 19 (1), (2005): 51- 64.
[6] Fullerton, G., Taylor, S. "Mediating, interactive, and non-linear effects in service quality and satisfaction with services research", Canadian Journal of Administrative Sciences, Vol. 19 No.2, (2002), pp.124-36.
[7] Eswari, J. Satya, et al. "Prediction of stenosis behaviour in artery by neural network and multiple linear regressions." Biomechanics and Modeling in Mechanobiology. (2020): 1-15.
[8] McClelland, J.L., Rumelhart, D.E., and Hinton, G.E. The appeal of parallel distributed processing, in Parallel Distributed Processing: Explorations in the Microstructure of Cognition - Foundations, Vol.1, MIT Press, Cambridge, (1986), pp.3-44.
[9] Leverington.. A Basic Introduction to Feedforward Backpropagation Neural Networks
http://www.webpages.ttu.edu/dleverin/neural_network/neural_net works.htm, (2009).
[10] Rojas Raúl. Neural Networks: A Systematic Introduction, Springer-Verlag, Berlin, New-York. ,(1996)
[11] IBM .Knowledge Center. http://goo.gl/SuuMHu, (2016).
[12] R.Ruhin kouser, J.Daphney Joann, K. Suganya, FORECASTING STUDENT ACADEMIC PERFORMANCE BY DECISION TREE LEARNING USING ARTIFICIAL NEURAL NETWORKS, International Research Journal of Engineering and
Technology (IRJET) e-ISSN: 2395 -0056 Volume: 03 Issue: 12 | Dec -2016.
[13] Zacharis, Nick Z. "Predicting student academic performance in blended learning using Artificial Neural Networks." International Journal of Artificial Intelligence and Applications 7.5 (2016): 17-214.
[14] Tufaner, Fatih, and Yavuz Demirci. "Prediction of biogas production rate from anaerobic hybrid reactor by artificial neural network and nonlinear regressions models." Clean Technologies and Environmental Policy (2020): 1-12.
[15] Asogwa, O. C., et al. "On the Modeling of the Effects of COVID-19 Outbreak on the Welfare of Nigerian Citizens, Using Network Model." American Journal of Applied Mathematics and Statistics 8.2 (2020): 58-63.
[16] asser, Ibrahim M., and Samy S. Abu-Naser. "Predicting Tumor Category Using Artificial Neural Networks." (2019).
[17] O. C. Asogwa and A. V. Oladugba .Of Students Academic Performance Rates Using Artificial Neural Networks (ANNs). American Journal of Applied Mathematics and Statistics.3, (4) (2015): 151-155.
[18] Dziuban, Charles, et al. "Student Satisfaction with Online Learning: Is It a Psychological Contract?." Online Learning 19.2 (2015): n2..
[19] Wu, Jen-Her, Robert D. Tennyson, and Tzyh-Lih Hsia. "A study of student satisfaction in a blended e-learning system environment." Computers & Education 55.1 (2010): 155-164.