DETERMINATION AND CORRELATION OF HERBICIDE
RESIDUES IN WATER AND SEDIMENTS IN THE STREAMS
FLOWING INTO THE CALEDON RIVER USING THE
BUBBLE-IN-DROP SINGLE DROP MICRO-EXTRACTION METHOD
Mosotho J. George
[a]Keywords: bubble-in-drop micro-extraction, hot-water extraction, herbicides monitoring, sediments, farming area, Lesotho
Environmental monitoring of metolachlor and atrazine herbicides in water samples has been reported recently with the use of the “bubble-in-drop single drop micro-extraction” (BID-SDME) method. This study reports the application of this method coupled with the hot-water extraction for the analysis of the residues of these herbicides from the water and sediment samples obtained in the streams running into the Caledon River in the eastern Free State – South Africa. The method was validated for several figures of merit before application to the real samples: it showed sufficient robustness (RSD < 7 % repeatability and reproducibility); sufficient linearity with 0.9991 > R2 > 0.9978,
accuracy of 98 % using 5 ng mL-1 atraton CRM in water. The results demonstrated that both these herbicides are widely used in the farms
as all the streams had detectable levels of at least one herbicide with concentrations ranging from 5 ng mL-1 to about 30 ng mL-1 for water
samples and 1 ng mL-1 to 35 ng mL -1 in the sediment samples with some positive correlation between the abundance in the two media (R2 =
0.8267 for atrazine and 0.9012 for metolachlor). The analyte recoveries from the samples relative to HPLC grade water solutions were higher than 90 % demonstrating sufficient recovery. Some related compounds (simazine, terbutylazine and acetochlor) were also detected in some of these samples, although not quantified for lack of appropriate standards.
*Corresponding Authors
E-Mail: [email protected] or [email protected]
[a] Department of Chemistry and Chemical Technology, National University of Lesotho, P.O. Roma 180, Lesotho. Southern Africa. Telephone: +266 5221 3502, Fax: +26 2234 0000,
Introduction
In the wake of herbicide pollution and its detrimental effect on biodiversity, there is a lot of research towards development of affordable and quick methods without compromising the effectiveness of such in detecting and monitoring of these herbicides. Some of the deleterious effects of herbicides include carcinogenicity,1
endocrine activity2
and a range of other ailments such as immune suppression, diminished intelligence and reproductive abnormalities.3
However, these chemicals are still very important in agro-industry for control of pests and weeds for increased agricultural and food production. Consequently, this poses a dilemma regarding food security on one hand and a threat to human life and biodiversity of not only amphibians but also of other natural flora and fauna, on the other.4 , 5
Due to these effects and many other associated issues, foods tainted with pesticides lose their competitiveness in the markets;6 this is especially so lately
when attention seems to shift towards the so-called ‘organic’ foods.7 Other than the market related issues, herbicides
monitoring could also aid in important issues such as planning crop rotation which sometimes could be dependent on the presence of traces of the herbicides applied in the previous season.8,9
There is also a fear that indiscriminate applications of pesticides could also unintentionally destroy
the beneficial pest predators as well as increasing the tolerance and the resulting virulence of some species of agricultural pests due to excessive exposure.10
A number of extraction techniques have been developed with reported improvements in any of the performance phenomena such as efficiency, degree of complexity, practicality, just to mention a few, prior to the most common analytical techniques – gas and/or liquid chromatography with various detectors.11,12
In the advent of miniaturisation, solvent micro-extraction has also evolved from classical solvent extraction where copious amount of hazardous organic solvents are used to the drop-based methods all of which are reported to improve on any of their predecessors in terms of at least one of the attributes such as mass transfer rate, extraction efficiency, ease of handling, selectivity, automation, just to mention but a few as reported by the recent review.13
However this review seems to be oblivious of one of the simplest modification reported by Williams et al.14
where the intentional incorporation of the air-bubble into the droplet reportedly improved extraction rate hence efficiency by 150 % over a simple single-drop micro-extraction. The related air bubble modification was reported Farajzadeh et al.15
few months later, albeit for a different purpose - to aid dynamic extraction without stirring the mixture.
DOI: 10.17628/ECB.2014.3.1098 The importance of monitoring in the streams flowing into
the international rivers is reported as one of the critical issues, especially in the areas where there is scarcity of clean water resources with some predicting a third World war to be likely over water and not oil.16,17 The Caledon River, an
international boundary between South Africa and Lesotho, is very important because it provides a source for municipal water supply in Maseru, a capital city of Lesotho, where pesticide application is very minimal owing to the lack of commercial farming and to some extent also lack of most agricultural pests. Assessment of the Caledon River water quality around the Maseru metropolis revealed presence of high levels of agro-based chemicals such as phosphates and nitrates which could only be attributed to the commercial farming in the South African side of the border.18
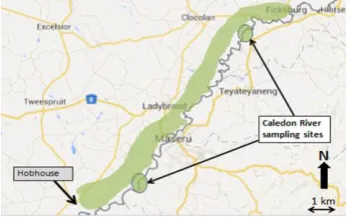
This manuscript reports the assessment of the herbicides (metolachlor, atrazine and their related herbicides) residues in the sediment and water samples in the streams running into the Caledon River on the eastern border of the Free State Province of South Africa with Lesotho (see Figure 1) using the bubble-in-drop single-drop micro-extraction method coupled to gas chromatography mass spectrometry. The samples used in this work included both sediments collected from some of the permanent streams as well as those that only run during rains, some of which seemed artificial for purposes of guiding water flow during heavy rains to avoid flooding.
Experimental
Reagents and chemicals
The pesticides, metolachlor (MET), atrazine (ATRZ) and their deuterated (2H) analogues (100 µg mL-1
in 1 mL ampules each), were obtained from Dr Ehrenstorfer GmbH (Augsburg, Germany). Diphenylamine (DPA), and desethylatrazine (DEA) (100 µg mL-1
) were obtained from Chem Service (Pennsylvania, USA), while chloroform, methanol and water (all HPLC grade) were obtained from Riedel de Haën (Seelze, Germany). Sodium chloride (AR grade) was obtained from Sigma-Aldrich (Seelze, Germany).
Standard solutions
The H-standards of 100 µg mL-1 atrazine and metolachlor,
respectively, were mixed together and diluted to 1 µg mL-1
in MeOH and kept in a freezer at -5 °C. The deuterated (2H)
standards for the same herbicides were prepared and stored in the same manner. The breakdown product, DEA was also mixed with atrazine and metolachlor to prepare a 1 µg mL-1
standard mixture in MeOH and the mixture was kept in the same freezer. The working solutions were prepared by dilution of these stock solutions. Reference solutions were prepared by dilution of the stock solution with methanol and injected directly (1 µL) into the instrument. For the extraction procedure, 0.1 g portions of NaCl were added to the aqueous solutions to make 10 % NaCl aqueous solutions. The 100 ng mL-1
diphenylamine solution was prepared by dilution from the 100 µg mL-1
solution with chloroform, used as the extracting solvent for the BID-SDME method with the diphenylamine employed as an internal standard.
Instrumentation
A calibrated gas-tight Hamilton GC syringe (Seelze, Germany) (10 μL) was used for sampling and injections. Analyses were carried out using a Shimadzu (Kyoto, Japan) QP2010 gas chromatograph coupled to mass spectrometry (GC-MS) equipped GC-MS Solution® was fitted with a Zebron 35MS column with 30 m x 0.25 mm x 0.25 μm dimensions. Pure helium (99.999 %, Afrox, South Africa) at a constant flow rate of 1 mL/min was used as the carrier gas. Injections (1 μL) were carried out in the splitless mode; after 2 minutes, a split ratio of 1:10 was maintained throughout the runs. The injection port and the transfer line were maintained at 250 °C. The oven programming included an initial temperature of 100 °C (held for 4 minutes), the temperature increased by 50 °C min-1
to 200 °C, then ramped by 10 °C min-1
to 280 °C and held for 5 minutes. The total time for one GC run was 17 minutes.
The mass spectrometer (EI 70 eV and 1.5 kV at 200 °C ion source temperature) was set up on the scanning mode with mass range 50-350 mass units for the monitoring experiments. The ions of interest were extracted out of the total ion chromatogram as follows: 162 (166), 169, 172 and 200 (205) for MET, DPA, DEA and ATRZ respectively (the values in the parentheses represent the 2
H analogues). The MS was set on the selected ion monitoring SIM mode embedded in the GC-MS Solution® software of the QP2010 GC-MS instrument using the same ions as listed above together with their respective qualifying ions (215 and 238 for ATRZ and MET, respectively), otherwise the MS was always used on scanning mode using the extracted ion monitoring (EIM) facility. The detector was switched on between 5 and 13 minutes.
Sample collection, storage and preparation
Water samples were collected in the streams and paddles of water where the flow had stopped along the Caledon River on the South African side between Hobhouse and Ficksburg (see the highlighted area in Figure 1). The samples for Caledon River were collected over the Peka Boarder Post (upstream site) one site downstream around Mokhalinyane on the Lesotho side. The sediment samples were collected from excess run-off deposits just outside running water; alternatively they were collected in the middle of the streams that were no longer running.
Where access was difficult, since most of the area is fenced for security of the farms, the samples were scooped with a Schott bottle attached to a 3 m long stick using a thin piece of wire. These samples were dried in the oven at 40 °C to a constant mass. There dried samples were ground uniformly and stored in a freezer at -5 °C until further use.
Portions of 2 g of air dried soil samples were transferred to sample bottles and doused with 50 µL of 100 ng mL-1
of aqueous deuterated standards solution. Sufficient amount HPLC grade water was added to submerge the samples and shaken gently to avoid lodging too much soil on the sides of the bottle for about 15 minutes. This suspension dried in the oven at 40 °C. After complete dryness the samples were re-dissolved in 2 mL of near boiling HPLC grade water and shaken for about 15 seconds followed by centrifugation to settle the particulate matter, following the procedure outlined by Williams et al.19
A 1 mL aliquot of the clear supernatant liquid was transferred into a vial containing 0.1 g NaCl to make 10 % NaCl ready for the BID-SDME extraction process.
For the recovery the experiments, the relative responses of the deuterated standards of metolachlor and atrazine in the samples were compared to those obtained with that of the HPLC grade water spiked to the same concentration (25 ng mL-1
).
Three different solutions were prepared for each sample, and the extraction was performed in triplicates resulting in n = 9. Following assessment of recovery, quantitation of the amounts of the herbicides in the soil was calculated from the calibration curve using the extraction efficiency factor.
Micro-extraction procedure
The set-up for the BID-SDME extraction protocol is reported in detail elsewhere.14
An aliquot of 1 μL of the extracting solution was drawn into the syringe, followed by 0.5 µL air. These contents were introduced into the aqueous solution by gentle depression of the plunger, causing the air to form a bubble contained within the micro-droplet. Following a period of 20 minutes (under static conditions), the total solvent volume was carefully retracted into the syringe, and injected into the GC-MS.
Analytical performance and validation of the analytical method for the herbicides
The performance of the method was assessed using the aqueous solution of the 1H-standards at the concentration
range 0.5 to 10 ng mL-1. These aqueous samples were
extracted with the BID-SDME as previously described using diphenylamine as an internal standard. The linearity and LOD were evaluated from the analytical data obtained from the calibration curve.
The method was validated for accuracy using 5 ng mL-1
atraton (a member of atrazine herbicides) certified reference material in water (Chem Service, Pennsylvania, USA).
Results and discussion
Validation of the method for the different herbicides
Table 1 presents the validation data for the different analytes using the optimised conditions as described in Williams et al.14
The method gave sufficient linearity with correlation coefficient R2
ranging between the values 0.9979 (atrazine) and 0.9991 (metolachlor).
Table 1. The calibration data showing the intercepts, R2, slopes and
LOD values
BEF - bubble enrichment factor - ratio of extraction using BID-SDME to simple BID-SDME; #LOD determined using LOD = 3 ×
Standard Error Intercept/Slope;20$Determined using atraton using
5 ng mL-1 in water CRM
Determination of the BID-SDME extraction of recovery of the herbicides
The recovery rates of the herbicides were assessed using the deuterated 2
H5-atrazine and 2H6-metolachlor standards
spiked at 10 mg mL-1
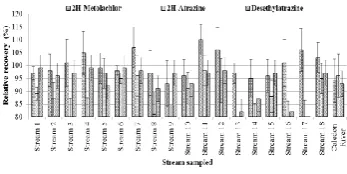
and compared to the HPLC grade water-based solutions. The use of DEA, break down product of atrazine, was necessitated by the fact that it was not detectable in the water and the sediment samples alike. The recovery rates are presented in Figure 2 depicted as a difference from the expected 100 % obtained using the HPLC grade aqueous solutions.
Figure 2. Obtained recoveries of the standards in water samples as residuals of 100 % from extracting HPLC grade aqueous solutions
Figure 3 depicts the relative recoveries (%) of the analytes from the sediment samples for the streams. As can be seen the average recovery for 2
H-atrazine (93 %) are significantly better than those reported by Williams et al. (70 %).19
However, it is worth mentioning that the samples where these were collected were significantly different.
Parameter Metola-chlor
Atra-zine
Desethylat-razine
Retention time, min 11.98 9.80 9.31
BEF* 1.54 1.49 1.52
Intercept 2.198 0.619 0.974
Slope 44.717 53.978 51.346
R2 0.9991 0.9979 0.9984
LOD, ng mL-1 # 0.024 0.013 0.054
Accuracy, %$ - 98 -
Reproducibility, % RSD
6.7 7.4 7.1
Repeatability, % RSD 5.8 4.9 6.4
DOI: 10.17628/ECB.2014.3.1098
Figure 3. Obtained recoveries of the standards in sediment samples relative to HPLC grade aqueous solutions
As can be seen the recoveries are significantly high (average 93 %) compared to the stream water samples that averaged 100 % with the combined average % RSD of 6.7.
Monitoring of herbicide residues in the streams and sediments
Figure 1 shows the map of the area where the sampling was carried out. As was stated earlier, all these streams flow into the Caledon River – an international border between South Africa and Lesotho. For identification of the analytes, the NIST Library incorporated into the GCMS Solution® of the instrument together with the retention times and the reference/qualifying ratios were used although the library matches resulted in much lower match accuracy as the background increased with the real samples.
The following reference/qualifying ion (Ref/Qual) ratios were used appropriately: atrazine 200/215 (1.43) at 9.80 min, simazine 201/214 (1.56) at 9.91 min, terbutylazine 214/229 (2.59) at 9.92 min (overlapping with simazine, but resolved
through the selected/extracted ion monitoring, see Figure 4) as obtained using the US-EPA mixture TP-619, as well as the addition of metolachlor 162/238 (1.51) at 11.98 min; Desethylatrazine and diphenylamine were used as atrazine breakdown product and an internal standard respectively as reported elsewhere.21
Figure 4. A chromatogram showing some of the herbicides detected in the sampled streams
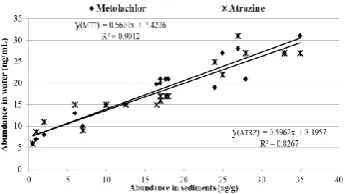
Examination of Table 2 reveals no clear trend between the water and sediment samples. However the plot of the correlation between the water and sediment samples reveals significant correlation with R2
= 0.9012 for metolachlor and R2
= 0.8267 for atrazine (Figure 5). These correlation values indicate that the abundance in the sediment is directly proportional to the abundance in water as would be expected. However, due to the complexity of the dynamics, the correlation was expected to be more unpredictable than the correlation coefficients suggest.
Table 2. Some herbicides detected from the water and sediment samples from the streams
Stream Herbicide identified
Obtained ratio* Concentration$
Water (ng mL-1) Sediment (ng g-1)
1, 7 and 12 Metolachlor
Atrazine
1.53 - 1.56 1.45 - 1.47
12.5 - 34.0 (8.8) 23.6 (8.9)
15.1 - 31.4 (6.9) 18.4 (9.1)
2, 3, 8 Metolachlor
Acetochlor**
Simazine
1.49 - 1.53 1.64 - 1.66 1.53 - 1.56
6.8 - 38.9 (7.3) N/Q€ N/Q
12.2 - 23.6 (8.2) N/Q N/Q
4, 16, 17 Atrazine
Simazine
1.43 - 1.47 1.52 - 1.55
17.3 - 28.5 (7.3) N/Q
21.4 - 18.7 (5.7) N/Q
5, 6, 9, 14 Atrazine
Terbutylazine Metolachlor Acetochlor
1.46 - 1.47 2.54 - 2.58 1.47 - 1.51 1.64 - 1.67
33.1 (6.4) N/Q 27.7 (6.9) N/Q
21.0 - 27.4 (8.4) N/Q 18.2 - 21.8 (6.7) N/Q
10, 13, 15 Atrazine
Terbutylazine Metolachlor
1.44 - 1.48 2.52 - 2.57 1.49 - 1.52
8.7 - 35.2 (6.7) N/Q 6.71 – 18.7 (8.9)
5.9 - 19.7 (9.3) N/Q 0.5 - 17.8 (5.2)
11, 18 Terbutylazine 2.54 - 2.56 N/Q N/Q
Caledon river 1 & 2# Not detected N/A N/A N/A
*Ratios obtained from reference to qualifying ions for different ions obtained in the streams; $Calculated using the percentage recovery of the
deuterated standards and denoted as a range for streams in the entry (values in brackets indicate the average % RSD); € N/Q denotes not
quantified, these analytes were not quantified due to absence of the appropriate standards; **Suspected from the detection of ions: 223, 162
and 146 with the Ref/Qual ion of 1.67 obtained using 146/223 compared to the standard reported in Findley et al.; # Collected at
Figure 5. A figure showing the correlation of the abundances between the water and sediments samples
The water samples from the streams reported earlier have shown some decrease in the concentrations (33.1 - 21.7 ng mL-1 compared to 27.7 - 18.7 mg mL-1 for metolachlor and
atrazine respectively). Interestingly, this time around some metolachlor related compounds, acetochlor was detected in some streams (2, 5, 6 and 9), although they could not be quantified. It must be mentioned that the intensity of the signals on the chromatograms were very low, although the Ref/Qual ion ratios were still satisfactory as compared to those calculated from Findley et al.22
Discussions and conclusion
This work has complemented the earlier report where the BID-SDME method was applied for the monitoring of the water samples from the five streams flowing into the Caledon River.22
However there was no correlation between these results and those reported earlier as it was already argued therein that the abundance of these herbicides in the streams is dependent on a number of variables such as amount of herbicides applied, weather conditions, soil type, amounts of rain and co-application of other chemicals such as fertilisers that all could affect the herbicides’ mobility. These results demonstrate the applicability of the hot-water extraction coupled with the BID-SDME as a highly efficient tool for application to the environmental monitoring of the herbicides (atrazine and metolachlor) in the sediment and soil samples with the sub-nano gram per millilitre (parts per billion) level LODs (0.013 - 0.054 ng mL-1
, respectively).
The correlation between the water and sediment samples is quite interesting given that most of the streams flow only during rainy seasons and dry up during dry season. These results in a way further confirm the observation that most agro-based chemicals such as phosphates and nitrates detected in the Caledon River could actually be as a result of run-off from these farms just across the river.18
The non-detectability of these herbicides in the Caledon River is worrisome given that the streams that feed into this river do contain these herbicides. This suggests that further experiments, possibly using passive samples would be necessary for the monitoring of these herbicides in this important river between the Lesotho and its sole neighbour South Africa.
References
1World Health Organisation (WHO), Guidelines for Drinking-Water Quality, vol. 1. 2nd ed. (Chapter 3). World Health Organization, Geneva 1993.
2Special Report on Environmental Endocrine Disruption: An
effects Assessment Analysis, 1997, Vol. 62(50), 50J
3Abhilash, P. C. and Singh, N., J. Hazard. Mater., 2009, 165, 1-12
4Hayes, T., Haston, K., Tsui, M., Hoang, A., Haeffele, C. and Vonk,
A. Environ. Health Perspect., 2003, 111, 568-575
5McLaughlin, A. and Mineau, P., Agric. Ecosyst. Environ.,1995,
55(3), 201-212
6Galt, R. E., Geoforum, 2008, 39(3), 1378-1392
7Williamson, S., Ball, A. and Pretty, J., Crop Protection, 2008, 27,
1327-1334
8Monks, C. D. and Banks, P. A., Weed Science, 1991, 39(40),
629-633
9Stougaard, B., Northern Agricultural Research Center,Montana
State University, retri. on 14 Oct. 2014 from
http://www.montana.edu/cpa/news/wwwpb-archives/ag/caryover.html
10Wilson, C. and Tisdell, C., Ecol. Economics, 2001, 39(3),
449-462
11Andreu, V. and Picó, Y., Trends Anal. Chem., 2004, 23(10-11),
772-789
12Le Doux, M., J. Chromatogr. A, 2011, 1218(8), 1021-1036
13Prosen, H., Molecules,2014, 19(5), 6776-6808
14Williams, D. B. G., George, M. J., Meyer, R. and Marjanovic. L., Anal. Chem., 2011, 83(17), 6713-6716
15Farajzadeh, M. A., Afshar Mogaddam, M. R. Anal. Chim. Acta2012,728, 31-38
16Morissette, J. J. and Borer, D. A., Parameters, 2004, 86-101
17Gleick, P. H. and Heberger, M., The World’s Water, 2011,
175-214
18Tanor, E. B., Ts’enoli, S. and George, M. J., Euro. Chem. Bull., 2014, 3(8), 776-782
19Williams D. B. G., George, M. J. and Marjanovic, L., J. Agric. Food Chem., 2014, 62(31), 7676-7681
20Ribani, M., Collins, C. H., and Bottoli, C. B. G., J. Chromatogr. A, 2007, 1156, 201-205
21George, M. J., PhD Thesis, University of Johannesburg,
Johannesburg, South Africa, 2012
22George, M. J., S. Afr. J. Chem., 2014, 67, 56-60