International Journal of Advances in Management and Economics
Available online at:www.managementjournal.info
RESEARCH ARTICLE
The Relationship between Economic Growth and Stock Market
Mohammad Alawin
*, Adnan Tariq Ali,
Ebrahim Merza
Department of Economics, Kuwait University, Kuwait.
*Corresponding Author: Email:[email protected]
Abstract: This study aims at examining the causality between economic growth and the performance of
stock markets in two countries, Nigeria and United Arab Emirates (UAE), for the period of 2004-2015. The variables that will represent economic growth will be the gross domestic product (GDP) and foreign direct investment (FDI). The variables utilized for the stock market will be the total traded value of shares per year, the market capitalization value and the turnover ratio. Results show there is a causal relation between economic growth and the stock market in Nigeria and UAE. Empirical evidence suggests there is a unidirectional relationship from the stock market toward the GDP and FDI. The findings imply that stock market development stimulates economic growth. Thus, it can be concluded that in order to promote economic growth, these countries should work on supporting and developing the stock market.
Keywords:Causality, Economic Growth, Stock Market, Nigeria, United Arab Emirates.
Article Received: 30 July 2018 Revised: 10 August 2018 Accepted: 22 August 2018
Introduction
There has been a lot of interest in studying the relation between the financial system and economic growth since the 20th century. There has been an ongoing debate about the reasons for this relation. The focus has been on the role of the stock market and how it affects economic growth. According to, the difference between the developed and developing countries is that the financial system is more advanced and efficient in developed countries. This paper will study the causality between the economy and the stock market, in addition to studying the possible co integration relationships among these variables. The variables for economic growth will be gross domestic product (GDP) and foreign direct investment (FDI).
The variables utilized for the stock market will be the total traded value of shares per year (TTV), the market capitalization value (MC), and the turnover ratio (TR). This study will include data sets for Nigeria and United Arab Emirates. The time period will be 2004-2015.
Financial Market Indicators can be Utilized to Predict and Affect Economic Growth
A number of reasons stood behind the relationship between market indicators and economic growth. First, the financial market system does provide an enormous amount of data related to the economy. It provides a snapshot of the economy in real time from the perspective of local investors and international investors. Second, the function of the financial market and intermediaries is to facilitate exchange and risk diversification. Risk diversification has been such a cornerstone since the 2008 financial crisis that it has emerged and has been entrenched as an integral part of any organization’s policy.
natural resource-rich economies and divide the paper intofour main topics. First, literature on the link between the stock market and the economic growth will be examined. Second, development of each economy and the economic policy challenges posed to resource-rich economies will be discussed. Third, this paper will discuss the methodology and the results of the
econometric model that checks the
relationship between economic growth and the stock markets in Nigeria and United Arab Emirates (UAE) and the implications of these results. Finally, the conclusion section
will end the study with some
recommendations.
Literature Review
Noted that the services provided by financial intermediaries are important for economic innovation, economic growth, and productive investment. Schumpeter was the first author
to discuss the role of financial
intermediation. Goldsmith [1] was one of the first authors to study the empirical relation between economic growth and financial development. Economic growth is believed to be associated with the well-being and prosperity of a country. Generally, the growth rate of GDP indicates economic growth. However, there is a debate on utilizing GDP as an indicator of growth and prosperity [2].
Despite this debate, GDP as an indicator cannot be ignored. Sala-i-Martin [3] concludes that poverty has been reduced particularly in those regions with higher GDP growth. King and Levine [4] conclude a positive relationship between financial development and economic growth. There are numerous indicators available to measure financial development. Law and Singh [5] prefer to use financial indicators related to banking activity, like the volume of credit available to the private sectors. King and Levine [4] prefer to utilize the value of intermediate assets. They concluded that financial development stimulates long-term economic growth.
Levine [6] also indicated that the functions of the financial market affect economic growth
through capital accumulation and
technological innovation. There has been a debate on the features of financial development. King and Levine [4] divided financial developments into two features.
First, emphasis on developing the banking sector is the banking-based financial system that is believed to be functional in continental Europe. Second, developing a liquid stock market is the market-based system that has been functional in the United States and the United Kingdom. On the other hand, Levine and Zervos[7] concluded that liquidity of the stock market (market-based) and the development of banks (bank-based) are complementary. Also, both approaches stimulate economic growth, capital accumulation, and productivity growth.
Spears [8] found that in the early stages of development in a country, the stock market facilitates economic growth through the accumulation of capital. The reason behind this is that investors avoid investing directly in the companies in the form of a formal partnership. However, they prefer to invest in stocks so they can easily withdraw their capital out of the market whenever they want. Hence, the investor can buy and sell stocks quickly and with independence. Levine and Zervos [7] reported that an efficient stock market attracts higher investment by financing productive projects that contribute to economic growth. An efficient stock market also allocates capital efficiently, facilitates the exchange of money, and reduces risk by diversification. It also mobilizes domestic savings and attracts foreign savings through capital inflows in the stock market.
Bencivenga and Smith [9] concluded that an efficient and liquid stock market attracts long-term investment and hence economic growth. It enables the firm to acquire the required capital quickly that facilitates capital allocation. Caporale et al. [10] states that liberalization of the financial markets helps achieve all octave efficiency of capital. They further explain that the banks only finance the least risky projects whereas risky and innovative projects are financed by the stock market. Also, another advantage of the stock market is the liquidity it provides, and a wide range of financial products are available that enable investors and savers to diversify risk.
development can stimulate economic growth. However, Araoyeet al. [11] examined the impact of the Nigerian stock market on the Nigerian economy, and the results show that the stock market is very important for determining the behavior of economic growth in Nigeria.
How Could Natural Resource Rich Countries Deal with Policy Challenges
Oil income should be treated as a depleting resource. Saving for the future is always going to benefit the country if it needs emergency funds in the future. The use of these funds could vary from providing a boost for the transition period when the resource is fully utilized, as in the case of middle income or poor nations exporting oil. On the other hand, if a nation is already well developed like Norway, the future funds could be invested and only the return utilized to provide ease for the government to finance various projects [13].
The emphasis also should be on establishing good governance and eliminating corruption in the country so it can continue to grow even if the natural resource is no longer available. As world oil prices are volatile, there must be an exit strategy for a nation irrespective of being a poor, middle income, or high income nation. According to Sachset al. [13], if the natural resource income is properly managed with transparency and good governance and invested in the public projects required, that can transform the economy so there may be no fear of a Dutch disease.
Fiscal Policy Issues in Natural
Resource-rich Countries
Aliyev[13] explains that in a free market, imposing import tariffs will hinder foreign trade and will reduce economic efficiency. Similarly, income taxes discourage market production. This phenomenon is avoided by the natural resource-rich country to some extent. The factor that hinders the government in imposing tax might relate to the universal belief of people’s right to the natural resource.
For example, the Iceland fishery quotas imposed by the government allow the transfer of quotas through selling in the free market thus increasing efficiency. As a result, it created a pool of wealthy individuals who went on and joined politics and contributed to the financial crisis in
Iceland in 2008 and sold two of the largest banks in Iceland at an unreasonably low value [14]. For this reason, fiscal stability plays a crucial part in an economy as it has a
vulnerable nature. It requires an
independent but accountable central bank to facilitate and regulate the economy [15].
The Exaggerated Fear of Dutch Disease
Sachset al. [12] summarized that the Dutch disease discovered in the Netherlands is
simply the sudden decline in the
manufacturing sector after discovering natural gas. The extraction of a natural resource leads to an increase in exports. This leads to an appreciation of the local currency. As the currency appreciates, it makes it difficult to export the manufacturing sector goods as they are expensive for a foreigner to buy. This is known as the spending effect. Also, existing labor in the manufacturing sector is attracted toward the natural resource sector known as the resource pull effect. This shift of labor accompanies a cost of training labor in order to be compatible with the new job-market demands.
Overall, the manufacturing sector, which is mainly agriculture in the developing countries, gets affected. The manufacturing sector, which is considered to be the long-term power house for the economy, is affected significantly and tends to lack behind in technological advancement and undergoes income inequality. As a result, when the resource-dependent industry starts to slow down due to any factor, it hinders the recovery of the manufacturing sector.
The fear of Dutch disease is that if the oil income squeezes the non-oil export sector, it may halt technological advancements. But, this is just if the country already has a sector in which it specializes and that contributes to the significant growth of the economy. However, this problem can be solved if the oil income is properly invested in the infrastructure or other sectors in order to boost the productivity of the workers. As long as the oil income is used to finance the investments in the economy rather than consumption, Dutch disease can be avoided.
The Case of Nigeria
was invested in the manufacturing sector but the manufacturing sector was not utilized to the full capacity. It declined as the years passed. An example is the steel company built in the 1970s that did not produce a commercial ton of steel until 2003. Since the 1980s the capacity utilization has been below 40 % and investments in manufacturing were wasted. The Nigerian case shows that despite government heavily investing in the non-oil tradable (manufacturing) sector, it had a negative impact on the long-term growth. It also had another negative impact in the form
of labor being attracted to those
manufacturing jobs and thus shifting from agriculture to manufacturing jobs, which led to an increase in the price of food products. Thus, this increase was due to a decrease in production [16].
Nigeria Adapting Flexible Exchange Rate
Reasons for Implementing the Flexible Exchange Rate in June 1994
To gain control over the monetary policy in order to control interest rates. Nigerian interest rates as compared to the world market (in particular USA) were high, which attracted capital inflows during the 1990s until the 2008 financial crisis. According to World Bank statistics, the average interest rate in Nigeria for the period 1990-2008 was 20%.
Problems that arise in the flexible exchange rate system are the exchange rate volatility and commodity price volatility.
In order to address this issue, the Nigerian Central Bank planned to develop the financial market in terms of providing the financial tools to hedge so that it offset the adverse impact of the exchange rate volatility. The exchange rate volatility, as witnessed in the 2008 financial crises, led to sudden Sub-Saharan African countries’ monetary depreciation relative to the U.S. dollar, accompanied by high inflation [17].
As a result, the decision to move to a flexible exchange rate system was to have the benefit of the control over a monetary policy, which was impotent in the fixed exchange rate system. The main advantage provided by the fixed exchange rate was the stable exchange rate, which is possible to achieve through providing the hedging tools in the financial market. However, hedging tools were not
available in the Nigerian stock market during the 2008 financial crisis.
The Case of UAE
UAE Economic Growth
The United Arab Emirates’ economy is dependent on oil revenue. According to International Monetary Fund statistics, the oil to GDP ratio was 43% in 2015 and 37% in 2009. However, the trade reforms of 1999 played a significant role in diversifying the economy of UAE by attracting foreign businesses. Real estate and financial services played a vital role in the economic development of UAE. Thus, real estate and financial development have boosted economic growth in the UAE. The contribution of Dubai is 29% in the total GDP of UAE and has one of the best service sectors in the Gulf Cooperation Council [18].
The growth of the UAE economy has been a result of several factors. According to Al-Mohana [19], the main factor has been oil revenue and low-interest rates. Also, the surge in the real estate sector, developing
tourism industry, and a developed
infrastructure has contributed to the growth of the UAE economy. All these factors
assisted in attracting foreign direct
investment.
Dubai Stock Market
The stock market in UAE was set up in 2000. The Dubai Financial Market (DFM) was formed in March 2000. DFM was a public joint stock company (PJSC). Emirates Securities and Commodities Authorities (ESCA) is the regulator for the Dubai Financial Market [18. The Dubai stock market has been contributing to the growth of the UAE financial market and has been growing. PJSC shares were introduced in 2007 to DFM at a price of $0.28 and the share value rose to $0.61 on the same day [18]. This sudden increase in stock price clearly showed the promise that the Dubai stock market instilled in the investors.
UAE Exchange Rate Policy
According to Squalli [21], the total debt of UAE was increased by $59 billion. According to Ishfaq [20], the main reason for the downfall of the stock market in the United Arab Emirates during the 2008 financial crisis was the volatility of the U.S. dollar. In addition, the lack of regulatory framework in the UAE for the stock market also contributed to the downfall of the stock market.
Methodology and Data
The countries included in the data set are Nigeria and UAE. The main focus of this paper will be to test if there is Granger causality of financial variables to macro-economic variables in these two economies. If there is Granger causality, then there is proof that financial market development is a crucial factor that can assist UAE and Nigeria to stimulate economic growth. All the results have been generated using the STATA software.
The vector autoregressive model (VAR) will be used to study the relationship between economic growth and stock market variables. In addition, the vector error correction model (VECM) will be used to study the short-term
and long-term relation between the
variability. The equation for the VAR would be as in equations (1) and (2) to study the causality between the economic growth variables and the stock market variables. The objective of the study is to analyze the relation between economic growth and stock market variable. The specifics are based on the work of Ake and Dehuan [22]:
EGt = ∑𝑛𝑖=1 𝛼𝑖EGt-i + ∑𝑛𝑗=1 𝛽𝑗 SMt-j + ut (E1)
SMt = ∑𝑛𝑖=1 𝜆𝑖SMt-i + ∑𝑛𝑗=1 𝛿𝑗 EGt-j + ut (E2)
Where EG stands for economic growth and SM is for the stock market. The economic variables are indicated by current GDP and the foreign direct investment (FDI). The stock market variables that measure the financial development are stocks traded, total value (TTV), turnover ratio (TR) and market
capitalization (MC). The alternative
hypothesis, which will be tested in the Granger causality tests, will be the following: “at least one stock market lag causes economic growth.” The unit root test will be conducted using the Augmented Dickey Fuller (ADF) unit root test. The order of
integration will be determined by
differentiating the variable if the variable is not stationary at level.
The next step is to analyze the existence of co integration of the series of the same order of integration, which will be conducted by using the Johansen test. Finally, the VAR will be conducted to predict the Granger causality between variables. The data set for all stock market and economic growth indicators is obtained from the World Bank Database which is annual and the time period is from 2004-2015.
Empirical Results
United Arab Emirates Results
The ADF test results are shown in Table (1). The results show that all variables are non-stationary at level. However, after taking the first difference and testing for unit root again indicates that all variables are stationary at their first difference and are integrated of order 1 as the p-value is less than the significance level.
Table 1: Augmented Dickey-Fuller Unit Root Test (Results - UAE)
Variables ADF p-value (in level) ADF p-value (in difference)
GDP 0.4184 0.0387
FDI 0.2657 0.0261
TTV 0.0707 0.0009
TR 0.0565 0.0021
MC 0.4047 0.000
The results of the Johansen test for co integration, reported in Table (2) shows there is no co integration between the stock market
and economic growth variables. The trace statistic is less than the critical value, so it proves there is no co integration.
Table 2: Johansen test for Co integration (Trace) - UAE
Null Hypothesis Eigenvalue Trace Statistic 5% Critical Value
H0: r = 0* 0.98276 52.5382 68.52
H0: r ≤ 1* 0.91357 25.6062 47.21
H0: r ≤ 2* 0.70406 12.2127 29.68
H0: r ≤ 3* 0.5925 2.3377 15.41
H0: r ≤ 4* 0.19145 0.0001 3.76
H0: r ≤ 5 0.00001 0.0001 1.38
Table (3) shows the results of the Johansen test for co integration using the maximal eigen value. The maximal eigen statistic is less than the critical value, so it proves there
is no co integration. This method also shows there is no cointegration between the stock market and economic growth variables.
Table 3: Johansen test for Co integration (Maximum Eigenvalue) - UAE
Null Hypothesis Eigen value Max Eigen Statistic 5% Critical Value
H0: r = 0* 0.98276 26.932 33.46
H0: r ≤ 1* 0.91357 13.3935 27.07
H0: r ≤ 2* 0.70406 9.875 20.97
H0: r ≤ 3* 0.5925 2.3376 14.07
H0: r ≤ 4* 0.19145 0.0001 3.76
H0: r ≤ 5 0.00001 0.0001 1.38
Max-eigenvalue test indicates no co integrating equation at the 0.05 level *denotes acceptance of null hypothesis at the 0.05 level as Max Eigen statistic < critical value
The results prove there is no co integration among variables, but Granger and Newbold [23] concluded that the lack of co integration restricts the estimation of the VECM model and will only allow for the VAR model to be estimated. For this reason, the VAR model will be analyzed. The Granger causality results are
presented in Table (4). The direction of causality is from the stock market variables to the determinants of economic growth. The results reveal that for at least one stock market variable Granger causes the economic growth variable. Thus, the alternate hypothesis has to be accepted.
Table 4: Granger Causality Results for UAE
Direction of Causality P-Value Granger Causality
Traded value Granger Cause GDP 0.000 Yes Turnover ratio Granger Cause GDP 0.000 Yes Market capitalization Granger Cause GDP 0.004 Yes Traded value Granger Cause FDI 0.025 Yes Turnover ratio Granger Cause FDI 0.000 Yes Market capitalization Granger Cause FDI 0.891 No
The UAE results predict that the stock market variable does have a Granger causal effect on economic growth. The reason can be that the United Arab Emirates stock market is well equipped and financially developed to be one of the mainstream financial hubs and markets in the world economy. It implies that stock market development is a factor that can stimulate economic growth. Additionally, financial development could have provided the platform for the UAE to diversify the economy and move away from an oil-dependent economy.
Nigeria Results
The Augmented Dickey Fuller test results are shown in Table (5). The results show that all variables are non-stationary at level. However, after taking the first difference, all variables are stationary except stock total traded value (TTV). In this case, this variable will be excluded from further analysis because it is a requirement for the Johansen co integration test for all variables to be stationary at the same order.
Table 5: Augmented Dickey-Fuller Unit Root Test (Results - Nigeria)
Variables ADF p-value (in level) ADF p-value (in difference)
GDP 0.7948 0.0098
FDI 0.2034 0.0065
TTV 0.2483 0.0698*
TR 0.3537 0.0269
MC 0.0886 0.0091
ADF at difference is expressed as first difference significant at 5%. *TTV is not stationary in 1st difference (cannot be used for Johansen Co integration test)
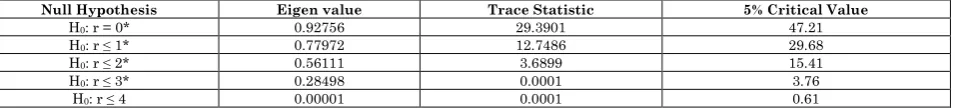
The Johansen test for co integration in Table (6) shows there is no co integration between the stock market and the macroeconomic variables
used for economic growth. The trace statistic is less than the critical value, so it proves that there is no co integration.
Table 6: Johansen test for Co integration (Trace) - Nigeria
Null Hypothesis Eigen value Trace Statistic 5% Critical Value
H0: r = 0* 0.92756 29.3901 47.21
H0: r ≤ 1* 0.77972 12.7486 29.68
H0: r ≤ 2* 0.56111 3.6899 15.41
H0: r ≤ 3* 0.28498 0.0001 3.76
H0: r ≤ 4 0.00001 0.0001 0.61
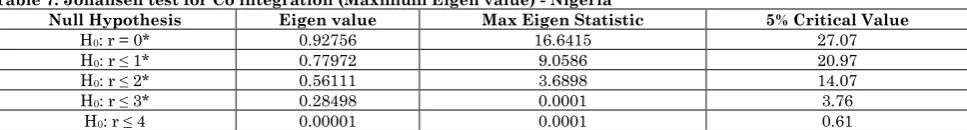
Table (7) shows the results of the Johansen test for co integration using the maximal eigen value, which further proves that there
is no cointegration between the variables of the stock market and macroeconomic variables used for economic growth.
Table 7: Johansen test for Co integration (Maximum Eigen value) - Nigeria
Null Hypothesis Eigen value Max Eigen Statistic 5% Critical Value
H0: r = 0* 0.92756 16.6415 27.07
H0: r ≤ 1* 0.77972 9.0586 20.97
H0: r ≤ 2* 0.56111 3.6898 14.07
H0: r ≤ 3* 0.28498 0.0001 3.76
H0: r ≤ 4 0.00001 0.0001 0.61
Max-eigenvalue test indicates no co integrating equation at the 0.05 level. *denotes acceptance of null hypothesis at the 0.05 level as Max Eigen statistic < critical value
The results show that there is no co integration among variables in the case of Nigeria. However, Granger and Newbold (1974) concluded that the lack of co integration restricts the estimation of the VECM model and will only allow for the VAR model to be estimated. For this reason, only the VAR model will be analyzed in the case of
Nigeria. The Granger causality results are presented in Table (8). The results reveal that for at least one of the stock market variables, Granger causes the economic growth variable. This implies that stock market development can stimulate economic growth in Nigeria.
Table 8: Granger Causality (Results - Nigeria)
Direction of Causality P-Value Granger Causality
Turnover ratio Granger Cause GDP 0.264 No
Market capitalization Granger Cause GDP 0.306 No
Turnover ratio Granger Cause FDI 0.033 Yes
Market capitalization Granger Cause FDI 0.911 No
Conclusion
The results reveal that a Granger causal relation does exist from stock market to economic growth in both the United Arab Emirates and Nigeria. Stock market development has the potential to foster economic development in both countries. As a result, the government of the respective countries should employ policies that will further develop the stock market and thus stimulate economic growth. Further, a topic
to be researched in the future can be the impact of the financial crisis of 2008 on the Granger causality between the stock market and economic growth of UAE and Nigeria. The financial crisis of 2008,which started with the collapse of the real estate market in the United States, had an adverse impact on almost all the major economies. The comparison of the causality pre- and post-crisis would provide a hint to the degree of dependability on the American stock market.
References
1. Goldsmith Raymond (1969) Financial Structure and Development. New Haven, Yale University Press, p.114-123.
2. Stiglitz J, Sen A, Fitoussi J (2009) The Measurement of Economic Performance and Social Progress Revisited. Measurement of Economic Performance conference paper, Harvard University, p.01-63
3. Sala-i-Martin X (2006) the World Distribution of Income: Falling Poverty and Convergence. The Quarterly Journal of Economics, 121(2):2-5.
4. King R, Levine R (1993) Finance and Growth: Schumpeter Might Be Right. The Quarterly Journal of Economics, 108(30):17-29.
5. Law S, Singh N (2013) Does Too Much Finance Harm Economic Growth? Journal of Banking and Finance, 41(4):36-42.
6. Levine R (2004) Finance and Growth: Theory and Evidence. National Bureau of Economic Research, 10766:3-10.
7. Levine R, Zervos S (1996) Stock Market Development and Long-Run Growth. World Bank Economic Review, 10(2):323-339.
8. Spears A (1991) Financial Development and Economic Growth-Causality Tests. Atlantic Economic Journal, 19(3):66-69.
10. Caporale M, Howells P, Soliman A (2004) Stock Market Development and Economic Growth: The Causal Linkage. Journal of Economic Development, 29(1):33-50.
11. Araoye, Ebun Ajayi, Olusuyi Aruwaji, Michael (2018) the Impact of Stock Market Development on Economic Growth in Nigeria. Journal of Business and African Economy, 4(1):1-15.
12. Sachs, Jeffrey, Humphreys, Macartan, Stiglitz, Joseph (2007) Escaping the Resource Curse, Columbia University Press, New York, p. 01-10.
13. Aliyev R (2012) Monetary Policy in Resource Rich Developing Economies. Academy of Sciences of the Czech Republic Economic Institute, 466-32.
14. Breedon Francis, Pétursson, Thórarinn, Rose, Andrew (2012) Exchange Rate Policy in Small Rich Economies. Open Economies Review, 23(3):421-445.
15. Aliyev R (2014) Determinants of the Choice of Exchange Rate Regime in Oil Exporting Countries. Academy of Sciences of the Czech Republic Economic Institute, 527:17-25. 16. Sala-i-Martin X, Subramanian A (2003)
Addressing Natural resource curse: an illustration from Nigeria. National Bureau of Economic Research, 9804:13-19.
17. Ltaifa N, Kaendera S, Dixit S (2009) Impact of Global Financial crisis on Exchange rate in Sub-Saharan Africa. International Monetary Fund, African Department, 9(3):12-16.
18. Khedhiri S, Muhammad N (2008) Empirical analysis of the UAE stock market volatility. International Research Journal of Finance and Economics, 3(15):249-260.
19. Al-Mohana S (2015) an Empirical Investigation of the UAE Stock Markets. PhD Theses United Arab Emirates University, p.01-240.
20. Ishfaq M (2010) Overview of Different Exchange Rate Regimes and Preferred Choice for UAE. Economic Papers Series, Government of Dubai, p.1-26.
21. Squalli J (2005) Are the UAE Financial Markets Efficient? EPRU Working Paper, No. 05-01, Zayed University.
22. Ake B, Dehuan J (2010) the Role of Stock Market Development in Economic Growth from some Euronext Countries. International Journal of Financial Research, 1(1):16-20. 23. Granger C, Newbold P (1974) Spurious