Available online at:
www.managementjournal.info
RESEARCH ARTICLE
The Study on the Impacts of Capital Structure on Corporate
Financial Performance in Food Manufacturing and Hotel
Industries: Evidence from SMEs in U.K.
Dianjie Liang
1,
Rongjia Su
2*1Nottingham Business School, Nottingham Trent University, United Kingdom.
2 College of International Studies, Sichuan University, China.
*Corresponding Author: Rongjia Su
Abstract: This study aims to investigate the influence of capital structure on financial performance of small and medium sizes enterprises (SMEs) in food manufacturing and hotel industries in U.K. Data are collected from Financial Analysis Made Easy (FAME) database and least square regression analysis is applied to examine the impacts. Research results show that capital structure has a negative effect on financial performance in food manufacturing industry in U.K. However, mixed results are found in hotel industry. Capital structures have a negative impact on return on assets (ROA), while Capital structure affects return on equity (ROE) positively. Therefore, financial managers should not blindly employ debt without regard to industrial characteristics.
Keywords:Capital structure, Corporate financial performance, Hotel industry, Food manufacturing.
Article Received: 30 May 2019 Revised: 10 June 2019 Accepted: 22 June 2019
Introduction
Capital structure is a major area of interest in the field of corporate finance. Capital structure, as suggested by Baker and Martin [1], refers to the capital raised through debt, equity and hybrid securities by a firm, indicating the cost of corporate capital. It represents the combination of equity and debt and cost of capital. In fact, Gleason, Mathur [2] hold the view that a firm could improve performance by an optimal capital structure when other factors are equal, since an optimal capital structure could lead to maximum net return to the firm through minimum cost of capital.
However, given the different natures of industries, capital structure might perform different role in profitability. However, given the different natures of industries, capital structure might perform different role
in profitability. Hotel industry and food manufacturing are chosen because the different industry characteristic would lead to different asset structure and capital preference. For example, due to the short shelf life in food manufacturing industry, the cash conversion cycle may affect the financial performance and liquidity [3], while this is not the case in hotel industry, hotel location and tourist destination may impact the financial performance [4].
Moreover, most of the empirical studies on capital structure use data from large firms, while a limited number of studies concentrate on the role of capital structure in SMEs.
in large firms. In addition, SMEs perform a pivotal role in economic growth and development [6, 7], it is important to investigate factors affecting the profitability of SMEs. Hence, this study attempts to assess the link between capital structure and financial performance of SMEs in hotel and food manufacturing industries industry in UK. The remainder of our paper is structured as follows.
First, we present a review of the theoretical background on capital structure and financial performance and develop hypotheses. The next part describes the research methodology, and presents the result of our analyses. The final part shows conclusions, discussions, and limitations and provides direction for future research.
Literature Review and Hypotheses
Theoretical Background
A growing number of literatures have examined the relationship between capital
structure and financial performance.
Modigliani and Miller [8]. Propose that capital structure is not pertinent to the value of a firm under specific assumptions, including tax free, perfect capital market, no financial distress cost and so on.
This model, known as MM no-tax model, suggests that managers may not improve corporate performance by adjusting capital structure in perfect capital market. Although these stringent assumptions are deemed as unreasonable [9], an innovative model was established by Modigliani and Miller to examine the role of capital structure.
Subsequently, tax was introduced into original model by Modigliani and Miller [10], demonstrating that firm performance could be enhanced by financing through debt rather than equity.
This is because tax-deductible interest payment enables firms to pay less tax, which could decrease the cost of debt and create more value. Consistent to the theory, the
more debt is employed by firms, the more tax shield exists. Therefore, capital structure with 100% debt could maximize tax shield and the value of firm. Similarly, Myers [11] and Jensen [12] confirm high levels of debt could exert positive effect on firm performance.
A further model is given by Baxter [13], who takes bankruptcy cost into account and proposes Trade-off theory, indicating that a company may optimize capital structure to maximize corporate value. From another perspective, debt could undermine firm performance when the bankruptcy cost exceeds the tax benefits.
Nevertheless, Miller [14] points out that the bankruptcy cost is not sufficient to offset the tax shield, a firm could not explore no an optimal capital structure. Furthermore, the author states that the tax shield from corporate taxes would be offset exactly by personal taxes; therefore, tax would not exert impact on corporate value.
This view further supports the capital structure irrelevance theory [8]. Contrary to previously published studies, Pecking Order theory, furthered by Myers and Majluf [15], illustrates that a less profitable enterprise employs a higher level debt than profitable ones, suggesting an averse link between debt and profitability.
This theory claims that, owing to asymmetric information and adverse selection problems, firms prefer internally generated resources (i.e. retained earnings) to financing new investment rather than debt and equity.
Since issuing equity is considered as a bad signal, leading investors to believe that the shares are overvalued, firm’s shares will subsequently decline. In order to avoid the negative influence of equity issue, firms perceive debt as second choice of financing; hence, equity becomes the last resort.
financial leverage, while less profitable ones with inadequate internal funds resort to debt for new investment [16].
Effects of Capital Structure on Financial Performance
A variety of empirical studies pertaining to the capital structure theory show mixed and conflicting results. First of all, Salim and Yadav [17] utilize 237 Malaysian listed firms as sample to assess the link between capital structure and firm performance.
Their study confirms performance indicators, which are ROE, ROA, EPS and Tobin’s Q, have a reverse relationship with short term debt (STD), long term debt (LTD), total debt (TD) Also, Mwangi, Makau [18] investigate the influence of financial leverage on non-financial listed firms; They find that financial leverage has a significantly adverse impact on return on asset (ROA) and return on equity (ROE) representing financial performance, which supports the Pecking Order theory.
They suggest that poor performance of non-financial firms associates to a high level of long-term debt. The result is proved by other studies [2, 19, 21]. In contrast, a positive relationship is revealed by Nirajini and Priya [22]. They discover that long-term debt, debt asset ratio and debt-equity ratio have a positive effect on gross profit margin, return on capital employed, net profit margin (NPM), ROA and ROE.
The finding is in consonance with the study conducted by Gill, Biger [23], which demonstrates that capital structure relates positively to financial performance measured by earnings before interest and tax and ROE.
However, some studies show that results are neither consistent with the Trade-off theory nor the Pecking Order theory, indicating that
capital structure is irrelevant to financial performance [24, 26]. Phillips and Sipahioglu [26]. Confirm there is not significant correlation between the level of debt and profitability with 43 hotel firms. In this study, debt to assets and gearing ratio (GR)
are indicators for capital structure,
profitability is measured by ROA and ROE. El-Sayed Ebaid [24].
Analyzes data from non‐financial Egyptian listed firms. They find that capital structure does not have significant link with ROE, ROA and GPM. In the same vein, Enekwe, Agu [25] discover that financial leverage does not exert a significant influence on the profitability of Nigeria pharmaceutical companies.
In fact, only 16.4% of the variations on the financial performance, represented by ROA, result from financial leverage, including interest coverage ratio, debt ratio and debt-equity ratio. These studies based on pecking order theory propose hypotheses as follows to be tested:
H1
Gearing ratio has a significantly negative impact on ROE in hotel industry.
H2
Gearing ratio has a significantly negative impact on ROA in hotel industry.
H3
Gearing ratio has a significantly negative impact on ROE in food manufacturing.
H4
Gearing ratio has a significantly negative impact on ROA in food manufacturing.
Fig.1. Theoretical model
Methodology
Data
Quantitative methods is suitable for the study regarding the relationship between various variables [27], because quantitative data could be processed to reflect the connection and tendency by quantitative analysis techniques [28]. In addition, statistic software offer an effective way to analyze data [29]. Hence, quantitative approach is applied in this study. Both EVIEWS 9.0 and EXCEL are used for data processing and calculations. This study selected SMEs
respectively from hotel and food
manufacturing industries, analyzing
secondary data collected from FAME database.
FAME is a database covering over 11 million companies in the UK and Ireland, providing financial data, legal entity details, M&A
activities, corporate structures and
ownership(seehttps://www.bvdinfo.com/engb/ ourproducts/data/national/fame#secondaryM enuAnchor1). Fame is the ideal tool for general financial research, this is because FAME provides comparable and accurate information of a broad spectrum of firms in the UK, such as standardizing financials and ratios, which can facilitate the comparison
among different industries and firms [30]
The Following Criteria are Applied for Data Selection in This Research
Hotel industry is identified by the UK
standard industrial classification of
economic activities (UK SIC) with code 551, which stands for hotels and similar
accommodations. In terms of food
manufacturing, it is selected by UK SIC code 10 (manufacture of food products).
The companies are selected according to the
criteria of SME companies in FAME database. After selecting key variables, and
removing observations with missing
independent variables, the final unbalanced panel dataset consists of 1241 observations for food industry, and 1058 observations for hotel industry from the year 2014 to 2018.
Variables
A variety of variables have been applied in several studies of financial performance and capital structure use a variety of variables [17,18, 22, 24]. Prior research has employed accounting or by market-related indicators to measure financial performance, two kinds of indicators demonstrate different aspects of financial performance [31].
Accounting-based indicators include return on assets(ROA), return on equity (ROE), return on investment (ROI), net profit margin(NPM) [31-33], while market-related measures consist of earning per share (EPS), Market-to-book ratio, and Tobin’s Q, Price to Earning (P/E) Ratio, Market Valuation [32, 34, 35]. However, data obtained from FAME database used in this research pertain to both listed and
non-listed firms; no market-related
Hence, we only rely on accounting-based indicators for financial performance. Alshehhi, Nobanee [35] Investigated indicators used by extant studies in measuring financial performance and found that ROA was used in 53 out of the 132 papers, followed by ROE. According to Delcea, Bradea [36], financial performance could be evaluated reliably by ROA and ROE. Therefore, this research two the two most-used indicators to represent financial performance. In terms of capital structure, book value of GR is used as a measurement of capital structure in consistent with other
studies [37-39]. This study aims to investigate the effect of GR on ROA and on ROE in SMEs in hotel and food manufacturing industries in UK. Firm characteristics are often used as control variables [40]. In line with previous studies, the following control variables related to firm characteristics are employed: size [41, 42], ages [43, 44], tangibility [45, 46], and asset turnover rate [47]. According to Kao, Yeh [48], firm size (SIZE) can be measured by a log of total assets. Hence, we take logarithmic forms to size to avoid potential normality issue.
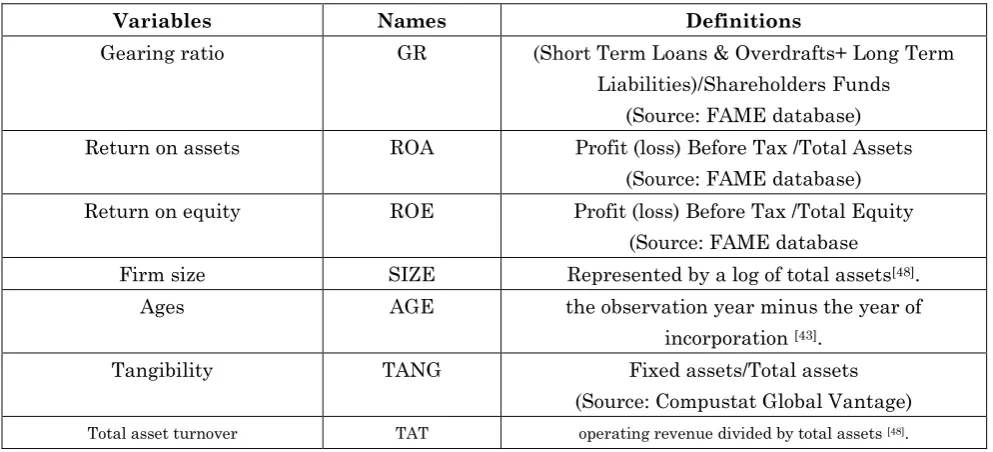
Table 1: Description of variables
Variables Names Definitions
Gearing ratio GR (Short Term Loans & Overdrafts+ Long Term
Liabilities)/Shareholders Funds (Source: FAME database)
Return on assets ROA Profit (loss) Before Tax /Total Assets
(Source: FAME database)
Return on equity ROE Profit (loss) Before Tax /Total Equity
(Source: FAME database
Firm size SIZE Represented by a log of total assets[48].
Ages AGE the observation year minus the year of
incorporation [43].
Tangibility TANG Fixed assets/Total assets
(Source: Compustat Global Vantage)
Total asset turnover TAT operating revenue divided by total assets [48].
Model Specification
To test the hypotheses, models used in prior studies [46, 49] was adapted to estimate capital structure and corporate financial
performance. The Panel Least Square regression model is specified as follows: Model (1a & 1b):
In these models, the dependent variables are ROE, and ROA, while independent variable is gearing ratio (GR). In addition, we included firm-specific control variables such as size, ages, tangibility, and asset turnover rate. U is random noise.
Empirical Analysis
Diagnostic Tests
Moreover, results of Breush-Pagan Lagrange
test demonstrate the existence of
heteroscedasticity problems in regressions. Newey-West procedure is therefore used to
tackle this problem by showing
heteroscedastic and
autocorrelation-consistent (HAC) standard errors.
Descriptive Statistics
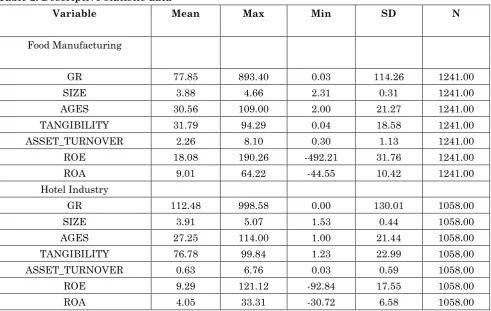
Table 2 presents the descriptive statistics for variables in food and hotel industries. 1241 observations are matched and merged for regression in food industry, while there are 1058 observations for hotel industry.
GR range from 0.03% to 893.4 % in food industry with the average at 77.85 %. ROE has a minimum of -492.21 % and a maximum of 190.26% with a mean at 18.08 %.
In terms of ROA, it ranges from -44.55 % to 64.22 % with the mean of 9.01 %. GR in hotel industry average at 112.48%, which is higher than that in food industry. Both ROE and ROA have lower mean value than food industry, 9.29% and 4.05% respectively. In terms of the variations, ROE and ROA in food industry vary more than those in hotel industry. GR in the hotel sector has higher variations.
Table 2: Descriptive statistic data
Variable Mean Max Min SD N
Food Manufacturing
GR 77.85 893.40 0.03 114.26 1241.00
SIZE 3.88 4.66 2.31 0.31 1241.00
AGES 30.56 109.00 2.00 21.27 1241.00
TANGIBILITY 31.79 94.29 0.04 18.58 1241.00
ASSET_TURNOVER 2.26 8.10 0.30 1.13 1241.00
ROE 18.08 190.26 -492.21 31.76 1241.00
ROA 9.01 64.22 -44.55 10.42 1241.00
Hotel Industry
GR 112.48 998.58 0.00 130.01 1058.00
SIZE 3.91 5.07 1.53 0.44 1058.00
AGES 27.25 114.00 1.00 21.44 1058.00
TANGIBILITY 76.78 99.84 1.23 22.99 1058.00
ASSET_TURNOVER 0.63 6.76 0.03 0.59 1058.00
ROE 9.29 121.12 -92.84 17.55 1058.00
ROA 4.05 33.31 -30.72 6.58 1058.00
The data of controlling variables such as ages, tangibility, and asset turnover is also shown in Table 2. The mean of size is similar in two industries. Assets turnover in the food industry has higher mean and higher variations in assets turnover. Meanwhile, Hotel industry has higher value in tangibility on average and this variable varies more than that in the food industry
Correlation Analysis
Table 3: Correlation analysis in food manufacturing industry
Roe Roa Gr
Pearson correlation
ROE 1 .711** -.120**
ROA .711** 1 -.290**
GR -.120** -.290** 1
Sig. ROE - .000 .000
ROA .000 - .000
GR .000 .000 -
N 1243
Note: ** Correlation is significant at the 0.01 level (2-tailed)
As shown in Table 4 below, no statistically significant correlation is found between GR
and ROE in hotel sector. However, the results indicate that the correlation between GR and ROA is weak downhill at -.123.
Table 4: Correlation analysis in hotel industry
Roe Roa Gr
Pearson correlation
ROE 1 .875** .043
ROA .875** 1 -.123**
GR .043 -.123** 1
Sig. ROE - .000 .158
ROA .000 - .000
GR .158 .000 -
N 1068
Note: ** Correlation is significant at the 0.01 level (2-tailed)
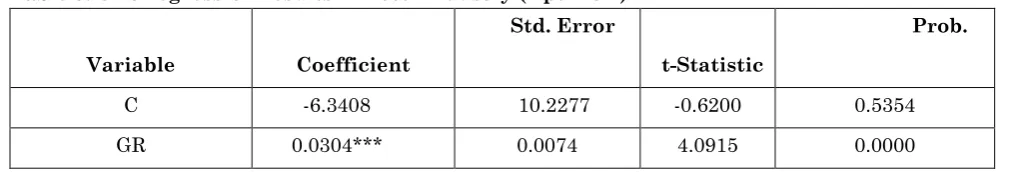
Regression Analysis Hotel Industry
OLS regression is conducted that see whether capital structure has a significant impact on financial performance in hotel industry. Table 5 presents the panel least square regression results on ROE in hotel industry with
heteroscedastic and
autocorrelation-consistent (HAC) standard errors. It can be seen that GR, size, ages, tangibility and asset turnover are significant in explaining ROE. The model explains 22.7% of the total variance of ROE (R2= 0.227). Results indicate that GR has a significant
effect on ROE (P=0.000, <0.001). However, the impact is positive rather than negative, which is contrary to what we have proposed in H1. The coefficient is 0.0304, suggesting that 1% rise of GR causes 0.0304 of increase in ROE. The model with ROE as the dependent variable in hotel industry can be written as follows: ROE=-6.3408 + 0.0304*GR
+ 4.9885*SIZE - 0.1301*AGES -
0.1309*TANGIBILITY +
10.0447*ASSET_TURNOVER
Table 5: OLS regression results in hotel industry (Dpt-ROE)
Variable Coefficient
Std. Error
t-Statistic
Prob.
C -6.3408 10.2277 -0.6200 0.5354
SIZE 4.9885** 2.2729 2.1947 0.0284
AGES -0.1301*** 0.0278 -4.6860 0.0000
TANGIBILITY -0.1309*** 0.0415 -3.1587 0.0016
ASSET_TURNOVER 10.0447*** 1.8367 5.4689 0.0000
R2: 0.2267
Adjusted R2: 0.2233
DurbinWatson:1.1038
Note: *, **, and *** represent 10%, 5% and 1% significance level
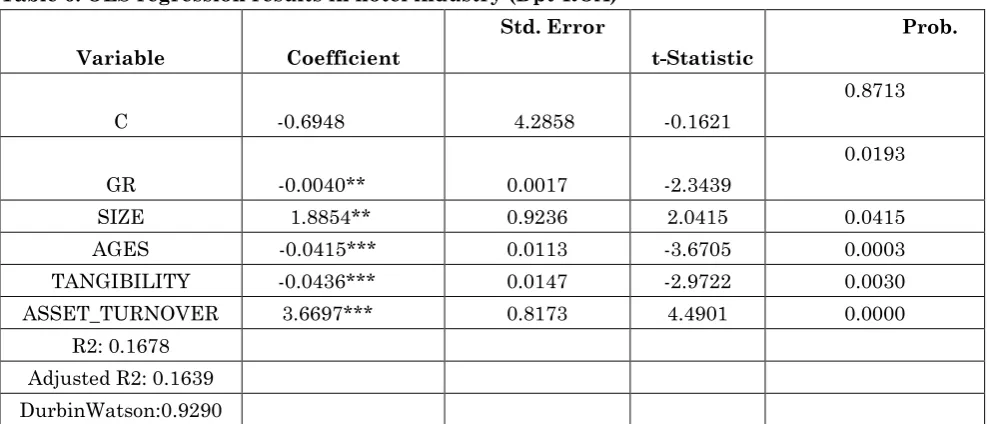
The results of regression on ROA are shown in Table 6 below. All variables including GR, size, ages, tangibility and asset turnover are significant in describing ROA. The model explains16.78% of the total variance of ROA (R2= 0.1678). Results indicate that GR is negatively associated with ROA (P=0.0193,
<0.05). The coefficient is -0.004, suggesting that 1% rise of GR create a fall of 0.004% in ROA. Therefore, H2 is supported. The model with ROA as the dependent variable in hotel industry can be written as follows: ROA = -0.6948 - 0.0040*GR + 1.8854*SIZE - 0.0415*AGES - 0.0436*TANGIBILITY + 3.6697*ASSET_TURNOVER
Table 6: OLS regression results in hotel industry (Dpt-ROA)
Variable Coefficient
Std. Error
t-Statistic
Prob.
C -0.6948 4.2858 -0.1621
0.8713
GR -0.0040** 0.0017 -2.3439
0.0193
SIZE 1.8854** 0.9236 2.0415 0.0415
AGES -0.0415*** 0.0113 -3.6705 0.0003
TANGIBILITY -0.0436*** 0.0147 -2.9722 0.0030
ASSET_TURNOVER 3.6697*** 0.8173 4.4901 0.0000
R2: 0.1678 Adjusted R2: 0.1639 DurbinWatson:0.9290
Note: *, **, and *** represent 10%, 5% and 1% significance level
Food Industry
Table 7 presents the panel least square regression results on ROE in food manufacturing sector with heteroscedastic
and autocorrelation-consistent (HAC)
standard errors. The model explains 4.8% of the total variance of ROE (R2= 0.048). Results indicate that GR has a significant effect on ROE at 10% level (P=0.0808, <0.10). The coefficient is -0.04, suggesting that for every 1% higher of GR, ROE decreases by
0.04%. Therefore, H3 is supported. Control variables including ages and asset turnover are significant at 1% level. The model regarding GR and ROE can be written as
follows: ROE = 24.0427 - 0.0394*GR -
2.0026*SIZE - 0.1392*AGES +
0.0121*TANGIBILITY +
Table 7: OLS regression results in food manufacturing industry (Dpt-ROE)
Variable Coefficient Std. Error t-Statistic Prob.
C 24.0427 19.9910 1.2027 0.2293
GR -0.0394* 0.0225 -1.7476 0.0808
SIZE -2.0026 4.5428 -0.4408 0.6594
AGES -0.1392*** 0.0437 -3.1833 0.0015
TANGIBILITY 0.0121 0.0604 0.1999 0.8416
ASSET_TURNOVER 3.8775*** 1.4961 2.5918 0.0097
R2: 0.0476
Adjusted R2: 0.0437
Durbin Watson:1.4002
Note: *, **, and *** represent 10%, 5% and 1% significance level
Tables 8 also illustrate the results of OLS regression of GR on ROA in food
manufacturing industry. The model
explains10.5% of the total variance of ROA (R2 =0.105). Results manifest that GR has a significant impact on ROA (p =0.0000, <0.001). The coefficient is -0.0281, suggesting
that every 1% higher of GR, ROA decreases by 0.0281%. Therefore, H4 is proved. Control variables except ages are not significant in describing ROA. The model concerning GR
and ROA can be written as follows: ROA
=21.2477 - 0.0281*GR - 2.2736*SIZE -
0.0478*AGES -0.0121*TANGIBILITY +
0.2777*ASSET_TURNOVER
Table 8: OLS regression results in food manufacturing industry (Dpt-ROA)
Variable Coefficient Std. Error t-Statistic Prob.
C 21.2477 9.1312 2.3269 0.0201
GR -0.0281*** 0.0031 -8.9444 0.0000
SIZE -2.2736 2.1062 -1.0795 0.2806
AGES -0.0478** 0.0200 -2.3926 0.0169
TANGIBILITY -0.0121 0.0240 -0.5049 0.6137
ASSET_TURNOVER 0.2777 0.5116 0.5429 0.5873
R2: 0.1051 Adjusted R2: 0.1015 Durbin Watson:0.9599
Note: *, **, and *** represent 10%, 5% and 1% significance level
Conclusion
This study has set out to examine the influence of capital structure on financial performance of in SMEs in hotel and food manufacturing industries in UK over the period from 2014 to 2018. Data collected from FAME were utilized to explore the relationship. ROA and ROE are used as indicators of financial performance, while capital structure is measured by gearing
ratio.
conclusion drawn by Modigliani and Miller [10], which suggests that higher level of debt could contribute financial performance.
This inverse relationship could be explained by the Pecking Order theory proposed by Myers [51], illustrating that more profitable firms employ a lower level debt than less profitable ones. According to this theory, SMEs of food manufacturing tend to utilize internal resources in preference to external resources, which results in a low degree of debt.
This trend may indicate that SMEs are encountering the difficulties in accessing to external finance, which is one of the most important failure factors in SMEs [52]. Another possible explanation for this is the Trade-off theory, which states that investors would require a high-risk premium when a firm is aggressive in financing by debt because of the concern about the risk of financial distress. As can be seen from the Table 2, the average tangibility of food manufacturing is 31.79 %, which means SMEs in food manufacturing have a low proportion of tangible asset.
As a high-risk borrower with less tangible asset which can be used as collateral, lenders are likely to require high interest to compensate for the risk. In this sense, a higher cost of capital might exceed the increase in tax shield.
However, contradictory results are found in hotel industry. Gearing ratio has a negative effect on ROA, while a positive relationship can be found between gearing ratio and ROE. A possible explanation for this result may be the difference between ROA and ROE. ROA and ROE evaluate the financial performance from different aspects, ROA indicates the efficiency of utilizing assets, while ROE shows the profitability of employing shareholders’ funds[53, 54].
Managerial Implications
The study concludes that capital structure
has an inverse relationship with the financial
performance of the SMEs in food
manufacturing industry, while capital
structure imposes mixed impacts on financial performance of SMEs in hotel industry. Financial managers should consider industry characteristics and employ an appropriate degree of financial leverage to maximize corporate value. Based on the findings of this study, it might not be recommended that SMEs in hotel industry should employ high level of debt or low level of debt to improve financial performance.
However, the model suggests that there is a negative relationship between tangibility and financial performance. To put it different, the SMEs in hotel industry with more tangible asset tend to have a poor financial performance. Since hotel industry features high capital intensive, it requires more capital to invest in tangible asset (e.g land and building).
Compared to other industry, firms with a higher proportion of tangible asset might cause higher earnings volatility. In this case, SMEs in hotel industry might implement asset-light and fee-oriented strategy, which could decrease the fixed cost by possessing less tangible asset and generate more fee income from management contracts and franchising [55].
However, the decrease in tangible asset might undermine the borrowing capability; financial managers of SMEs in hotel industry should strive a balance between Gearing ratio and tangibility in an effort to maximize profit.
Financial managers should increase the efficiency of utilizing tangible assets. Finally, under the pressure of raising funds from external, growth responsibility strategies could be conducted to handle it [56].
Limitations and Further Research
A variety of important limitations need to be
considered. First, different accounting
policies and period will impact the accuracy and comparability of data from the samples.
Secondly, capital structure and financial performance can be evaluated in a more comprehensive manner by taking more variables into consideration.
Thirdly, ratios were calculated at a point in time from financial statement, which may not reflect capital structure and financial performance fairly. A possible direction in future research can be the investigation on how industry characteristics affect choice on capital structure.
References
1. Baker HK, Martin GS (2011) Capital Structure
and Corporate Financing Decisions: Theory, Evidence, and Practice [M]: John Wiley & Sons, Incorporated.
2. Gleason KC, Mathur LK, Mathur I (2000) The
Interrelationship between Culture, Capital Structure, and Performance: Evidence from European Retailers [J]. Journal of Business Research, 50(2):185-91.
3. Lyroudi K, Lazaridis Y (2000) the cash
conversion cycle and liquidity analysis of the food industry in Greece [J].
4. Lado-Sestayo R, Vivel-Búa M (2018)
Profitability in the hotel sector: a PLS approach [J]. Journal of Hospitality and Tourism Technology, 9(3):455-70.
5. Pettit RR, Singer RF (1985) Small business
finance: a research agenda [J]. Financial management, 47-60.
6. Taiwo MA, Ayodeji AM, Yusuf BA (2012)
Impact of small and medium enterprises on economic growth and development [J].
American journal of business and
management, 1(1):18-22.
7. Aris NM 2007) SMEs: Building blocks for
economic growth [J]. Department of National Statistics, Malaysia.
8. Modigliani F, Miller MH (1958) the cost of
capital, corporation finance and the theory of investment [J]. The American economic review, 48(3):261-97.
9. Durand D (1959) the cost of capital, corporation
finance, and the theory of investment: comment
[J]. The American Economic Review,
49(4):639-55.
10. Modigliani F, Miller MH (1963) corporate
income taxes and the cost of capital: a correction [J]. The American economic review, 53(3):433-43.
11. Myers SC (1977) Determinants of corporate
borrowing [J]. Journal of financial economics, 5(2):147-75.
12. Jensen MC (1986) Agency costs of free cash
flow, corporate finance, and takeovers [J]. The American economic review, 76(2):323-9.
13. Baxter ND (1967) Leverage, risk of ruin and
the cost of capital [J]. The Journal of Finance, 22(3):395-403.
14. Miller MH (1977) Debt and taxes [J]. The
Journal of Finance, 32(2):261-75.
15. Myers SC, Majluf NS (1984) corporate
financing and investment decisions when firms have information that investors do not have [J]. Journal of financial economics, 13(2):187-221.
16. Arnold G (2013) corporate financial
management (5th ed.). [M]: Harlow: Pearson.
17. Salim M, Yadav R (2012) Capital structure and
firm performance: Evidence from Malaysian listed companies [J]. Procedia-Social and Behavioral Sciences, 65:156-66.
18. Mwangi LW, Makau MS, Kosimbei G (2014)
Accounting, Auditing and Business Ethics, 1(2):72-90.
19. Thamila K, Arulvel K (2013) the impact of the
capital structure and financial performance: a study of the listed companies traded in Colombo stock exchange [J]. Merit Research Journal of Accounting, Auditing, Economics and Finance, 1(5):106-17.
20. Ebrati MR, Emadi F, Balasang RS, Safari G
(2013) the impact of capital structure on firm performance: Evidence from Tehran Stock Exchange[J]. Australian Journal of Basic and Applied Sciences, 7(4):1-8.
21. Zeitun R, Tian GG (2007) Capital Structure
and Corporate Performance: Evidence from Jordan[J]. Australasian Accounting, 1(4):40-61.
22. Nirajini A, Priya K (2013) Impact of capital
structure on financial performance of the listed trading companies in Sri Lanka [J]. International Journal of Scientific and Research Publications, 3(5):1-9.
23. Gill A, Biger N, Mathur N (2011) the effect of
capital structure on profitability: Evidence from the United States [J]. International Journal of Management, 28(4):3.
24. El-Sayed Ebaid I (2009) the impact of
capital-structure choice on firm performance: empirical evidence from Egypt [J]. The Journal of Risk Finance, 10(5):477-87.
25. Enekwe CI, Agu CI, Eziedo K (2014) the effect
of financial leverage on financial performance: evidence of quoted pharmaceutical companies in Nigeria [J]. IOSR Journal of Economics and Finance, 5(3):17-25.
26. Phillips PA, Sipahioglu MA (2004) Performance
implications of capital structure: evidence from quoted UK organisations with hotel interests
[J]. The Service Industries Journal,
24(5):31-51.
27. Rasinger SM (2013) Quantitative research in
linguistics: An introduction [M]: A&C Black.
28. Saunders M, Lewis P, Thornhill A (2015)
Research methods for business students [M]: Pearson education.
29. Connolly P (2007) Quantitative data analysis in
education: A critical introduction using SPSS [M]: Rout ledge.
30. FAME (2016) Product review of Fame: Bureau
van Dijk: Available from: Retrived from https://www.bvdinfo.com/en-gb/our-products/da ta/national/fame.
31. Cavaco S, Crifo P (2014) CSR and financial
performance: complementarity between
environmental, social and business behaviours [J]. Applied Economics, 46(27):3323-38.
32. Morali O, Searcy C (2013) A review of
sustainable supply chain management
practices in Canada [J]. Journal of business ethics, 117(3):635-58.
33. Sroufe R, Gopalakrishna-Remani V (2018)
Management, Social Sustainability,
Reputation, and Financial Performance
Relationships: An Empirical Examination of US Firms [J]. Organization & Environment, 1-32.
34. Wang H, Qian C (2011) corporate philanthropy
and corporate financial performance: The roles of stakeholder response and political access [J].
Academy of Management Journal,
54(6):1159-81.
35. Alshehhi A, Nobanee H, Khare N (2018) the
impact of sustainability practices on corporate financial performance: Literature trends and future research potential [J]. Sustainability, 10(2):1-25.
36. Delcea C, Bradea I, Paun R, Friptu A (2015) a
healthcare companies’ performance view through OSN. New Trends in Intelligent Information and Database Systems: Springer, 333-42.
37. Muradoğlu YG, Sivaprasad S (2012) Capital
structure and abnormal returns [J].
International Business Review, 21(3):328-41.
38. Schwartz E (1959) Theory of the Capital
Structure of the Firm [J]. The Journal of Finance, 14(1):18-39.
39. Rajan RG, Zingales L (1995) what do we know
40. Waddock SA, Graves SB (1997) the corporate social performance–financial performance link
[J]. Strategic Management Journal,
18(4):303-19.
41. Zhao M (2012) CSR-based political legitimacy
strategy: Managing the state by doing good in China and Russia [J]. Journal of Business Ethics, 111(4):439-60.
42. Wang H, Choi J, Li J (2008) too little or too
much? Untangling the relationship between corporate philanthropy and firm financial
performance [J]. Organization Science,
19(1):143-59.
43. Coad A, Segarra A, Teruel M (2013) Like milk
or wine: Does firm performance improve with age?[J]. Structural Change and Economic Dynamics, 24:173-89.
44. Fort TC, Haltiwanger J, Jarmin RS, Miranda J
(2013) How firms respond to business cycles: The role of firm age and firm size[J]. IMF Economic Review, 61(3):520-59.
45. Öztekin Ö (2015) Capital structure decisions
around the world: which factors are reliably important? [J]. Journal of Financial and Quantitative Analysis, 50(3):301-23.
46. Muritala TA (2018) an empirical analysis of
capital structure on firms’ performance in Nigeria [J]. IJAME.
47. Tippayawong K, Tiwaratreewit T, Sopadang A
(2015) Positive influence of green supply chain operations on Thai electronic firms’ financial
performance [J]. Procedia engineering,
118:683-90.
48. Kao EH, Yeh CC, Wang LH, Fung HG (2018)
the relationship between CSR and
performance: Evidence in China [J].
Pacific-Basin Finance Journal, 51:155-70.
49. Onaolapo AA, Kajola SO (2010) Capital
structure and firm performance: evidence from Nigeria [J]. European Journal of Economics,
Finance and Administrative Sciences,
25(1):70-82.
50. Tabachnick BG, Fidell LS, Ullman JB (2007)
Using multivariate statistics [M]. Boston: Pearson.
51. Myers SC (1984) the capital structure puzzle
[J]. The journal of finance, 39(3):574-92.
52. Franco M, Haase H (2010) Failure factors in
small and medium-sized enterprises:
qualitative study from an attributional
perspective [J]. International
Entrepreneurship and Management Journal, 6(4):503-21.
53. Andrew WP, Schmidgall RS, Damitio JW
(2007) financial management for the
hospitality industry [M]: Pearson Prentice Hall Upper Saddle River, NJ.
54. Palepu KG, Healy PM (2008) Business analysis
& valuation: Using financial statements (4th Ed.)[M]. Mason, OH: Thompson Higher Education.
55. Li Y, Singal M (2019) Capital structure in the
hospitality industry: The role of the asset-light and fee-oriented strategy [J]. Tourism Management, 70:124-33.
56. Fleck DL (2010) why we should dare to manage