I
nsurance and reinsurance companies are an important and growing class of financial market participants. They insure a wide vari-ety of business and household risks, thereby facilitating economic and financial activity. In addition, amid a drive to raise profitability they have become increasingly important investors and intermediaries in a broad range of financial markets around the globe. They bring innovative insurance approaches to capital markets, provid-ing insurance cover for financial risks, interme-diating their own insurance risks in the markets, and in the process developing new instruments that help to bridge the gap between banking and insurance products. Insurers and reinsurers have broadened the range of available instru-ments, increased the diversity of market partici-pants, created new opportunities for corpora-tions and financial institucorpora-tions to fund their activities and hedge risks, and contributed to liquidity and price discovery in primary and sec-ondary markets.Compared with commercial and investment banking, much less is known about the financial activities of insurance and reinsurance compa-nies and the overarching environment in which insurance and reinsurance companies conduct their core businesses. This chapter tries to fill part of this gap by identifying issues that are likely to attract increasing attention and that may have medium-term implications for finan-cial stability and/or efficiency. The first section of this chapter discusses the size and structure of insurers’ and reinsurers’ financial activities and how they have evolved in recent years. The sec-ond section explores some of the more forward-looking financial stability issues, including those
surrounding a number of uncertainties about in-surers’ and reinin-surers’ financial market activi-ties, and the attendant potential implications for financial efficiency and stability in the medium term.
Insurance and Reinsurance
Financial Activities
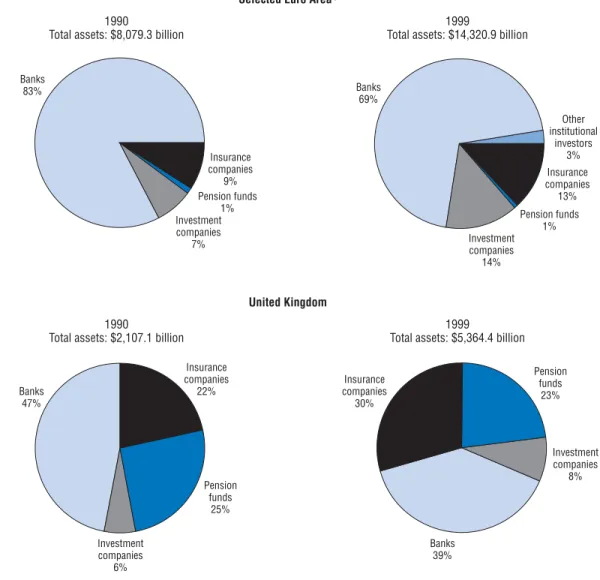
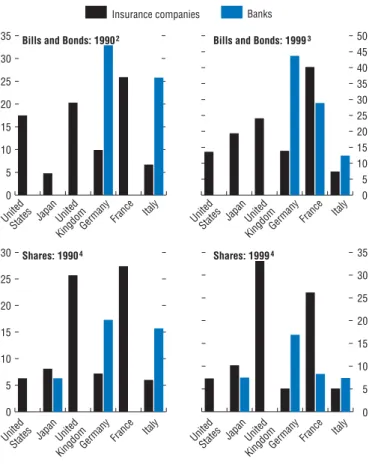
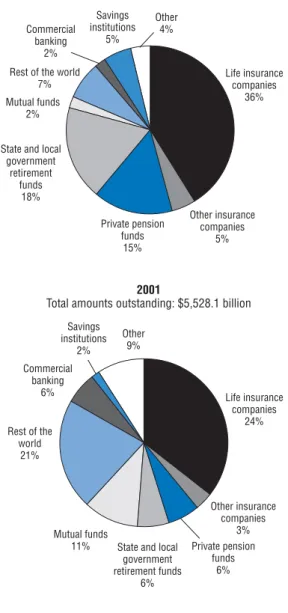
Insurance companies’ asset holdings grew substantially during the 1990s, including relative to banks. Between 1990 and 1999, the financial assets of insurers in seven major countries grew by 150 percent to over $10 trillion, while the assets of banks in the same countries grew by 50 percent to $25 trillion (Figures 3.1 and 3.2).1 In most countries, insurance companies hold larger amounts of financial securities than banks (Figure 3.3). Moreover, their holdings of international and domestic securities are large relative to domestic markets (Figure 3.4).2 For example, U.S. insurers are the largest domestic investors in corporate and foreign bonds (Figure 3.5). Insurance companies’ large asset pools are mainly invested conserva-tively, consistent with regulatory restrictions, although the composition of asset portfolios varies substantially across countries (Figures 3.6 and 3.7).3
In addition to investing, life insurance compa-nies offer retail financial products in the form of hybrid insurance contracts/mutual funds. These are growing rapidly in some countries. In the United States, about half of all new life insur-ance policies are unit-linked (linked to market returns). Such products are also popular in Europe, where they may have tax advantages
1The seven countries are France, Germany, Italy, Japan, Switzerland, the United Kingdom, and the United States. 2For most countries, holdings of securities are not broken down into domestic and foreign. It is therefore impossible to
make cross-country comparisons of domestic holdings relative to domestic market size.
Insurance companies 19% Insurance companies 15% Insurance companies 16% Insurance companies 28% Pension funds 25% Pension funds 27% Pension funds 8% Investment companies 11% Investment companies 5% Investment companies 25% Investment companies 5% Other institutional investors 12% Other institutional investors 13% Other institutional investors 8% Other institutional investors 4% Banks 33% Banks 67% Banks 24% Banks 55% 1990
Total assets: $7,322.1 billion
1999
Total assets: $11,256.2 billion
Figure 3.1. Total Financial Assets of Institutional Investors and Banks: United States and Japan
Source: Organization for Economic Cooperation and Development.
Japan
1990
Total assets: $10,159.7 billion
1999
Total assets: $25,447.3 billion
Figure 3.2. Financial Assets of Institutional Investors and Banks: Selected Euro Area Countries and United Kingdom Insurance companies 9% Insurance companies 22% Insurance companies 30% Insurance companies 13% Pension funds 1% Pension funds 25% Pension funds 23% Pension funds 1% Investment companies 7% Investment companies 6% Investment companies 8% Investment companies 14% Other institutional investors 3% Banks 83% Banks 47% Banks 39% Banks 69% 1990
Total assets: $8,079.3 billion
1999
Total assets: $14,320.9 billion
Selected Euro Area1
1990
Total assets: $2,107.1 billion
1999
Total assets: $5,364.4 billion
United Kingdom
Source: Organization for Economic Cooperation and Development. 1Selected euro area countries are France, Germany, and Italy.
over mutual funds. In Italy, they include single-premium, unit-linked products, which exchange a large up-front payment for a mutual fund that incorporates a life insurance policy. Such prod-ucts are often sold through bancassurancegroups or joint ventures between banks and insurance firms.
Influences on Insurers’ Profits and Approaches to Their Financial Activities
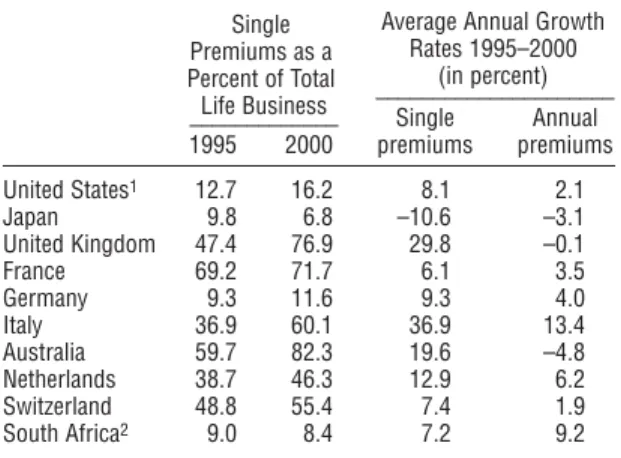
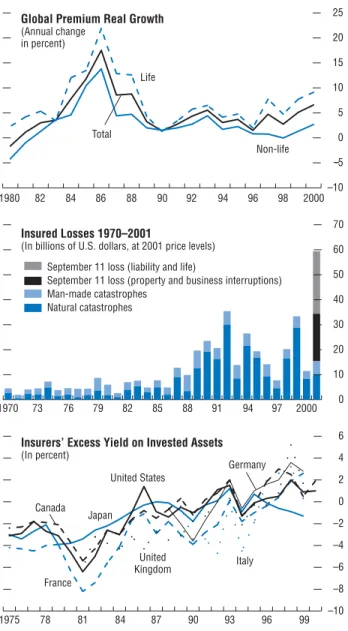
The overall profitability of an insurance company depends on the net profitability of its insurance underwriting and financial activities. Three main factors influence this profitability. First, the incidence and size of claims. Notable increases in non-life insured losses arose follow-ing Hurricane Andrew in 1992 and September 11 in 2001 (Figure 3.8). Second, the prevailing level of premiums. During the 1990s, premiums have tended to grow at an inflation-adjusted rate of about 5 percent (higher for life, lower for non-life)—well below average rates attained during the 1980s (see Figure 3.8 and Table 3.1). Third, the performance of financial markets. Since the early 1980s, insurance companies in the major countries have been increasingly suc-cessful in reaping investment returns that com-pare favorably with the yield on domestic gov-ernment bonds (see Figure 3.8).
0 500 1000 1500 2000 2500 3000 3500 Italy France Germany United Kingdom Japan United States 0 500 1000 1500 2000 2500 3000 3500 Italy France Germany United Kingdom Japan United States Insurance companies Banks
Figure 3.3. Holdings of Financial Securities by Insurance Companies and Banks
(In billions of U.S. dollars)
1990
1999
Insurance companies Banks
Source: Organization for Economic Cooperation and Development.
Table 3.1. Life Insurance: Premium Growth Rates
Single Average Annual Growth
Premiums as a Rates 1995–2000
Percent of Total _____________________(in percent)
Life Business Single Annual
_____________ 1995 2000 premiums premiums United States1 12.7 16.2 8.1 2.1 Japan 9.8 6.8 –10.6 –3.1 United Kingdom 47.4 76.9 29.8 –0.1 France 69.2 71.7 6.1 3.5 Germany 9.3 11.6 9.3 4.0 Italy 36.9 60.1 36.9 13.4 Australia 59.7 82.3 19.6 –4.8 Netherlands 38.7 46.3 12.9 6.2 Switzerland 48.8 55.4 7.4 1.9 South Africa2 9.0 8.4 7.2 9.2
Source: Swiss Re, sigmaNo. 6/2001.
1Only personal life business. 2Time period 1995–99.
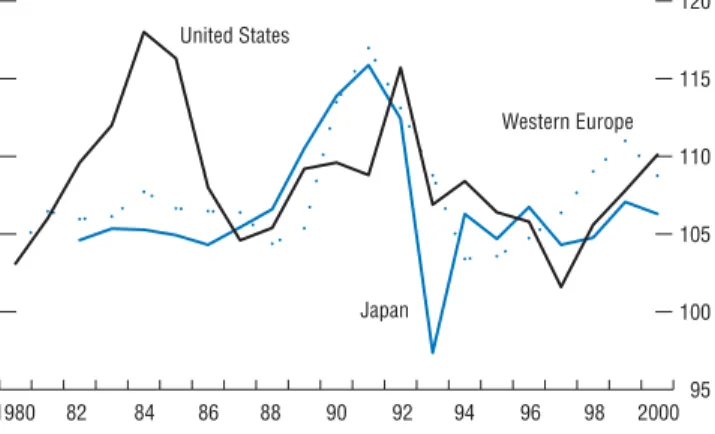
Since the mid-1990s, non-life insurance loss ratios (relative to premiums) ranged from 57 percent in Japan to 85 percent in France (see Table 3.2). Expense-to-premium ratios ranged from 23 percent in France to 36 percent in Japan. Adding these two ratios into the “com-bined ratio” gives a standard, widely used meas-ure of the overall profitability of an insurance company’s core underwriting business (apart from the return on its market investments). As Table 3.2 and Figure 3.9 show, in most countries, non-life insurers had combined ratios above 100 percent, implying that on a cash-flow basis and excluding investment returns, insurance under-writing was loss-making. Except in Germany and Japan, losses plus expenses exceeded premiums by 5 percent to 14 percent. In Japan and Germany, returns on underwriting were 3.3 per-cent and 1.5 perper-cent, respectively.4
Non-life insurers in these countries made up for underwriting losses, or augmented under-writing returns, through investment. Investment yields ranged from 2.9 percent in Japan (reflect-ing low government bond yields and declin(reflect-ing stock prices) to 9 percent in the United
Kingdom, and translated into investment results (expressed as a percent of premiums) ranging from 12.5 percent to 24.6 percent in the respec-tive countries. Net of taxes and other expenses, underwriting and investment results translated into profit margins from 0.8 percent (Italy) to 10.7 percent (United Kingdom), and returns on equity from 2.9 percent (Germany) to 10.1 per-cent (United Kingdom).
Reaping strong investment returns has been especially important for life insurance compa-nies that have high guaranteed rates of nominal return on existing policies. In the 1980s and early 1990s, insurance companies offered high guaranteed returns on insurance policies, flecting the ability to earn very strong market re-turns on asset portfolios, high premium in-0 5 10 15 20 25 30 35 0 5 10 15 20 25 30 35 40 45 50 0 5 10 15 20 25 30 5 0 10 15 20 25 30 35 Insurance companies Banks
Bills and Bonds: 19902
Figure 3.4. Holdings of Securities Relative to Domestic Market Size1
(In percent)
Bills and Bonds: 19993
Shares: 19904 Shares: 19994
United
States Japan United KingdomGermany
France Ita ly
United
States Japan United KingdomGermany
France Italy
United
States Japan United KingdomGermany
France Ita ly
United
States Japan United KingdomGermany
France Italy
Source: Organization for Economic Cooperation and Development. Note: For banks, if a bar is not shown, data are not available. 1Bank holdings include resident and nonresident holdings.
2For France, Germany, and Italy, data refer to resident and nonresident holdings. 3For France and Germany, data refer to resident and nonresident holdings. 4Holdings of shares include resident and nonresident holdings.
4In the late 1990s, the positive results in Germany and
Japan partly reflect accounting conventions that exclude some expenses or include investment income in the com-bined ratio. See Swiss Re (2001).
comes, and, in some countries, high minimum rates mandated by regulators. As nominal bond yields sank during the 1990s amid declining in-flation and the euro area convergence process, meeting these guarantees became more chal-lenging. In Japan and Switzerland, government bond yields slid below guaranteed rates on exist-ing policies.
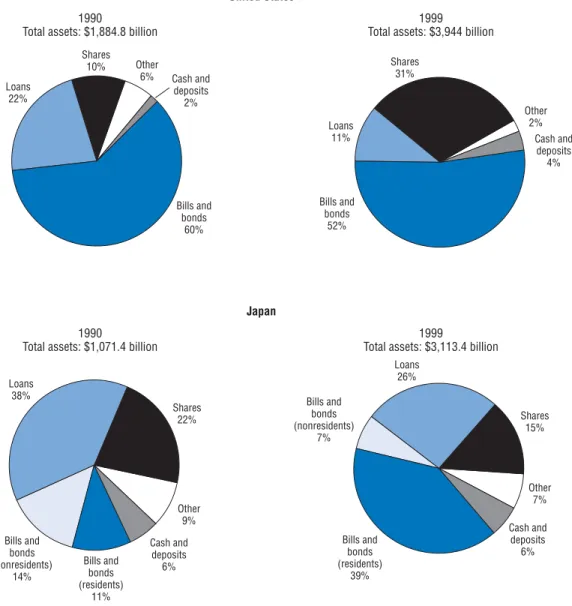
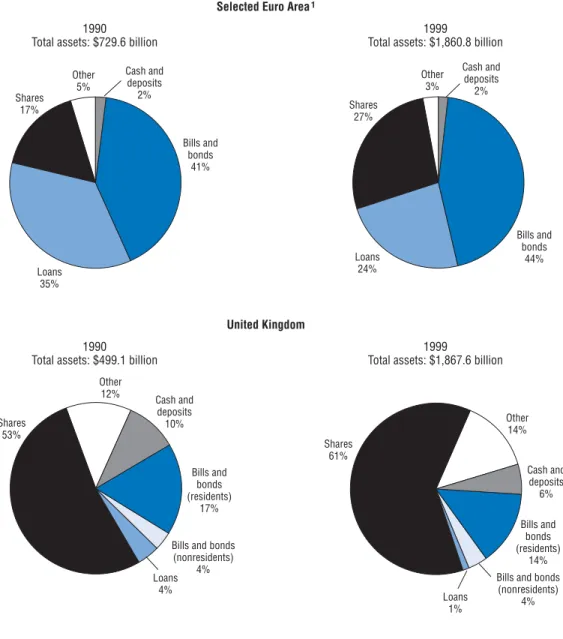
During the 1990s, insurers responded to an environment of lower real premium growth by managing asset portfolios more actively and shifting the asset mix into potentially more volatile investments. Between 1990 and 1999, in-surers’ investments in corporate equities rose from 17 percent to 27 percent in the euro area, from 53 percent to 61 percent in the United Kingdom, and from 10 percent to 31 percent in the United States.5In addition, the development of emerging market and corporate bond mar-kets, including the market for lower-rated cred-its, offered insurance companies opportunities to raise investment returns. Active asset manage-ment together with realized capital gains from rising bond and share prices enabled insurance companies in most countries to earn an invest-ment yield above that of the long-term govern-ment bond yield in their home country (see Figure 3.8).
The Recent Shift into Newer Financial Market Activities
In the 1990s, periods of soft premiums and low bond yields also spurred innovations that fostered convergence between insurance and capital markets. Insurers divested less profitable insurance risks in the form of catastrophic risk (“Cat”) bonds—bonds with payoffs linked to a catastrophic event. Reinsurers have also diversi-fied their insurance business by developing the profitable “alternative risk transfer” (ART) mar-ket for customized reinsurance products that
Figure 3.5. United States: Corporate and Foreign Bonds
(As a percentage of total amounts outstanding; end of period)
Source: U.S. Flow of Funds.
Life insurance companies 36% Life insurance companies 24% Other insurance companies 5% Other insurance companies 3% Private pension funds 15% Private pension funds 6% State and local
government retirement
funds 18%
State and local government retirement funds 6% Mutual funds 2% Mutual funds 11% Rest of the world
7% Rest of the world 21% Commercial banking 2% Commercial banking 6% Savings institutions 5% Savings institutions 2% Other 4% Other 9% 1980
Total amounts outstanding: $507.6 billion
2001
Total amounts outstanding: $5,528.1 billion
5Some of the shift in equity allocations may reflect
stock price changes. In Japan, for example, the share of insurers’ assets allocated to shares shrank from 22 to 15 percent.
Other 6% Other 9% Other 7% Loans 11% Shares 31% Shares 10% Shares 22% Shares 15% Loans 22% Loans 38% Loans 26% Cash and deposits 2% Cash and deposits 6% Cash and deposits 6% Bills and bonds 60% Bills and bonds (residents) 11% Bills and bonds (residents) 39% Bills and bonds (nonresidents) 14% Bills and bonds (nonresidents) 7% Bills and bonds 52% Cash and deposits 4% Other 2%
Figure 3.6. Balance Sheet Assets of Insurance Companies: United States and Japan
1990
Total assets: $1,884.8 billion
1999
Total assets: $3,944 billion
United States
1990
Total assets: $1,071.4 billion
1999
Total assets: $3,113.4 billion
Japan
Figure 3.7. Balance Sheet Assets of Insurance Companies: Selected Euro Area Countries and United Kingdom
1990
Total assets: $729.6 billion
1999
Total assets: $1,860.8 billion
Selected Euro Area1
1990
Total assets: $499.1 billion
1999
Total assets: $1,867.6 billion
United Kingdom Other 5% Other 12% Other 14% Other 3% Shares 17% Shares 53% Shares 61% Shares 27% Loans 35% Loans 4% Loans 24% Cash and deposits 2% Cash and deposits 10% Cash and deposits 6% Cash and deposits 2% Bills and bonds 41% Bills and bonds 44% Loans 1% Bills and bonds (residents) 17% Bills and bonds (residents) 14% Bills and bonds
(nonresidents) 4%
Bills and bonds (nonresidents)
4%
Source: Organization for Economic Cooperation and Development. 1Selected euro area countries are France, Germany, and Italy.
bridge the gap between traditional insurance and banking products.6Examples include con-tingent capital, which gives an insurance com-pany the option to replenish its capital if it is ad-versely affected by a natural catastrophe; captive insurance, which permits large conglomerates to insure themselves by pooling risks in a separate entity; and finite reinsurance, which is a form of self-insurance that permits a policy holder to spread an insurance loss over a predetermined period of time.
Insurance companies also sought to diversify their large investment portfolios and funding sources. For example, they became more impor-tant participants in credit derivatives markets, helping banks to hedge and diversify their credit exposures.7Market participants have also charac-terized them as more active buyers of collateral-ized debt obligations (CDOs), private equity, funds of hedge funds, and reverse convertible se-curities. On the funding side, U.S. life insurance companies have issued funding arrangements (FAs) and guaranteed investment contracts (GICs), issuance of which grew rapidly to about $40 to $50 billion (JP Morgan, 2001). According to market participants, funds were generally in-vested in higher-yielding securities with similar maturities to the FA/GIC, generating a positive spread.
In 2001, the deterioration in credit and equity markets and huge claims associated with
September 11 adversely affected insurers’ profits and caused the failure of a few weaker, lower-tier institutions. Subsequently, an improved appreci-ation of the risks in newer activities, and a firm-ing of insurance premiums amid an increase in –10 -5 0 5 10 15 20 25 –10 –8 –6 –4 –2 0 2 4 6 0 10 20 30 40 50 60 70
Figure 3.8. Global Insurance Industry Results
Global Premium Real Growth
(Annual change in percent)
Insured Losses 1970–2001
(In billions of U.S. dollars, at 2001 price levels)
Insurers’ Excess Yield on Invested Assets
(In percent) – Life Non-life Total United States Canada France United Kingdom Italy Germany Japan
September 11 loss (liability and life)
September 11 loss (property and business interruptions) Man-made catastrophes Natural catastrophes 1980 1970 1975 78 81 84 87 90 93 96 99 73 76 79 82 85 88 91 94 97 2000 82 84 86 88 90 92 94 96 98 2000
Source: Swiss Re Economic Research and Consulting.
6Major reinsurers characterize rates of return on equity
in the ART business as in the range of 20 to 25 percent, well above typical rates for traditional reinsurance business.
7See International Monetary Fund (2002), Chapter III.
It has frequently been suggested that differences in the regulatory treatment of financial risks between banks and insurers may have created opportunities for regulatory ar-bitrage, but the Joint Forum cautions that “comparisons of individual elements of the different capital frameworks are potentially inappropriate and misleading” (Joint Forum 2001a, p. 5).
demand for insurance, led a number of insur-ance companies to re-evaluate their capital mar-kets activities. In addition, market participants suggest that a number of less-active firms with-drew from activities such as ART and credit de-rivatives. As a consequence, these newer activi-ties are seen as concentrated among a few, large players. Over time, higher premiums may heighten competition in the insurance business, putting downward pressure on premiums and leading to a renewed interest in newer activities.
Financial Efficiency and Stability
Questions Raised by Insurers’
Financial Activities
As noted above, much less is known about the environment in which insurance and reinsur-ance companies operate, and about important aspects of the regulatory framework. The re-mainder of this chapter examines five forward-looking financial stability issues with the objec-tive of understanding the challenges that lie ahead for the insurance and reinsurance indus-tries and more generally for the international
fi-nancial community: the balance of official over-sight and market discipline; information about financial markets activities; the legal frameworks for insurance and financial markets; leverage in individual firms and the overall industry; and sys-temic implications, if any, of insurance- and rein-surance-company instability.
Official Oversight and Market Discipline: Is the Balance Still Right?
As with commercial and investment banking, the soundness of insurance and reinsurance companies and the financial stability of these in-dustries rely on both official oversight and pri-vate market discipline. The regulatory and su-pervisory framework for insurance is primarily oriented toward policyholder protection, by en-suring that reserves and capital are adequate, and investments are relatively safe and liquid, so that insurers can pay claims and other cash flows to policyholders on a timely basis. Insurers usu-ally face restrictions on the concentration of bal-ance-sheet investments in asset classes such as fixed income, equity, and real estate.8 Table 3.2. Profitability Decomposition of Major Non-Life Markets
(In percent of net premiums)
United States Canada United Kingdom Germany France Italy Japan
1996–2000 1996–2000 1996–99 1995–99 1995–99 1995–99 1995–99
Loss ratio 77.5 73.4 75.4 70.5 84.5 85.7 56.7
Expense ratio 27.4 32.0 32.5 25.3 22.5 27.1 35.7
Underwriting result1 –6.5 –5.7 –7.9 1.5 –8.3 –14.1 3.3
Investment yield2 7.0 8.3 9.0 7.2 5.8 7.8 2.9
Net investment result 18.8 16.5 24.6 15.7 15.4 15.8 12.4
Other expenses/earnings –0.1 0.9 –2.7 –6.6 –1.5 1.9 –11.8
Profit margin (pre-tax) 12.2 11.7 14.0 10.5 5.7 3.1 3.9
Tax rate2 21.2 29.4 24.0 60.3 41.6 87.6 69.93
Profit margin (after-tax) 9.6 7.9 10.7 4.1 3.4 0.8 1.0
Solvency 106.1 84.9 102.7 145.44 111.5 . . . . . .
ROE2 9.1 9.4 10.1 2.94 3.2 . . . . . .
Source: Swiss Re, sigmaNo. 5/2001.
Note: Loss, expense, policyholder dividend and combined ratios for the United States, Canada, and the United Kingdom are net of reinsurance, whereas for Germany, France, Italy, and Japan they are for direct business (prior to cessions to reinsures).
1Includes policyholder dividend.
2Level, rather than in percentages of net premiums.
3Excludes 1999 because in 1999 taxes were paid despite pre-tax losses, resulting in a calculated negative 631 percent tax rate for 1999. 4For 1998 and 1999.
Regulation of off-balance-sheet instruments ranges from broad guidelines to outright prohi-bition of derivatives transactions that do not directly hedge risks associated with insurance business.9
Reflecting its policyholder protection orienta-tion and the fact that insurers are not deposit-taking institutions, official oversight of the in-surance industry in many jurisdictions is less focused on financial market risks compared with the official oversight of commercial banks. For example, EU capital requirements exclu-sively reflect the volume of insurance business. In Australia, Canada, Japan, and the United States the regimes include capital charges for risks on the asset side of the balance sheet, but questions nonetheless remain about whether the underlying risks are adequately measured and fully reflected in capital.10The major Australian insurer HIH filed for liquidation in March 2001, but its administrator reported that it was insolvent as early as June 2000 and possi-bly earlier.11In Japan, there are questions raised by the extent to which capital is in the form of deferred tax credits and one year’s future in-come, and whether risk weights for equity and other exposures are adequate (see Fukao and JCER, 2002).
Reinsurance regulation is less uniform across countries than insurance regulation. In some countries—including Australia, Denmark, Finland, Japan, Portugal, the United Kingdom, and the United States—reinsurers face regula-tions similar to those applied to primary insur-ers; in others they are unsupervised. Many reinsurers are located in offshore centers where 95 100 105 110 115 120 United States Japan Western Europe
Figure 3.9. Non-Life Insurance: Combined Ratios in the Industrial Countries
(In percent)
1980 82 84 86 88 90 92 94 96 98 2000
Source: Swiss Re Economic Research and Consulting.
9For example, relevant EU Directives provide that
deriv-atives may be used to hedge risks or “facilitate efficient portfolio management,” whereas the German regulatory authority publishes a list of permitted derivatives instru-ments and restricts how they may be used.
10In 2001, the U.K. Financial Services Authority
pro-posed the introduction of more flexible prudential stan-dards for insurance companies, along the conceptual lines of the Basel Capital Accord’s three-pillar approach (Davies, 2001).
11Improved insurance legislation will come into effect
they face particularly light regulation and super-vision, reflecting a view that the wholesale partic-ipants in the reinsurance market are more so-phisticated and well-informed than the retail participants in the primary insurance market, and therefore are better able to assess the risks of their counterparties. Nevertheless, the limited regulation of reinsurers in some jurisdictions has raised concerns that reinsurance regulation may need strengthening, and that reinsurance arrangements may reduce the transparency of insurance company accounts and/or transfer less risk than is apparent.12
Supervisory frameworks for insurers and rein-surers have been under active discussion in the official community. The Joint Forum of banking, securities, and insurance supervisors has under-scored key differences in risk management prac-tices and regulatory capital requirements across the three sectors (Joint Forum, 2001a and b). The International Association of Insurance Supervisors (IAIS) “Principles on Capital Adequacy and Solvency” recommend that capital adequacy and solvency regimes should be sensi-tive to risks in investments and off-balance-sheet exposures. The IAIS expects to have principles for the supervision of reinsurance companies ready for members’ approval at the 2002 Annual Meeting. The 2002 EU “Solvency I” Directives improved solvency requirements, increased su-pervisors’ powers for early intervention, and al-lowed member states to put in place more strin-gent solvency requirements. An ongoing “Solvency II” project will consider issues includ-ing asset-liability matchinclud-ing, treatment of reinsur-ance cover, accounting and actuarial policies, and “double gearing” within financial conglom-erates. In addition, observance of insurance core principles in IMF member countries are assessed under the IMF/World Bank Financial Sector
Assessment Program (FSAP) (see IMF and World Bank, 2001).
Because official oversight is oriented more to-ward policyholder protection than managing fi-nancial market risks, the soundness of insurers and reinsurers relies heavily on market disci-pline. For example, credit rating agencies in-form policyholders and creditors about insurers’ financial strength and insurers strive for high ratings to maintain investors’ and policyholders’ confidence. In addition, risk managers at some banks partly rely on credit ratings in evaluating their counterparty risk exposures to insurers and the risks in financial products sold by insurers. Finally, counterparties increasingly use Standard and Poor’s assessments of risk-based capital that are based on its proprietary capital adequacy model.
Reflecting these considerations, market partic-ipants—and some officials—see the credit rating agencies as the virtual de facto regulators for in-surers and reinin-surers.13Ratings agencies are un-comfortable with this perception and role. Seasoned analysts see insurance companies as opaque and complex, and find it difficult to fully evaluate insurers’ financial market activities and assess whether the risks are well managed. Similarly, some counterparty institutions of in-surers and reinin-surers question whether ratings fully reflect the potential counterparty risks. These institutions have further developed their internal credit analysis of their exposures to in-surers and reinin-surers, and tightened counter-party risk management vis-à-vis insurers, includ-ing by takinclud-ing more collateral.
Are Disclosure and Transparency Adequate? Less information seems to be available—to of-ficials and private financial stakeholders—on the
12IAIS (2000), p. 4; and European Commission (2002a). IAIS (2002) discusses supervisory standards for evaluation of
reinsurance cover. The Chairman of the U.K. Financial Services Authority recently remarked that a collapsed U.K. insur-ance company had “financial reinsurinsur-ance treaties, of doubtful value, with unregulated reinsurers”(Davies, 2002).
13For example, IAIS (2000, p. 51) refers to rating agencies as “private market supervisors.” IAIS (2002, p. 3) notes that
“reinsurers in some jurisdictions are directly supervised; other jurisdictions rely on rating agencies in assessing the security of a reinsurer.” European Commission (2002a, Chapter 9) discusses the rating agencies’ role in the market disciplining mechanism for insurance companies.
market activities of insurance companies com-pared with the activities of commercial and in-vestment banks, particularly in four areas.
First, there are limited official data to assess whether capital adequately supports insurers’ fi-nancial risks. Regulatory reports typically contain limited information on risks in the asset side of the balance sheet and on off-balance-sheet activi-ties in the derivatives markets. In addition, fea-tures of accounting standards, such as limited application of mark-to-market or fair-value ac-counting to liabilities and the opacity of often subjective actuarial assumptions underlying valu-ations (including of liabilities), may reduce the usefulness of reported data.
Second, relatively little is known about whether insurance companies’ management of market and credit risks has kept pace with their growing involvement in the markets. Although some major insurers have sophisticated financial modeling systems, market participants, credit rating agencies, and officials have raised ques-tions about the effectiveness of some insurers’ and reinsurers’ internal risk management and controls for managing their asset-market activi-ties as well as the market risks (mostly interest-rate risk) embedded in their liabilities.14For ex-ample, life insurers have relied on careful analysis of mortality probabilities, based on de-tailed and lengthy panel data, in pricing insur-ance premiums. Because mortality risk is rela-tively stable over time, profit and loss flows on portfolios of life insurance contracts have been fairly predictable. Market participants suggest that some insurers have tried to adapt the actu-arial approach to managing the risks in their fi-nancial activities. This strategy is seen as having drawbacks, particularly for credit investments where data are lacking and where default proba-bilities can change sharply and unpredictably
with economic and financial developments. These insurers have reportedly since bolstered their credit risk analysis to bring it closer to the standards attained by banks, but the actual ex-tent of progress is unknown.15
Third, regulatory and shareholder reports do not consistently disclose the size of or amount at risk in off-balance-sheet positions, or the extent to which derivatives are used for hedging versus yield enhancement. The only aggregate informa-tion on insurers’ involvement in over-the-counter (OTC) derivatives appears to be the sur-vey figures compiled by the British Bankers Association on the credit derivatives market.
Fourth, the migration of financial risks be-tween insurance companies and other financial institutions makes it more challenging to track the distribution of risks in financial systems.16 This raises questions about the extent of their participation in segments such as CDOs and as-set-backed commercial paper. More generally, it would be appropriate for insurers to disclose in-formation by risk type across all products. There are also questions about the extent to which fi-nancial institutions have used fifi-nancial insur-ance contracts, particularly in place of deriva-tives contracts, to hedge financial risks.
How Well Understood Are the Legal Risks in Financial Insurance Contracts?
Financial insurance contracts between insur-ance companies and the internationally active commercial and investment banks have given rise to some high-profile legal disputes. For ex-ample, in the “Hollywood Funding” transactions, structured notes issued to finance a number of films to be made by Flashpoint Ltd. included credit enhancements in the form of insurance policies written by Lexington Insurance, a
sub-14The IAIS recently noted that “it is questionable whether insurance undertakings—and the insurance supervisors—still
have adequate insight into the professionalism and appropriateness of the reinsurance companies, and in the risk expo-sure policy of globally active reinsurance companies” (IAIS, 2000, p. 4).
15See FSA (2002, p. 31). European Commission (2002b, p. 53) suggests that “asset risk...is often more significant in the
risk profile than many insurers believe.”
16International Monetary Fund (2002), Chapter III, suggested that the activities of nontraditional investors in credit risk
sidiary of American International Group. Bondholders evidently understood the credit en-hancements to be in the form of credit guaran-tees, which require the insurer to pay the bond-holders upon default. Lexington has argued that the contracts allowed it to refuse to pay if a spec-ified number of films were not produced, and also allowed it to dispute or investigate claims prior to paying. In the event, Flashpoint de-faulted before the specified number of films was made, and Lexington asserted a right to investi-gate the claim and delay payment. The matter is still under dispute.
In another high-profile case, JP Morgan and Enron were counterparties in forward contracts involving physical delivery of natural gas and oil to JP Morgan involving a special purpose vehi-cle, Mahonia. Through this vehivehi-cle, JP Morgan obtained surety bonds from insurance compa-nies to mitigate the risk that Enron would fail to deliver.17When Enron filed for bankruptcy pro-tection, JP Morgan sought payment of some $1 billion on these bonds from the insurers. The in-surers refused to pay on the grounds that the counterparties never intended to settle the for-ward contracts with physical delivery, and claimed that the contracts were a front to obtain the surety bonds as collateral against what JP Morgan and Enron intended as loans from JP Morgan to Enron.18A trial to determine whether the insurance consortium must pay has been set for December 2, 2002.
These two disputes illustrate the key differ-ences in the legal and operational frameworks underlying insurance and financial contracts. For example, under U.K. law, insurers can delay payment by invoking a “material disclosure” pro-vision to claim that their (non-life) financial in-surance counterparty withheld material informa-tion about the underlying risk. By contrast, no such provision applies to OTC derivatives
docu-mented under International Swaps and Derivatives Association (ISDA) contracts. In ad-dition, ISDA contracts require immediate pay-ment, whereas insurance contracts may pay off over a period of years, particularly if insurers ex-ercise their right to dispute the claim.
Reflecting these disputes, some of the major global banks no longer use insurance instru-ments to manage financial risks and instead use ISDA derivatives contracts, particularly when dealing with insurers. Others have become highly selective in choosing insurance transac-tions and counterparties that have a track record of timely payment. In addition, some London market participants now craft contracts to limit the use of “material disclosure” provisions. One major rating agency now examines “willingness to pay” in rating insurance policies that are used to provide credit enhancements and/or finan-cial guarantees. Notwithstanding this progress, the understanding and management of these risks may need to evolve further in the period ahead.
Leverage: Does the Consolidated Insurance and Reinsurance Sector Need More Capital?
At first glance, balance sheet information sug-gests that insurance companies are typically over-capitalized to a much larger extent than com-mercial banks. Major insurers’ capital ratios typically exceed the regulatory minimum by two to four times, compared with approximately one to two times for banks.19A closer look suggests that insurers hold excess capital in part to cover financial risks that are not covered in their regu-latory requirements.20As noted above, capital re-quirements in some countries primarily reflect insurance risks—the liability side of the balance sheet—rather than investment risks on the asset side. Rating agencies and counterparties
there-17A surety bond is a contract issued by the surety guaranteeing that he will perform certain acts promised by another or
pay a stipulated sum, up to a limit, in lieu of performance should the principal fail to perform. See IMF (2002).
18“Enron Fallout: Why Insurers Fail Banks,” (2002). 19Joint Forum (2001a), p. 53.
fore look for capital ratios that are well above minimum standards. They see insurers as be-coming more sensitive to risk-based capital allo-cation and moving to upgrade their internal cap-ital management systems.
Despite this progress, questions have been raised about whether some Japanese and European life insurance companies are ade-quately capitalized on a risk-adjusted basis rela-tive to their financial and insurance risks.21For example, insurance companies’ capital may not fully reflect the substantial implicit options em-bedded in their balance sheets. On the asset side, some insurance companies hold securities such as convertible bonds that have embedded options. On the liability side, many life insurers have issued guaranteed return policies that amount to call options on interest rates sold to policyholders. Falling interest rates increase both the value of these options to policyholders and the implicit corresponding liability for insur-ers. For a variety of insurance companies, mar-ket returns on safe instruments have fallen be-low promised rates on existing policies
originated earlier. In Japan, guaranteed returns average 3.6 percent, compared with investment returns of less than 2.3 percent; in Switzerland, insurers are mandated to offer guaranteed re-turns of 4 percent on compulsory private “sec-ond-pillar” pensions, compared with 10-year bond yields of about 3.6 percent.
There are also broader questions about whether capital in the global insurance/ reinsurance industry is sufficient to support prudently the total amount of insurance risk in the global financial system, both presently and in the immediate future as demand for insur-ance products grows. The global insurinsur-ance in-dustry experienced significant shocks in 2001. First, total insured losses to the non-life industry from natural disasters are estimated to have
amounted to $11.5 billion, up from $7.5 billion in 2000. Second, equity market declines are esti-mated to have erased some $20 billion from in-surers’ balance sheets. Third, Enron’s collapse is estimated to result in $4 billion to $5 billion in losses on securities and insurance policies. Finally, September 11 is estimated to cost insur-ers $50 billion to $60 billion worldwide. Overall these estimated losses total some $90 billion, only about $20 billion to $30 billion of which has been replaced by fresh inflows of capital (to-tal capi(to-tal in the insurance industry is estimated at around $480 billion).22
Would Insurance Company Failures Be Likely to Cause Systemic Financial Problems?
Extensive discussions with both market participants and officials suggest there is a body of opinion in the international financial com-munity that insurance company insolvencies would be unlikely to have systemic effects on fi-nancial stability, for several reasons. First, in most cases the existing combination of market discipline and official oversight is seen as having detected and addressed insurers’ finan-cial fragility before it posed significant risks to financial market stability, notwithstanding the fact that some problems have been privately and socially costly. For example, the March 2001 failure of Australian insurer HIH does not seem to have caused significant or persis-tent volatility in either Australian or global capital markets. This is notwithstanding its international presence, including operations in Europe, Asia, North America, and Latin America; an estimated $2.8 billion in losses for the firm; and the risk to some two million poli-cyholders and a number of creditors, including globally active banks in Europe and the United States.
21See Fukao and JCER (2002) and Procter, Nordhaus, and Hocking (2002).
22The figure for total capital is from Bureau van Dijk’s Insurance Information and Statistics (ISIS) database. There are
questions about whether the non-life industry was overcapitalized during the 1990s, but the large estimated losses relative to new inflows may have motivated the U.K. Financial Services Authority chairman’s recent remark that “we believe it im-portant for the long-term health of the [non-life insurance] industry, and its clients, that there is some strengthening of the industry’s capital base” (Davies, 2002).
Second, liquidity and solvency problems in-volving insurance companies are generally seen as unlikely to be associated with a rapid liquida-tion of investment portfolios—including deriva-tives positions—and market turbulence. In a typ-ical insolvency proceeding, life insurers stop taking on new policies, and their remaining long-term policies—some with maturities of decades—are sold off to other insurers and are allowed to run off over a period of years. Similarly, property and casualty insurers tend to pay off claims slowly, reducing the potential im-mediate pressure on liquidity. On occasions when a sharp increase in insurance claims po-tentially puts pressure on liquidity, litigation and/or investigation of claims may delay pay-ment, and increasingly financial counterparts rely on collateral arrangements to manage coun-terparty and credit risk exposures.
Third, the newer financial market and insur-ance activities, although evidently rapidly grow-ing, are viewed as relatively small in relation to both insurers’ balance sheets and to overall capi-tal markets. Although precise estimates of mar-ket size are not available, only about $13 billion in ART is estimated to have been issued since 1996, and total capital devoted to ART amounts to only about $20 billion. In addition, the share of CDOs held by insurers is unknown, but even if they held all of the $500 billion current total, it would constitute a small fraction of the $10 trillion in financial assets held by insurers in the major countries at the end of 1999. This suggests that a disruption in these newer activities or de-terioration in these assets would be unlikely to affect the viability of a major insurer.
Some Concluding Thoughts
As the preceding discussion suggests, and de-spite the limited information, many observers— including many involved with the industry in some meaningful ways—have reached a comfort level with the judgment that the international
systemic risks associated with the financial mar-ket activities of insurance companies are rela-tively limited compared to that of the major in-ternationally active banks and commercial banks. Nevertheless, there remain uncertainties about whether insurers hold adequate capital against financial risks, whether their manage-ment of market risk has kept pace with their ex-panding involvement in the market, the size and extent of their off-balance-sheet activities, and the potential migration of financial risks from banking to insurance sectors. In this light, it might be worthwhile asking whether some com-bination of limited information and regulation and high leverage could make insurers and rein-surers more vulnerable to rapid and turbulent collapses.
An insurance or reinsurance company col-lapse could affect financial stability through at least two channels. First, it could affect the fi-nancial conditions of counterparty commercial banks, investment banks, and other financial institutions through direct credit exposures such as loans and credit lines. Financial stress at a large global insurance or reinsurance com-pany could thereby adversely affect a major financial institution that plays a key role in the major payment and securities settlement sys-tems. It could also adversely affect bank balance sheets if the affected firm were part of a bancas-surance conglomerate.23Banks that belong to bancassurance conglomerates may be more vul-nerable to market risks than solo banks, because of the more stringent regulatory restrictions that apply to banks’ market exposures, and may also be exposed to reputational risk if their insurance arm experiences financial distress. At the same time, few groups exist that include both a large insurance company and a large complex banking operation. Second, the failure of a large reinsurer could adversely affect OTC derivatives counterparties and bank counterpar-ties in credit-risk transfer transactions such as credit derivatives.
Other questions can be raised about the finan-cial stability implications of finanfinan-cial problems of reinsurers. Major insurance companies ac-tively hedge insurance risks with reinsurance companies and thereby have extensive counter-party relationships with reinsurers. In effect, the reinsurance companies are part of the risk man-agement framework and an important line of de-fense against insurance company illiquidity and insolvency, because they help to pool the insur-ance risk. Over the years, counterparty expo-sures may have become more concentrated amid consolidation in the global reinsurance industry. This relationship poses risks: could a systemic in-surance event—possibly the confluence of sev-eral major catastrophes to which a critical mass of reinsurers are exposed—create the strong po-tential for financial distress involving a number of reinsurers simultaneously?
If several major reinsurers simultaneously ex-perienced financial stress, this could pose the risk for a large number of major primary insur-ers that their reinsurance hedges could fail to perform as expected, and leave many primary insurers with unhedged financial and insurance exposures. It is difficult to know how insurers would rebalance their activities and exposures to manage the sudden change in their risk profiles but adjustments could include cutbacks in the provision of insurance, withdrawals from capital markets, and attempts to unwind OTC derivatives hedges and liquidate part of their portfolios in order to return their financial and insurance risk profiles to more desirable positions.
In order to assess these risks and have a more credible understanding of these potential sce-narios, the international community would need better information about the financial ac-tivities of insurers and reinsurers. Information would be particularly needed on the size, ex-tent, and nature of reinsurance cover, and the potential for a critical mass of major reinsurers to simultaneously experience financial difficul-ties. In addition, it may be desirable to assess further whether the limited regulation of insur-ers’ and reinsurinsur-ers’ financial activities creates an
unlevel “playing field” vis-à-vis banks (Joint Forum, 2001a).
References
Davies, Howard, 2001, Remarks at the Insurance Institute of London Annual Luncheon, London, March 9.
———, 2002, “Rational Expectations—What Should the Market, and Policyholders, Expect from Insurance Regulation?” The Association of
Insurance and Risk Management (AIRMIC) Annual Lecture, London, January 29.
“Enron Fallout: Why Insurers Fail Banks,” 2002, The Banker (London), March, pp. 16–19.
European Commission, 2002a, “Study into the Methodologies for Prudential Supervision of Reinsurance with a View to the Possible Establishment of an EU Framework,” study pre-pared by KPMG (Brussels, January 31). ———, 2002b, “Study into the Methodologies to
Assess the Overall Financial Position of an Insurance Undertaking from the Perspective of Prudential Supervision,” study prepared by KPMG (Brussels, May).
Financial Services Authority, 2002, Cross-Sector Risk Transfer, Discussion Paper (London).
Fitch Ratings, 2001, “Use of Insurance Policies as Credit Enhancements in Structured Finance,”
Structured Finance Special Report,June 18. Fukao, Mitsuhiro, and Japan Center for Economic
Research (JCER), eds., 2002, “The Life Insurance Crisis Will Continue” (Seiho Kiki wa Owaranai, in Japanese), Tokyo Keizai Shimposha, Tokyo. International Association of Insurance Supervisors
(IAIS), 2000, Working Group on Reinsurance,
Reinsurance and Reinsurers: Relevant Issues for Establishing General Supervisory Principles, Standards and Practices(February).
———, 2002, Supervisory Standard on the Evaluation of the Reinsurance Cover of Primary Insurers and the Security of their Reinsurers(January).
International Monetary Fund, 2002, Global Financial Stability Report, World Economic and Financial Surveys (Washington, March).
———, and World Bank, 2001, “Experience with the Insurance Core Principles Assessments Under the Financial Sector Assessment Program,” prepared by the staffs of the IMF and the World Bank
Joint Forum, 2001a, Risk Management Practices and Regulatory Capital, Cross-Sectoral Comparison(Basel: Bank for International Settlements, November). ——— 2001b, Core Principles: Cross-Sectoral Comparison
(Basel: Bank for International Settlements, November).
JP Morgan, 2001, “The Insurance Industry and FA/GIC Bonds” (New York), July 17. Organization for Economic Cooperation and
Development, Committee on Financial Markets,
2002, “Risk Transfer Mechanisms,” DAFFE/ CMF(2002)5, Paris, March 25.
Procter, Rob, Espen Nordhaus, and Jon Hocking, 2002, “Downgrading on Embedded Concerns,”
Morgan Stanley Equity Research: European Insurance
(New York).
Swiss Re, 2001, “Profitability of the Non-Life Insurance Industry: It’s Back-to-Basics Time,”
sigmaNo. 5/2001 (Zurich: Swiss Reinsurance Company).