THE ACTUAL DISTRIBUTION OF THE ARABLE LAND
AND THE COMPARATIVE ANALISYS OF ITS DYNAMICS BETWEEN
1990-2015; CASE: DOLJ COUNTY (ROMANIA)
CRISTIAN EMIL IONICĂ1 1University of Bucharest, Faculty of Geography, ‘Simion Mehedinti’ Doctoral School
Key words: agriculture, rural areas, stakeholders, Dolj county, Romania
ABSTRACT
The development perspective of the rural areas, in most of the cases, points out the agriculture as being the engine to trigger sustainable economic development of the respective territory.
This analysis aims at identifying the elements which determine the development potential of the agriculture and of the rural areas, at highlighting, on one hand, the problems and the dysfunctionalities and, on the other hand, the development perspectives, the possibilities of increasing the performance in agriculture and the prioritisation of the necessary measures for both rural and agricultural development.
For the rural areas, the sustainable agriculture represents, nevertheless, the most efficient development measure.
INTRODUCTION
Dolj county is located in the South-West of Romania, between 43°43’ and 44°42’ North latitude, respectively 24°16’ and 22°50’ East longitude, being crossed, from the North to the South, by the Jiu river from which it was given the name (Doljiu – meaning „The lower Jiu”.
The surface of Dolj county covers 742,175 ha. Presently, the agricultural land covers 585.072 ha, of which 487,601 ha is arable land (65.69%). Of the total agricultural land in the county, almost 18.11% is affected by flood risk, in particular the localities situated on the Danube meadow and the riverside of Jiu – lower basin.
In order to quantify all the land situated in the risk zones, the inventory of the agricultural land has been accomplished with the use of GIS techniques.
The present study has as a goal the quantification of the decrease in agricultural land in Dolj county (Romania) as a consequence of the increase, in the last years, in flood
risk and urban development, namely by the expansion of the built-up areas.
MATERIAL AND METHOD
SOURCE OF DATA. Master plan of Dolj County, master plans of all basic administrative units, zonal urban plans, ortophotoplans, cadastral maps at different scale: 1:50.000
(1979) and 1:2.000 (1985), and map of exposed flood risk (conforming Directive
2007/60/CE). At the same time were used and other statistical data and information from agriculture registers and raports.
will use a mix of methods and techniques of analysis, based on the principle of "triangulation" for three types of methodological tools: Methods for gathering data/information; Methods of quantitative analysis; Instruments for qualitative analysis. For quantification of land surfaces, an inventory was made of the farmland using G.I.S. techniques (SIG).
METHODS. For achieving the present map and for a spatial analysis we used the soft ARCGIS 10.3.1 – Advanced Edition and the soft GeoMedia Professionals, working in the GIS environment.
The maps were built using the thematic layers and the imports of spatial objects, combined and integrated with the functionalities existing inside of the mentioned soft.
The interrogated and analyzed geospatial data are represented in a entire ensemble constituted from:
- Spatial data (having the coordinates in X,Y,Z, geografical and Cartesian coordinates); - Descriptive data (non-graphic data – attributes) associated to geographical objects/phenomena (such streets, buildings, parcels).
At the same time we used different functions for spatial analysis to identify the overlapping intra-urban and extra-urban land during the time. Other kind of functions were used to organise, design and presentation better the maps:
1. Analysis Tool->Overlay->Intersect 2. Analysis Tool->Overlay->Spatial Join
3. Convertion Tools->To Raster-> Ascii To Raster
RESULTS AND DISCUSSION
In this study analyzed a number of relevant documents in the context of the development of agriculture, in particular component "arable land" and the countryside for Dolj county during the entire period between 1990-2015.
THE CURRENT DISTRIBUTION OF ARABLE LAND
Sursa: INS, Judeţul Dolj în cifre 2003-2006.Land utilization structure in Dolj county, on how the use of – 2011
The distribution of agricultural land
Table 1
The agricultural area used by the
method 2003 2004 2005 2006 2015
Agricultural area, of which: 585.736 585.759 585.699 585.515 583.069 Arable land 487.615 487.516 488.677 489.086 487.601 Natural grasslands 68.530 68.679 68.435 68.414 67.875
Meadows 2.952 2.952 2.952 2.952 2.952
Wine-growing and nurseries 18.287 18.260 17.538 17.188 16.946 Orchards and fruit tree nurseries 8.352 8.352 8.097 7.875 7.695
Suprafaţa agricolă după modul de folosinţă -Judeţul Dolj (2006)
83,53 11,68 0,502,941,34
FACTORS THAT INFLUENCE THE AREAS OF AGRICULTURAL LAND
The aggressive urban development and the flood risk are key factors in the analysis
of the dynamics of the agricultural land between 1990 and 2015.
A. Urban Aggressione
Analysis of dynamics of city land
Table 2
Nr.
Crt UAT
The commune'
s area in the current version (OCPI) Existing surface built in the year 1990 (ha) Surface built in 2001 (ha) Surface built in 2015 (ha) Analysis of dynamic
s of city land (ha) Surface area in 1990 (ha) Surface area in 2001 (ha) Surface area in 2015 (ha)
1 CRAIOVA 8196.93 6036.80 7275.33 7275.33 1238.53 2160.13 921.60 921.60 2 BĂILEȘTI 16363.29 1197.46 1232.00 1232.00 34.54 15165.83 15131.29 15131.29 3 CALAFAT 13804.65 990.10 1054.80 1054.80 64.70 12814.55 12749.85 12749.85 1 BECHET 2926.67 399.86 411.45 518.50 118.64 2526.81 2515.22 2408.17 2 DĂBULENI 17951.41 861.61 919.85 950.00 88.39 17089.80 17031.56 17001.41 3 FILIAȘI 10007.86 911.70 971.05 971.05 59.35 9096.16 9036.81 9036.81 4 SEGARCEA 12001.75 421.00 502.00 663.97 242.97 11580.75 11499.75 11337.78 1 AFUMAȚI 6952.65 538.13 557.60 422.52 -115.61 6414.52 6395.05 6530.13 2 ALMĂJ 2749.64 667.88 680.00 594.85 -73.03 2081.76 2069.64 2154.79 3 AMĂRĂȘTII DE JOS 6220.85 723.35 723.35 723.35 0.00 5497.50 5497.50 5497.50 4 AMĂRĂȘTII DE SUS 3488.28 569.00 715.44 397.00 -172.00 2919.28 2772.84 3091.28 5 APELE VII 6476.91 270.50 266.83 284.60 14.10 6206.41 6210.08 6192.31 6 ARGETOAIA 8433.63 689.05 739.70 772.11 83.06 7744.58 7693.93 7661.52 7 BISTREȚ 12220.18 442.96 430.42 484.23 41.27 11777.22 11789.76 11735.95 8 BÂRCA 8825.24 201.40 384.00 363.60 162.20 8623.84 8441.24 8461.64 9 BOTOȘEȘTI-PAIA 3997.64 135.34 126.42 126.42 -8.92 3862.30 3871.22 3871.22 10 BRABOVA 7965.06 431.40 445.21 445.21 13.81 7533.66 7519.85 7519.85 11 BRĂDEȘTI 6339.24 495.32 385.61 385.61 -109.71 5843.92 5953.63 5953.63 12 BRALOȘTIȚA 4044.55 334.30 340.80 355.61 21.31 3710.25 3703.75 3688.94
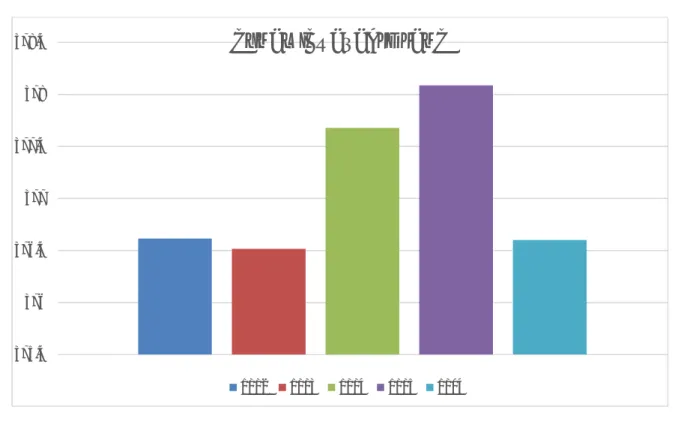
486,5 487 487,5 488 488,5 489
489,5
DYNAMICS ARABLE LAND
13 BRATOVOEȘTI 6506.23 707.38 754.18 663.79 -43.59 5798.85 5752.05 5842.44 14 BREASTA 4428.45 308.73 332.40 486.15 177.42 4119.72 4096.05 3942.30 15 BUCOVĂT 8357.64 380.15 455.46 664.45 284.30 7977.49 7902.18 7693.19 16 BULZEȘTI 6274.43 454.44 439.19 487.12 32.68 5819.99 5835.24 5787.31 17 CALOPĂR 9217.43 386.50 405.70 486.09 99.59 8830.93 8811.73 8731.34 18 CARAULA 3591.43 194.50 211.74 211.74 17.24 3396.93 3379.69 3379.69 19 CARPEN 6268.10 377.90 369.63 414.04 36.14 5890.20 5898.47 5854.06 20 CASTRANOVA 6807.12 257.22 276.01 276.01 18.79 6549.90 6531.11 6531.11
21 CATANE* 4667.41 - - 259.49 - - - 4407.92
22 CĂLĂRAȘI 8750.91 475.50 510.49 510.49 34.99 8275.41 8240.42 8240.42
23 CÂRCEA* 3252.23 - - 1900.55 - - - 1351.68
24 CÂRNA* 8418.76 - - 147.50 - - - 8271.26
25 CELARU 9524.93 842.66 744.78 871.22 28.56 8682.27 8780.15 8653.71 26 CERĂT 4192.88 292.80 316.63 379.15 86.35 3900.08 3876.25 3813.73 27 CERNĂTEȘTI 5735.47 341.56 344.24 344.24 2.68 5393.91 5391.23 5391.23 28 CETATE 8677.10 343.60 356.99 392.20 48.60 8333.50 8320.11 8284.90 29 CIOROIAȘI 4534.51 333.15 323.60 346.75 13.60 4201.36 4210.91 4187.76 30 CIUPERCENII NOI 10622.45 489.00 543.00 616.01 127.01 10133.45 10079.45 10006.44 31 COȘOVENI 4395.07 498.27 531.48 333.92 -164.35 3896.80 3863.59 4061.15 32 COȚOFENII DIN DOS 4556.90 256.51 279.70 338.06 81.55 4300.39 4277.20 4218.84 33 COȚOFENII DIN
FAȚĂ* 2438.52 - - 242.50 - - - 2196.02
34 DANEȚI 10317.09 950.60 965.40 965.40 14.80 9366.49 9351.69 9351.69 35 DESA 7631.33 298.86 339.44 505.03 206.17 7332.47 7291.89 7126.30 36 DIOȘTI 6283.19 449.50 449.50 449.50 0.00 5833.69 5833.69 5833.69 37 DOBREȘTI 5630.16 345.93 350.05 350.05 4.12 5284.23 5280.11 5280.11
38 DOBROTEȘTI* 3325.97 - - 392.30 - - - 2933.67
39 DRĂGOTEȘTI 5881.94 394.88 426.32 426.32 31.44 5487.06 5455.62 5455.62 40 DRĂNIC 8053.47 388.36 390.15 390.15 1.79 7665.11 7663.32 7663.32 41 FĂRCAȘ 4756.39 421.50 431.74 305.98 -115.52 4334.89 4324.65 4450.41 42 GALICEA MARE 5885.28 368.35 368.53 497.14 128.79 5516.93 5516.75 5388.14
43 GALICIUICA* 2486.53 - - 182.50 - - - 2304.03
44 GHERCEȘTI 5005.52 393.30 424.79 986.44 593.14 4612.22 4580.73 4019.08
45 GHIDICI* 4519.81 - - 279.00 - - - 4240.81
46 GHINDENI* 3000.98 - - 296.50 - - - 2704.48
47 GIGHERA 13090.84 399.20 407.50 496.90 97.70 12691.64 12683.34 12593.94 48 GIUBEGA 5398.63 501.17 501.19 384.00 -117.17 4897.46 4897.44 5014.63 49 GIURGIȚA 7315.58 371.82 384.00 386.00 14.18 6943.76 6931.58 6929.58 50 GÂNGIOVA 5761.85 280.70 297.29 297.29 16.59 5481.15 5464.56 5464.56 51 GOGOȘU 4310.40 305.07 280.65 280.65 -24.42 4005.33 4029.75 4029.75 52 GOICEA 5869.97 442.50 472.25 327.25 -115.25 5427.47 5397.72 5542.72 53 GOIEȘTI 7843.07 630.98 603.20 741.45 110.47 7212.09 7239.87 7101.62 54 GRECEȘTI 4824.73 370.59 386.80 386.80 16.21 4454.14 4437.93 4437.93 55 IȘALNIȚA 3182.50 207.32 759.25 993.40 786.08 2975.18 2423.25 2189.10 56 IZVOARE 5159.13 263.50 260.00 260.00 -3.50 4895.63 4899.13 4899.13
57 ÎNTORSURA* 3160.52 - - 209.70 - - - 2950.82
69 NEGOI 5050.93 493.75 491.71 255.00 -238.75 4557.18 4559.22 4795.93 70 ORODEL 9090.21 510.40 538.30 538.30 27.90 8579.81 8551.91 8551.91 71 OSTROVENI 8207.97 486.00 513.75 664.00 178.00 7721.97 7694.22 7543.97 72 PERIȘOR 6956.05 309.70 345.76 378.02 68.32 6646.35 6610.29 6578.03 73 PIELEȘTI 6568.69 433.55 448.20 1353.84 920.29 6135.14 6120.49 5214.85 74 PISCU VECHI 5757.61 443.82 476.17 296.32 -147.50 5313.79 5281.44 5461.29 75 PLENIȚA 8889.88 461.70 463.45 468.50 6.80 8428.18 8426.43 8421.38
76 PLEȘOI* 4032.26 - - 255.77 - - - 3776.49
77 PODARI 6712.91 465.81 450.67 643.30 177.49 6247.10 6262.24 6069.61 78 POIANA MARE 16435.07 1061.70 1015.91 1297.42 235.72 15373.37 15419.16 15137.65 79 PREDEȘTI 4301.98 490.25 507.25 394.40 -95.85 3811.73 3794.73 3907.58 80 RADOVAN 4914.11 435.00 460.00 284.85 -150.15 4479.11 4454.11 4629.26 81 RAST 8156.87 257.70 315.27 315.27 57.57 7899.17 7841.60 7841.60 82 ROBĂNEȘTI 5958.60 436.15 427.39 955.89 519.74 5522.45 5531.21 5002.71
83 ROJIȘTE* 3303.33 - - 254.15 - - - 3049.18
84 SADOVA 11190.29 557.90 576.17 715.17 157.27 10632.39 10614.12 10475.12 85 SĂLCUȚA 7575.41 347.10 365.00 365.00 17.90 7228.31 7210.41 7210.41 86 SCAEȘTI 3933.94 294.13 298.59 311.97 17.84 3639.81 3635.35 3621.97 87 SEACA DE CÂMP 3643.81 274.10 283.55 283.55 9.45 3369.71 3360.26 3360.26 88 SEACA DE PĂDURE 5744.02 290.15 293.10 308.00 17.85 5453.87 5450.92 5436.02 89 SECU 2917.04 214.42 217.20 217.20 2.78 2702.62 2699.84 2699.84 90 SILIȘTEA CRUCII 3479.09 207.00 201.49 201.49 -5.51 3272.09 3277.60 3277.60 91 ȘIMNICU DE SUS 8115.28 745.60 571.70 1158.30 412.70 7369.68 7543.58 6956.98 92 SOPOT 5538.56 350.35 358.07 358.07 7.72 5188.21 5180.49 5180.49
93 TĂLPAȘ* 3829.93 - - 197.32 - - - 3632.61
94 TEASC 4846.06 350.95 347.30 632.63 281.68 4495.11 4498.76 4213.43 95 TERPEZIȚA 6665.23 300.90 342.30 342.30 41.40 6364.33 6322.93 6322.93 96 TESLUI 7427.23 437.19 447.97 481.21 44.02 6990.04 6979.26 6946.02 97 ȚUGLUI 3822.96 202.90 210.90 284.20 81.30 3620.06 3612.06 3538.76 98 UNIREA 4780.18 348.00 373.00 373.00 25.00 4432.18 4407.18 4407.18 99 URZICUȚA 6093.53 418.80 484.10 560.25 141.45 5674.73 5609.43 5533.28 10
0 VALEA STANCIULUI 11072.75 651.70 637.50 637.50 -14.20 10421.05 10435.25 10435.25 10
1 VELA 8252.12 320.30 354.35 354.35 34.05 7931.82 7897.77 7897.77 10
2 VERBIȚA 4510.98 162.55 161.70 161.70 -0.85 4348.43 4349.28 4349.28 10
3 VÂRTOP 3284.23 207.00 218.25 218.25 11.25 3077.23 3065.98 3065.98 10
4 VÂRVORU DE JOS 10800.64 494.00 511.34 511.34 17.34 10306.64 10289.30 10289.30
TOTAL 742175.88
49562.5 6
52890.4 0
63145.9
2 8966.08
646177.0 7
642849.2 3
679029.9 6
B. THE FLOOD RISK
According to the
County Plan of Analysis Risk Management, as well as to the maps of floodable areas, especially in the Danube
Meadow, in the
neighbourhood of Jiu river and of the Desnăţui, Raznic and Teslui rivers, the most exposed communes in the
county are: Dăbuleni,
Călărași, Bechet, Ostroveni, Gighera, Măceșu de Jos,
Cârna, Bistreț, Catane,
Negoi, Cetate, Maglavit,
Calafat, Ciupercenii Noi,
Desa, Piscu Vechi,Ghidici,
Rast, Sadova, Dobrești,
Gângiova, Valea Stanciului,
Bratovoești,Țuglui, Malu
Mare, Teasc, Drănic, Rojiște,
Grecești, Cernătești,
Predești,Breasta, Goicea,
Bârca, Giurgița, Cerăt,
Lipovu, Radovan, Filiași, Brădești,Coțofenii din Față, Ișalnița, Coțofenii din Dos, Scăești,
Braloștița, Bucovăț,Podari, Craiova, Ghercești, Pielești și Robănești.
CONCLUSION
As a consequence, the study will serve to the strategic planning at county level by the accomplishment of a radiography of the rural area, by the analysis of certain aspects such as the territory, the fragmentation of the agricultural exploitation lands (the arable patrimony), the quality of the agricultural activities (the economy of the arable land) between the administrative boundaries of Dolj county.
A conclusion would be that the functionality of this study addresses different public stakeholders, policy makers - with respect to the organisation of the rural areas and the local and regional development policies, thus contributing to the achievement of the complete perspective of the development of the rural space between the boundaries of the Dolj county.
BIBLIOGRAPHY
ARMAŞ I.,(2006), Risk and vulnerability. Evaluation methods applied in geomorphology, Publisher: the University of Bucharest.
BOENGIU S., (2008), Bălăciței (Piedmont)-geography study, Editura Universitaria Craiova;
CĂLINA A. și colaboratorii, (2010), General and engineering surveying, Siteh Publishing House, Craiova
IANOȘ I., HELLER, W. (2006), Space, economy and settlement system, Technical publishing house, Bucharest
IANOȘ I., HUMEAU J.B. (2000), Settlement systems theory. Introductory study, Technical publishing house, Bucharest.
OTIMAN, P.I. (2008), Sustainable development strategy in the medium term and long-term agricultural and rural-rural Romania- Romania from XXI, Magazine "agricultural economics and dezvoltarerurală", Anul V, nr. 1, p. 3−20.
SOROCOVSHI V.,(2002 – 2014), Hazards and disasters, nr. 1 – 14, The book House Publishing House, Cluj-Napoca, Romania.
University of Craiova, Department of geography,(2013), Evaluation and reduction of natural and technological hazards - Cross-border cooperation programme
"Commune Boundaries. Common solutions "(Romania-Bulgaria), Editura