151
FINANCIAL RESULTS OF ECONOMIC ACTIVITY IN
SC 3 D TOP PROJECT LLC ORĂŞTIE, HUNEDOARA COUNTY
PÂNZARU R.L., MEDELETE D.M.
Faculty of Agriculture and Horticulture, University of Craiova
Key words: income, expenses, profit, loss structure.
ABSTRACT
This paper aims to present the financial position of the unit examined by presenting based on the profit and loss account of the indicators of income, expenses and profit. The study covers a period (2009-2011) characterized by numerous changes related to specific market developments.
It can be seen that the activity peaked in 2010, then in 2011 there has been a substantial reduction in their performance.
INTRODUCTION
3D TOP PROJECT LLC was founded in 2007. According to existing data in the Commercial Register, the company has as main activity field engineering activities and related technical consultancy.
Company address is Str. Grădiştei Oraştie No.1, Zip Code: 335700, Hunedoara county, and entered in the Register of Commerce: J20/1231/2007, CUI: 22329986.
Unit operating in the service sector, the sector recorded an upward trend after economic decentralization process in Romania. The unit is intended for customers with specific needs: transactions of real estate, civil, industrial and scored in the land, etc..
METHOD AND MATERIAL
The paper was accomplished for the 2009-2011 period. The documentation included an accounting consultation documents (profit and loss) and other documents containing financial data. Bureau phase was accomplished trough time ordering and usage - as working method - comparison of time.
RESULTS AND DISCUSSIONS
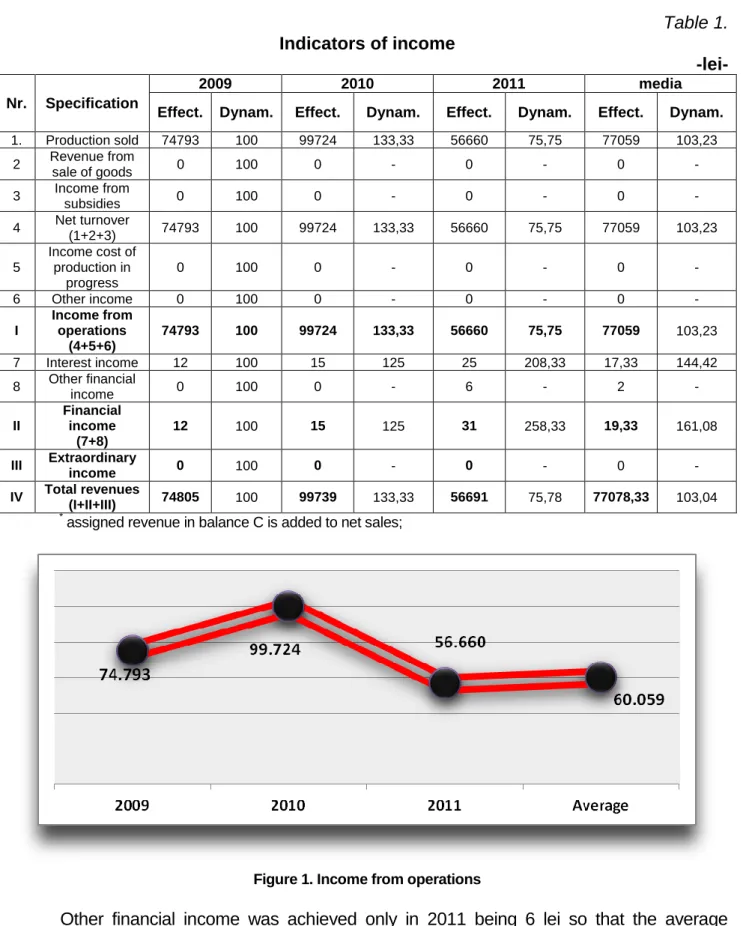
Table 1. presents the level of income indicators for the years 2009, 2010 and 2011. The first indicator of income is the production sold. This indicator varied uneven the level of of 74,793 lei in 2009, being defeated with 33.33% in 2010 (99 724 lei) and 24.25% lower in 2011 (56660 lei), so the average was 77 059 lei (3.23% compared to 2009).
Revenue from sale of goods and from grants were not made by the company, so that the net turnover is only based on production sold.
Other revenues and income for the cost of production in progress are made as a result operating income are identical to net turnover and production sold (Figure 1.): 74 793 lei in 2009, 99,724 lei for 2010 - 133.33% in dynamically 56660 lei for the year 2011 to 75.75% 60059 lei average of the period (80.30%).
152
Table 1. Indicators of income
-lei-
Nr. Specification
2009 2010 2011 media
Effect. Dynam. Effect. Dynam. Effect. Dynam. Effect. Dynam.
1. Production sold 74793 100 99724 133,33 56660 75,75 77059 103,23
2 Revenue from
sale of goods 0 100 0 - 0 - 0 -
3 Income from
subsidies 0 100 0 - 0 - 0 -
4 Net turnover
(1+2+3) 74793 100 99724 133,33 56660 75,75 77059 103,23
5
Income cost of production in
progress
0 100 0 - 0 - 0 -
6 Other income 0 100 0 - 0 - 0 -
I
Income from operations
(4+5+6)
74793 100 99724 133,33 56660 75,75 77059 103,23
7 Interest income 12 100 15 125 25 208,33 17,33 144,42
8 Other financial
income 0 100 0 - 6 - 2 -
II
Financial income
(7+8)
12 100 15 125 31 258,33 19,33 161,08
III Extraordinary
income 0 100 0 - 0 - 0 -
IV Total revenues
(I+II+III) 74805 100 99739 133,33 56691 75,78 77078,33 103,04
*
assigned revenue in balance C is added to net sales;
Figure 1. Income from operations
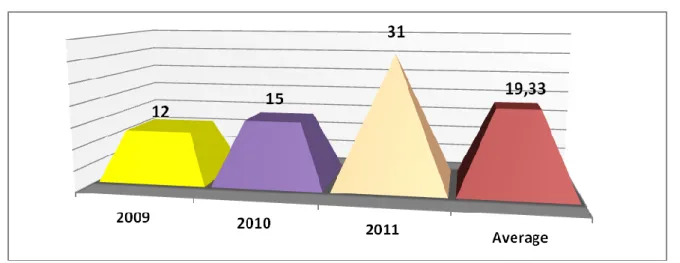
Other financial income was achieved only in 2011 being 6 lei so that the average period was 2 lei
Financial income (resulting from adding interest income from other financial income) increased during the period under review, being (Figure 2.): 12 lei in 2009, 15 lei in 2010 (+25% compared to the previous year); 31 lei in 2011 (brought forward from 158.33% to the base) 19.33 lei for period average (61.08% compared to the first term).
153
Figure 2. Financial income
Based on the three categories of income (operating, financial and extraordinary) are formed company's total revenue, which is as follows (Figure 3.): 74 805 lei for 2009, 99,739 lei in the year 2010 to 133.33 % 56 691 lei for 2011 (lower level with 24.22% reporting base) 77078.33 lei for period average (3.04% compared to 2009 - term of reference).
Figure 3. Total revenues
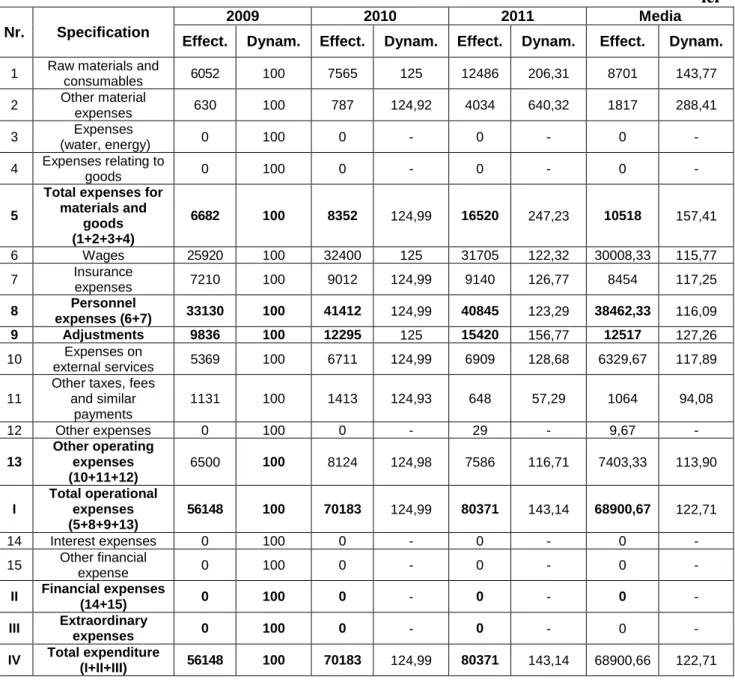
Table 2. presents indicators of expenditure for the period under review. Refer to the operating expenses, financial expenses, extraordinary expenses and total expenses.
Raw materials and consumables ranged from lei 6052 in lei 2009 to 12486 in 2011, while the average of the period was 8701 lei in 2010 being the level of 7565 lei. Dynamic trend of the indicator underlines, overtaking the term of reference being: 25.0% in 2010, 106.31% in 2011 and 43.77% in average.
Other material expenses have an average of 288.41 lei (188.41% dynamic), involving the temporal sequences of 630 lei in 2009, 787 lei in 2010 (24.92%) 4034 lei in 2011 (brought forward to 6.40 times the first term).
154
Wages have risen from lei 25,920 in 2009, with 25.0% in 2010 (lei 32,400) and 22.32% for 2011 (lei 31705). The same tendency has the average of the period which extends beyond comparison with 15.77% - 30008.33 lei.
Table 2. Indicators of spending
-lei-
Nr. Specification
2009 2010 2011 Media
Effect. Dynam. Effect. Dynam. Effect. Dynam. Effect. Dynam.
1 Raw materials and
consumables 6052 100 7565 125 12486 206,31 8701 143,77
2 Other material
expenses 630 100 787 124,92 4034 640,32 1817 288,41
3 Expenses
(water, energy) 0 100 0 - 0 - 0 -
4 Expenses relating to
goods 0 100 0 - 0 - 0 -
5
Total expenses for materials and
goods (1+2+3+4)
6682 100 8352 124,99 16520 247,23 10518 157,41
6 Wages 25920 100 32400 125 31705 122,32 30008,33 115,77
7 Insurance
expenses 7210 100 9012 124,99 9140 126,77 8454 117,25
8 Personnel
expenses (6+7) 33130 100 41412 124,99 40845 123,29 38462,33 116,09
9 Adjustments 9836 100 12295 125 15420 156,77 12517 127,26
10 Expenses on
external services 5369 100 6711 124,99 6909 128,68 6329,67 117,89
11
Other taxes, fees and similar
payments
1131 100 1413 124,93 648 57,29 1064 94,08
12 Other expenses 0 100 0 - 29 - 9,67 -
13
Other operating expenses (10+11+12)
6500 100 8124 124,98 7586 116,71 7403,33 113,90
I
Total operational expenses (5+8+9+13)
56148 100 70183 124,99 80371 143,14 68900,67 122,71
14 Interest expenses 0 100 0 - 0 - 0 -
15 Other financial
expense 0 100 0 - 0 - 0 -
II Financial expenses
(14+15) 0 100 0 - 0 - 0 -
III Extraordinary
expenses 0 100 0 - 0 - 0 -
IV Total expenditure
(I+II+III) 56148 100 70183 124,99 80371 143,14 68900,66 122,71
Insurance spending have averaged lei 8454 (17.25% over the reporting), with extremes of 7210 lei in 2009 and 9140 lei in 2011 (26.77%). In 2010 the indicator exceeded the benchmark with 24.99% - 9140 lei.
Based on salaries and insurance were determined personal expenses. This indicator has been ascending values for the analyzed period from 33130 lei in 2009 up to 41412 lei in 2010. It can talk about the increasing trend of the indicator highlighted by overcoming reference, as follows: 24.99% for 2010 (41412 lei), 23.29% for 2011 and 16.09% to the average of the period (38 462, 33 lei) .
155
increase to 15,420 lei in 2011 (56.77% to the first term). Under these conditions the average of the period reached 12517 lei (127.26% of the reporting).
Expenditure on external services were 5369 lei in 2009 increased by 24.99% in 2010 (6711 lei) and 28.68% in 2011 (6909 lei), while the average of the period outrun by 17.89% the reporting deadline - 6329.67 lei.
With regard to other taxes, fees and similar payments, it can be seen that they ranged from 648 lei in 2011 up to 1413 lei in 2010, while the average of the period was 1064 lei. In dynamics can be observed variation made with fixed base indices: supra-unitary values for 2010 (124.93%) and values below par in 2011 to 57.29% and for average (94,08%).
For the item "other expenses" we have an average of 9.67 lei given that they were made only in 2011 (29 lei).
Following the values quoted for the last three indicators was determined the indicator "other operating expenses", which registered: 6500 lei in 2009, 8124 lei for 2010 to 124.98% 7586 lei - 116.71% in 2011. With these values we determined that the average of the period was 7403.33 lei, which in dynamic was exceeded by 13.90% in the reporting base.
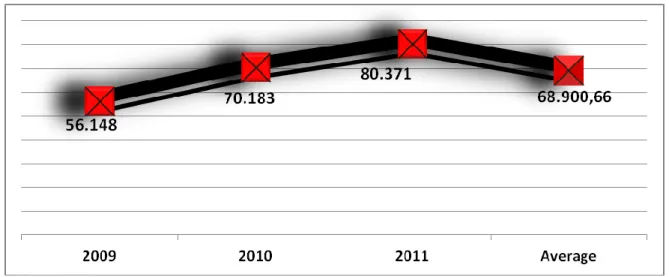
Total operating costs (Figure 4.) are based on total material costs, personnel costs, adjustments for property and other operating expenses, while the financial and extraordinary expenses were zero, total spending reached sequential levels : 56 148 lei in 2009, 70,183 lei in 2010 (24.99% dynamic) 80 371 lei in 2011 (43.14% compared to the benchmark) 68900.66 lei for the average of the period (22 71% in the dynamics composed).
Figure 4. Total operational expenses
Table 3. presents the level of profitability indicators for the period under review.
Profit or loss from operations is characterized by an average of lei 8158.33 (-56.24% compared to 2009), the resulting value made from sequential annual levels of 18645 lei in 2009, 29541 lei specific to 2010 (58.44% from the previous year) and -23 711 lei for 2011 (when the company recorded losses).
Financial profit was 12, 15 and 31 lei for the three components of the dynamic series 2009, 2010 and 2011, respectively (25 and 158.33% in dynamics to the reporting deadline). Due to this situation, the average of the period reached 19.33 lei, ie 161.08% fixed base index value.
156
Table 3. Profitability indicators
Nr. Specification U.M.
2009 2010 2011 Media
Effect. Dynam. Effect. Dynam. Effect. Dynam. Effect. Dynam.
1 Operating
profit or loss lei 18645 100 29541 158,44 -23711 - 8158,33 43,76
2 Financial
profit lei 12 100 15 125 31 258,33 19,33 161,08
3
Profit or loss of current
(1+2)
lei 18657 100 29556 158,42 -23680 - 8177,66 43,83
4 Extraordinary
profit lei 0 - 0 - 0 0 -
5
Gross profit or loss
(3+4)
lei 18657 100 29556 158,42 -23680 - 8177,66 43,83
6 Income tax lei 2985,1 - 4743 158,89 0 0 2576,03 86,30
7 Other taxes
or levies lei 0 - 0 - 0 0 -
8 Net profit or
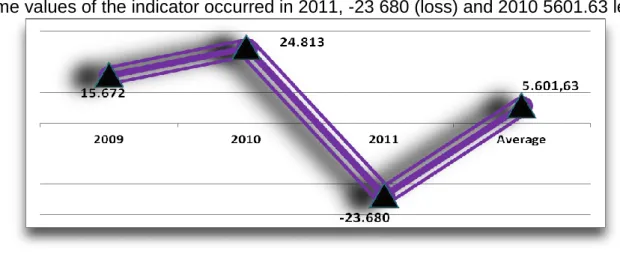
loss (5-6-7) lei 15671,9 100 24813 158,33 -23680 - 5601,63 35,74
9 Operating
profit rate % 33,21 100 52,61 158,42 - - 28,61 86,15
10 Current profit
rate % 33,23 100 42,11 126,72 -
-
25,11 75,56
11 Extraordinary
profit rate % - - - - -
-
- -
12 The gross
profit rate % 33,23 100 42,11 126,72 -
-
25,11 75,56
13 Net profit rate % 27,91 100 35,35 126,66 - - 21,09 75,56
The dynamics is characterized by over-unit value in 2010 (58.42%) and one subunit to the average (-56.17%).
Gross profit or loss is equal to current profit or loss, as the company has not recorded extraordinary profit or loss (Figure 5.).
Figure 5. Gross profit or loss
157
Net profit or loss (Figure 6.) Is characterized by an average of 5601.63 lei, while the extreme values of the indicator occurred in 2011, -23 680 (loss) and 2010 5601.63 lei.
Figure 6. Net profit or loss
Dynamics of indicators is characterized by an over-unit value in 2010 (58.33% compared to the level of 15671.9 lei in 2009) and a subunit for average (-64.26%).
Operating profit rate was 33.23% in 2009, 52.61% in 2010 and 28.61% for the period average. Evolution in time of the indicator is uneven, with a outrunning of 58.42% for 2010 and below par value for the average analyzed interval (-13.85%).
It can be seen that the current profit rate is higher than the previous indicator only, in 2010, 33.23% and less than the rest, 42.11% in 2010 (26.72% dynamic) and 25.11% the average of the period analyzed (-24.44% dynamic).
The gross profit rate is equal to the current rate of profit as the company has not recorded extraordinary profit or loss.
The last indicator of profitability refers to the net profit rate. It may be noted that this indicator has averaged 21.09% (below the level from 2009 by 24.44%), with extreme values of 35.35% for 2010 (26.66% compared to above) and 27.91% in 2009.
CONCLUSIONS
In total income structure prevailing operating income with 99.97%, financial income being only 0.03% of the total. Subsidies are not registered revenue, income related to the cost of production in progress and other income, operating income was equal to net sales and production sold. - Fig.4.1.;
In the company, there were no financial expenses in the period and any extraordinary expenses so that the total was equal to total operating expenses. In operating expenses structure prevailing personal expenses - 55.82%, followed by adjustments to assets - 18.17%, material costs and related goods - 15.26% and other operating expenses - 10.74%. - Fig.4.2;
The unit record operating profit and financial profit - 8158.33 and lei 19.33 respectively, which make current profit - lei 8177.66 except that for 2011 the unit was operating at a loss, which amounted to -23 711 lei;
Given that the unit has not recorded profit or loss is found extraordinary similarity between the current and gross profit;
The unit had net profit of 15,671.9 lei in 2009 of 24 813 lei in 2010, as in 2011 to record loss.
BIBLIOGRAPHY
1. Pânzaru RL, Medelete DM, Ştefan G., 2011, Management and Marketing măsurătoei land Universitaria Publishing House, Craiova
2. XXX, 2001 Guide economic indicators Teora Bucharest