Audit Trails in the Aeolus Distributed Security
Platform
by
Victoria Popic
B.S., C.S. and Math MIT (2009)
Submitted to the Department of Electrical Engineering and Computer
Science
in Partial Fulfillment of the Requirements for the Degree of
Master of Engineering in Electrical Engineering and Computer Science
at the Massachusetts Institute of Technology
September, 2010
c
!
2010 Massachusetts Institute of Technology
All rights reserved.
Author . . . .
Department of Electrical Engineering and Computer Science
August 31, 2010
Certified by . . . .
Barbara H. Liskov
Institute Professor
Thesis Supervisor
Accepted by . . . .
Dr. Christopher J. Terman
Chairman, Department Committee on Graduate Theses
Audit Trails in the Aeolus Distributed Security Platform
by
Victoria Popic
Submitted to the Department of Electrical Engineering and Computer Science on August 31, 2010, in partial fulfillment of the
requirements for the degree of
Master of Engineering in Electrical Engineering and Computer Science
Abstract
This thesis provides a complete design and implementation of audit trail collection and storage for Aeolus, a distributed security platform based on information flow control. An information flow control system regulates all activities that concern information security. By recording all the operations monitored by Aeolus, our audit trails capture all actions that can affect system security. In our system, event records are collected on each system node and shipped to a centralized location, where they are stored and processed. To correlate audit trail events of different system nodes we store event dependencies directly in the event records. Each audit trail record keeps links to its immediate predecessors. Therefore, our audit trails form dependency graphs that capture the causal relationship among system events. These graphs can be used to reconstruct the chains of events leading to a given system state. Our results show that audit trail collection imposes a small overhead on system performance.
Thesis Supervisor: Barbara H. Liskov Title: Institute Professor
Acknowledgments
Foremost, I would like to thank my advisor, Prof. Barbara Liskov. Her help on this project was invaluable. I feel very fortunate to have worked with her and learned from her during this year. I’m very grateful for all the time, patience, and effort that she invested in this work. Her vast knowledge and dedication are truly inspiring. I would also like to thank Prof. Liuba Shrira for her useful insights during the course of this project.
A thank you to everyone in 32-G908 for making my time in the lab more enjoyable. Many thanks especially go to James for his friendship and innumerable advices. Also thank you to Aaron for enduring the long discussions on all kinds of platform details. I’m confident that I’m leaving this project in very good hands.
I wouldn’t be where I am now if it wasn’t for my family. I thank my parents, my grandparents, and my sister for all their care and support throughout the years: thank you for always having trust in me, for the understanding, and for the worries, sometimes about nothing.
I’m also especially grateful to my boyfriend, Zviad, for being so patient and always knowing how to cheer me up.
Finally, thank you, MIT! Thanks to Anne Hunter, my advisors, professors and friends, to the infinite corridor, the coffee shops, 32-123, and my favorite Green build-ing.
Contents
1 Introduction 10 1.1 Related Work . . . 11 1.2 Thesis Outline . . . 14 2 Aeolus Platform 15 2.1 Aeolus Architecture . . . 152.2 Aeolus Platform Implementation . . . 16
3 Event Graphs 18 4 Audit Trail Content 21 4.1 Event Record Format . . . 21
4.2 Event Predecessors . . . 24
4.3 Auditing User Interface . . . 25
5 Audit Trail Events 26 5.1 Authority State . . . 26
5.1.1 Authority Updates . . . 27
5.1.2 Authority Lookups . . . 27
5.2 Node Creation and Deletion . . . 28
5.3 Platform Instance Launch and Shutdown . . . 29
5.4 Service Registration . . . 31
5.5 Remote Procedure Calls . . . 31
5.5.2 Server-Side . . . 33
5.6 Local Calls and Forks . . . 33
5.7 Local Authority Closures . . . 34
5.8 Boxes . . . 34 5.9 Shared State . . . 35 5.9.1 Shared Objects . . . 35 5.9.2 Shared Queues . . . 35 5.9.3 Shared Locks . . . 36 5.9.4 Deleted Objects . . . 36 5.10 File System . . . 36 5.10.1 Client Side . . . 38 5.10.2 Server Side . . . 39
5.11 Use of I/O Devices . . . 40
5.11.1 Application Level Event Creation . . . 40
6 Implementation 41 6.1 Collection and Storage . . . 41
6.1.1 Collection . . . 41
6.1.2 Storage . . . 43
6.2 Event Records . . . 43
6.2.1 Event IDs . . . 43
6.2.2 Eliding . . . 45
7 Auditing Case Studies 46 7.1 Demo Application . . . 46
7.2 The Medical Clinic . . . 48
8 Performance Evaluation 55 8.1 Experimental Setup . . . 55
8.2 General Costs . . . 56
8.3.1 Forks . . . 57
8.3.2 Calls . . . 58
8.4 Remote Procedure Calls . . . 58
8.5 Shared State . . . 59 8.5.1 Shared Objects . . . 60 8.5.2 Shared Queues . . . 60 8.5.3 Shared Locks . . . 61 8.6 Authority State . . . 61 8.6.1 Authority Lookups . . . 61 8.6.2 Authority Updates . . . 62 8.7 File System . . . 62 8.8 End-to-End Evaluations . . . 64 8.8.1 Medical Clinic . . . 64 9 Conclusions 65 A Audit Trail Events 68 B Implementation Details: Audit Trail Collection and Shipment Struc-tures 80 B.0.2 Local In-Memory Collection . . . 80
Chapter 1
Introduction
The purpose of this thesis is to add audit trails to Aeolus, a distributed security platform based on information flow control. Aeolus is designed to facilitate the de-velopment of secure applications that protect confidential information entrusted to them.
However, even applications implemented in Aeolus can contain errors that lead to violations of security, and furthermore, malicious attacks can cause applications to misbehave. Therefore, it is also important to evaluate what the system does in order to determine whether it is behaving as expected, and if not, to discover what led up to the problem.
Monitoring events that occur in a given system can be achieved through the use of audit trails. Audit trails can be used to detect security violations, diagnose performance problems, and discover programming errors. In this project, we focus primarily on the goal of detecting security violations and assume that the system is operating correctly and performs adequately under normal workload.
Support for auditing requires both collecting the data and providing means to analyze it. This work is primarily concerned with the former. We provide a complete design and implementation for collecting and storing audit trails for applications that run on the Aeolus platform. In addition, we provide tools for examining and displaying the collected information.
1.1
Related Work
This section discusses the relationship of our work to previous research in the area of secure audit trails.
Our approach follows many common practices established by earlier work. For ex-ample, we define a format for our event records that includes standard event informa-tion, such as the type of the event, its approximate date and time, and success/failure status [19, 5].
However, our project differs from prior work in a number of ways. First, to the best of our knowledge ours is the first system that does auditing for a platform based on information flow control instead of access control. Information flow control is a reliable way to protect information because it can allow access to the data without also allowing its release. For example, an administrator in a medical system may need to examine patient records, e.g., to set up appointments. With access control, allowing an individual to use information also allows him to release it, e.g., attach it to an email. An information flow control system separates these activities, avoiding information leaks.
A system based on information flow control provides a useful way of determining what events need to be included in the audit trails. In particular, an information flow control system regulates all activities that concern information security. This means that to get a complete audit trail of actions that affect system security, it is sufficient to capture all the operations that are monitored by the system; this is the approach we take in auditing Aeolus.
In this project we focus on auditing in a distributed system. Although auditing has been an active area of research for many years, much of the earlier work deals with stand-alone single-processor machines [14, 18]. Auditing in a distributed set-ting, which includes multiple processors operating asynchronously, introduces several additional concerns [17]. One problem is to determine where and how to collect the logs efficiently. We address this question by following a common audit trail collection pattern; namely, we collect the logs locally on each node and then ship them to a
central location for storage and processing [2].
A much more fundamental problem is how to correlate events recorded on different nodes of the system. On a single processor, events can be ordered using the machine clock. However, this approach does not work in a multi-processor environment. Al-though extensive work has been done on distributing a standard time among system nodes (e.g. NTP [12]), the clocks cannot be synchronized precisely. Nevertheless many distributed systems rely on the availability of accurate timestamps for event ordering; a discussion on this topic can be found in [15].
Lamport logical clocks [10] can be used to get a “happened-before” ordering with minimal overhead. These clocks guarantee that if an event happened before another event, then its logical clock value will be smaller than that of the second event. However, the converse is not necessarily true, i.e., if the clock value of an event is smaller than that of a second event, it is not necessarily the case that this event happened before the second event. Therefore, the total ordering provided by the Lamport clocks is one of many possible total orderings of the system events.
In general, ordering events based on time (i.e. the “happened-before” relationship) cannot be relied on to imply a causal relationship since it does not provide information about how the events actually depend on each other, i.e. about what events could have causally affected others. Vector timestamps [8] derived from Lamport clocks provide a way to capture this information; however, they are not scalable and will cause significant overhead if used in a large distributed system.
In this work we explicitly correlate audit trail records so that we can reconstruct all the dependencies among the recorded events. This is achieved by uniquely iden-tifying each recorded event in the system and storing event dependencies directly in the audit trail. Each audit trail record stores links to its immediate predecessor events. Therefore, our audit trails form dependency graphs, where the nodes are the individual system execution events and the edges represent the causal relationships captured by the predecessor links. From this information, we can easily reconstruct event chains by following the event predecessor links. For example, we can find all the events that could have led to an invalid system state.
Recent work on backtracking intrusions [9] presents dependency graphs constructed by recording system calls that induce dependency relationships between OS-level ob-jects (e.g. creating a process, reading and writing files). These graphs differ from the ones generated by our audit trails since their nodes represent the individual system objects (e.g. files and processes) and the edges represent system calls that involves these objects (e.g. a process executing a file). In our system, as explained above, the nodes are the events recorded during system execution (e.g. file read, I/O device write) and the edges capture their causal relationship (e.g. a file read affects the subsequent write of a different file).
There is a large body of work on audit trail discovery, e.g. intrusion detection. A survey of this work can be found in [11, 15]. This work is concerned with discovering anomalous user behavior, for example, using statistical analysis or attack signature-detection [20, 22, 21, 13]. Although our project is primarily concerned with audit trail collection, we need to ensure that our audit trails capture all the information necessary to enable a useful audit trail analysis. Prior work introduced the concept of goal oriented logging [3, 2]. This is the idea that the goals of the auditing process should determine what information is logged. Bishopet al. [3] propose deriving audit trail content requirements from the security policy of the system that partitions all system states into secure and non-secure. The content of an audit trail then needs to monitor all the events that can lead from a secure to a non-secure system state.
Our audit trails monitor events at the level of the user application interaction with the Aeolus security platform. Logging at the interface to the Aeolus platform allows us to capture all the security-sensitive system activity. As mentioned earlier, this is because any operation that uses or affects information flow, which is at the basis of our security model, is mediated by the Aeolus platform. In addition, we also provide an interface to our auditing subsystem that can be used to capture application-level events.
1.2
Thesis Outline
The remainder of this thesis is structured as follows. Chapter 2 presents the relevant background on the Aeolus security platform and its implementation. In Chapter 3 we discuss how we reconstruct the history of program executions using Aeolus audit trails. Chapter 4 describes the format of audit trail records and what kind of infor-mation they capture. In Chapter 5 we provide specific inforinfor-mation about the events stored in the audit trail. Chapter 6 describes the implementation techniques used to build the audit trail collection framework and Chapter 7 presents several examples of how audit trail data can be used to monitor and evaluate system activity. Chap-ter 8 evaluates the audit trail overhead on the performance of the system. Finally, Chapter 9 concludes and discusses future work for this project. Appendix A provides a complete summary of all the events recorded in the audit trails and Appendix B includes a detailed description of the data structures used to collect and ship audit trail data in our current prototype.
Chapter 2
Aeolus Platform
A complete description of the Aeolus platform can be found in Cheng[6]. In this chapter we briefly present some relevant Aeolus background information. We begin by describing the high-level platform architecture in Section 2.1 and then introduce several key implementation concepts in Section 2.2. Any major differences between the current platform implementation and the work presented in [6] will be discussed in the appropriate sections of this thesis.
2.1
Aeolus Architecture
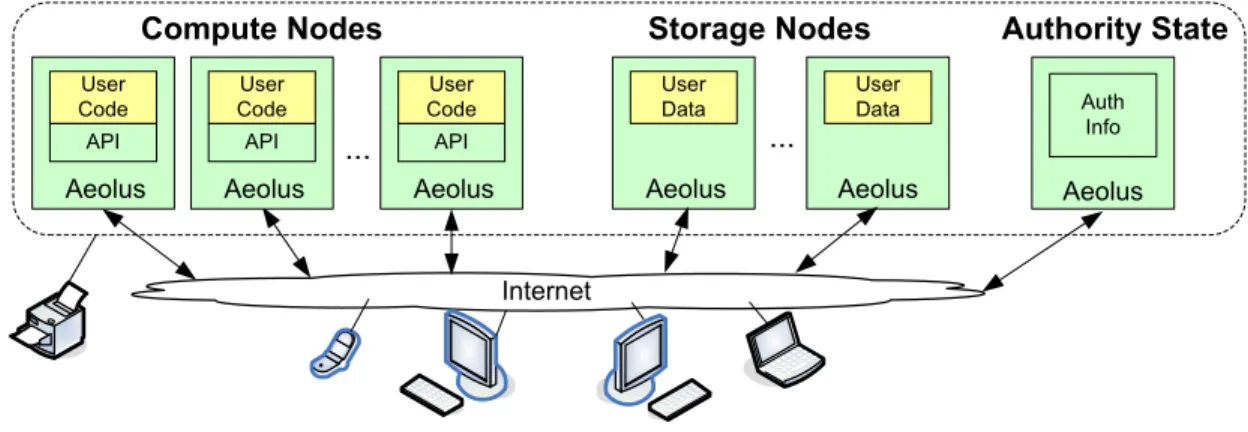
Aeolus is a distributed security platform based on information flow control: it tracks information as it flows through programs and determines whether programs have the authority to perform certain security-sensitive operations. Figure 2-1 shows the high-level architecture of the platform. This figure shows the Aeolus platform running on a collection of nodes divided into two categories: compute nodes and storage nodes. Compute nodes are intended to run user application code and storage nodes are used to persistently store sensitive user data (note: a node can be both a compute and a storage node). Aeolus also includes a logically centralized shared authority state (AS). Aeolus nodes consult the authority state in order to determine whether privileged operations should be allowed. Communication can occur among Aeolus system nodes, as well as with outside nodes and I/O devices, which are not trusted.
encrypted so that secrecy and integrity are protected. Aeolus also controls the flow of information between the inside and the outside of our system. This flow can take the form of communication with outside nodes. It can also involve the use of I/O devices: all I/O devices are considered to be outside the system. If information is flowing to the outside, the flow is allowed only if the application trying to send information has the authority to declassify it (i.e., remove its contamination). Similarly, information coming in from the outside has no integrity, which implies that the application re-ceiving the information must have authority to endorse it if needed (e.g., verify the input prior to storing it in a file).
Similar to other systems that provide information flow control, Aeolus tracks information as it flows through programs, and determines whether programs have the authority to perform certain security-sensitive operations, such as releasing secret data. The latter operations require some way to track who has authority for what.
In Aeolus, this is done through authority state, which is maintained by our platform.
The authority state is logically centralized (although the implementation could be distributed). ... Internet API User Code Aeolus API User Code Aeolus API User Code Aeolus
Compute Nodes Storage Nodes User Data Aeolus ... User Data Aeolus Authority State Aeolus Auth Info
Figure 2-1: Aeolus Distributed Computing Environment
This architecture is illustrated in Figure 2-1. This figure shows an Aeolus system configuration with some nodes inside the system and others outside; additionally the devices are outside. The figure also shows that each node inside the system runs the Aeolus platform, which determines whether security-sensitive operations can be performed by consulting the authority state. As mentioned earlier, all user
26
Figure 2-1: Aeolus Distributed Security Platform
More details about the Aeolus platform architecture can be found in Chapter 2 of [6].
2.2
Aeolus Platform Implementation
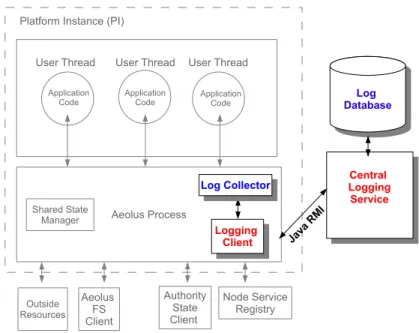
As shown in Figure 2-2, each compute node runs a set of platform instances (PIs). Within each platform instance there is an Aeolus system process, which has access to all system resources, and many user threads managed by the Aeolus process. User threads make calls to the Aeolus process to get access to various system resources (e.g. the file system and I/O devices). User code is executed in the user threads. It interacts with the Aeolus platform through a set of methods exposed by the Aeolus User API. Chapter 3 of [6] contains a detailed description of all the provided methods. Each platform instance also has an audit trail collector object that is responsible for collecting and shipping audit trail events from all the user threads in the platform instance and a shared state manager that provides user access to shared memory.
In order to allow RPCs among Aeolus nodes, each node maintains a registry of services provided by platform instances at that node. In addition, each node also includes an authority state client that manages interactions with the authority state server and file system clients that manage interactions with the corresponding storage nodes.
!"#$%&' ('$)"*+'$ ,')-"$. /0 1-%'2# ,"#3)*%#4 0#5#' 1-%'2#. ,"&%#.6*5%-1)--'+#)* 7$'*.63*'5& 035*'&.0#5#' 85259'* !"#$%&'()*+,$#+-.)/!*0 7$'*.63*'5& 7$'*.63*'5& 122"3-#$3&+) 4&5. 1.&"6,)4&(26$.)7&5. :)&'.0'*;%+' ('9%$#*4 )1.&"6,) !'&-.,, 122"3-#$3&+) 4&5. 122"3-#$3&+) 4&5.
Chapter 3
Event Graphs
The purpose of an audit trail is to enable the reconstruction of the history of a system execution. As a system runs, we need to capture “events” that represent what it is doing. Furthermore, to reconstruct the chain of events leading to a given system state, we need to correlate the events in the system - we need to order them, recognizing any dependencies between them. Since Aeolus is a distributed system, we cannot rely on system timestamps as a means for ordering the events due to the possible lack of synchronization among machine clocks. One possibility would be to use vector timestamps [8]; however, these are not scalable and would result in a significant overhead.
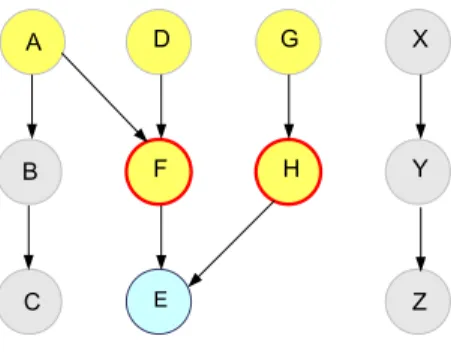
Audit trails in our system are represented as event graphs, where each event records some action that occurred as the system ran. We capture dependencies be-tween events by storing them directly. Each audit trail event stores links to the events that immediately preceded it. Following these predecessor links, we can reconstruct a partial event order and thus correlate certain events in the log. More specifically, given an event in the log, E, we define P red(E) to be the set of events that are immediate predecessors ofE (we describe what these predecessors are in Chapter 5). Iteratively applying the predecessor relation starting with E:
E →P red(E)→P red(P red(E))→...,
! " # $ % & ' ( ) * +
Figure 3-1: Event Dependency Graph. Predecessors of event E are highlighted in yellow; direct predecessors are contoured in red.
events that could have causedE.
In other words, audit trail event entries together with their predecessor links form anevent dependency graph of all the events recorded during the run of an application. These event dependency graphs are directed acyclic graphs (DAGs) where the nodes represent the recorded events and the edges denote the event predecessor relationship (i.e. there will be an edge A → B in the graph if node A is the direct predecessor of node B, that is, the set P red(B) includes A). Therefore, a given event P is a predecessor of another event E if there is a path from node P to E in the event dependency graph and so all the events that could have caused E are the nodes in the graph that have a path to E. These graphs have no cycles due to the temporal nature of the predecessor relation: if an eventA is a predecessor of an event B, then it must have occurred prior to B (note: there are no self-edges in these graphs since an event cannot be its own predecessor). In order for a cycle to occur, there needs to be some event C such that B is a predecessor to C and C is a predecessor to
A; however, if B is a predecessor to C, then C must have occurred after B and, by transitivity, after A and so it cannot be a predecessor to A.
Figure 3-1 shows a sample event dependency graph. The direct predecessors of
E are the events F and H (i.e. P red(E) = {F, H}). Events A, D, and G are also
E’s predecessors since there is a path from these events to E (P red(P red(E)) = {A, D, G}).
It is important to note that predecessor links do not provide us with a total or-dering of all the events in the system and only allow us to order events that somehow depend on each other. Concurrent events will be part of separate predecessor de-pendency chains and cannot be correlated. For example, in Figure 3-1 we cannot correlate the chain of eventsX →Y →Z with any other events in the graph. How-ever, since each event entry in the log includes an approximate timestamp, we will be able to recognize the order of events occurring at sufficiently different times.
Chapter 4
Audit Trail Content
An Aeolus audit trail is an event log that monitors user code interaction with the Aeolus platform; more specifically, it records the invocation of every method exposed by the Aeolus User API. Each use of the Aeolus platform corresponds to one or more event records in the log. By logging at the level of the Aeolus interface, we guarantee that we can capture all security-sensitive operations. We also provide an interface to the auditing subsystem that can be used to capture additional events. This interface can be used by an application to record events that correspond to application level activities. The Aeolus audit trail could also include events that correspond to internal Aeolus platform actions. These events would be useful in debugging the platform code; however, we do not investigate this use in this work.
We begin in Section 4.1 by describing the format and content of the recorded events. Section 4.2 provides more details about what are the predecessors of an event and introduces the terminology used to refer to them throughout the thesis. Finally, Section 4.3 describes the operational interface to the auditing layer that can be used to record additional application level events. Chapter 5 describes what events are placed in the log for all the operations that make up the interface to Aeolus.
4.1
Event Record Format
<eid, preds, method-name, parms, status, ret-val, timestamp>. We now briefly describe each included field.
Event ID (eid)
Each event record is associated with a globally unique event ID. This ID is used to refer to a particular event from other event records.
Event Predecessors (preds)
Event predecessors are a set of event IDs that correspond to events considered to have immediately preceded the given event; that is, events upon which the given event depends directly. We store the IDs of the predecessors to allow us to correlate and order the event entries in the log. Since each event has a globally unique ID, the stored predecessor IDs will always resolve to the appropriate events. Section 4.2 describes how the predecessors are determined.
Method Name (method-name)
The method name identifies the type of the recorded event (e.g. a file read or a principal creation).
Parameters (parms)
The parameters are the user-supplied arguments to the methods of the Aeolus API that are relevant to Aeolus (e.g. the name of the file a user is trying to read or the labels for a shared state object to be created). We do not log application level user-supplied arguments, such as arguments to remote procedure calls, or the data being written to a file or to a shared state object. This information can be recorded at the application level using the interface for application level logging. Storing event parameters allows us to filter on events involving arguments of interest; for example, we might want to track all the delegations of a given tag or find all the failed attempts to release a sensitive file. Although the current prototype does not
support backtracking, user-supplied parameters can help support this functionality in future work.
Status (status)
The status denotes the event outcome: whether it succeeded or failed. An operation can fail in an expected way due to an illegal argument or non-deterministically due to an unpredictable cause, such as a system network or I/O exception. Although we assume the system is operating correctly (and hence will not generate exceptions due to system code bugs), we would not be able to tell whether an operation actually succeeded (and hence induced some changes to the state of the system) due to possible unpredictable failures associated with many Aeolus operations. For example, we can predict any failures due to information flow constraints or access of non-existent files or shared state objects; however, we cannot predict a network failure during an RPC or authority client communication with the authority server. Although it might be useful to diagnose certain problems, we do not explicitly specify the cause of an operation failure since it is not needed to satisfy our primary security goal specified above.
Return Value (ret-val)
The return value of an event is an Aeolus-related result generated by the operation. As with parameters, we do not log application-level information, such as the data returned from a file read. The return value can be useful for event log filtering; for example, we might be interested in the creation event of a given principal, tag, or shared state object - this event can be found by matching the return value with the given object ID.
Timestamp (timestamp)
The timestamp provides an approximate time at which the event occurred. Although local system timestamps cannot be used to order events in a distributed system, they can be useful for filtering audit trail data; for example, they can be used to answer
questions about what was happening in the system approximately before, at, or after some given time of the day.
4.2
Event Predecessors
Most events are recorded during the execution of a user application. These events always have at least one direct predecessor event, which is the event that immediately preceded them in the same user thread, referred to asP-Pred. More specifically, this event is the latest interaction with the Aeolus platform of the same user computation.
The P-Pred links provide a way to order all the events in a given user process.
If there were no communication between user processes, P-Pred links would be sufficient to capture most of the user event dependencies. However, Aeolus provides several mechanisms for inter-process communication: user processes can communicate via the shared state, the file system, remote procedure calls, and, implicitly, through the authority state. Any point of communication between two separate processes creates a dependency between the events in these processes. For example, if a process
A writes to a file and another process B later reads from this file observing what A
wrote, then all the events in B starting with the file read depend on A’s file write event; therefore, the file write event serves as a predecessor to the file read and, by transitivity, to all the subsequent events of B. For this reason, audit trail entries corresponding to communication events usually store a second predecessor,C-Pred, that may represent an event in a different user process.
To summarize, an event can generally have two predecessors: P-Pred and
C-Pred. P-Pred is the event that immediately preceded the given operation in the
same user process and C-Pred is an event of a possibly different user process that also logically precedes the given operation due to some form of inter-process commu-nication.
The mechanism of determining and assigning C-Preds is different for each com-munication mechanism. Chapter 5 describes the mechanisms that Aeolus provides for inter-process communication and what the logical C-Preds are for each type of
their explicit or implicit communication events.
4.3
Auditing User Interface
Although Aeolus records all security-sensitive operations executed by the user appli-cation code, developers might be interested in including additional events into the audit trails. We provide a simple interface to our auditing subsystem, which allows adding application level information to Aeolus audit trails. This interface is an ex-tension to the Aeolus User API.
In order to add an event to the audit trail, applications can use theCreateEvent
operation. This operation creates and stores a new event in the audit trail and returns the ID of this event. This operation is treated like any other invocation of the Aeolus User API and the new event is correlated accordingly with other events in the same user process; namely, its P-Pred is set to the previous invocation of an Aeolus API method by the same user thread. Applications can use the returned event IDs to correlate their events; namely, they can specify them as predecessors when creating other events. The created event has the same format as all other platform level events; the arguments to the operation correspond to the fields described in Section 4.1.
Creating a new event :
• eid createEvent(preds, method-name, parms, status, ret-val,
timestamp): Creates a new event in the audit trail and returns its event ID.
The method name must be specified as a string; the parameters and the re-turn value must be serializable objects, so that they can be persistently stored and retrieved. This event automatically has the previous event of the calling thread as itsP-Pred; additional predecessors can be specified using the preds
Chapter 5
Audit Trail Events
This chapter describes in more detail what event records are included in the audit trail for each type of user code interaction with the Aeolus platform. Each section begins with a brief description of the mechanism involved and then discusses the audit trail content it generates. A summary of events associated with each Aeolus operation can be found in Appendix A.
5.1
Authority State
We differentiate between two types of authority events: updates and lookups. Author-ity updates (e.g. authorAuthor-ity delegations or revocations) are processed at the authorAuthor-ity server, while authority lookups (e.g. checks if a principal has authority for a given tag or can switch to another principal) are answered by the local authority client of each Aeolus node.
Although the authority state is not a mechanism for direct user process commu-nication, authority events from one user process can influence the result of authority events that follow them in a different user process and can logically serve as their predecessors. For example, if principal A delegates authority for tag T to a different principal B and the event of checking B’s authority for tag T during a declassify succeeds, then the authority delegation event is a logical predecessor of the success-ful authority check event (assuming B did not already have authority for T from
somewhere else).
5.1.1
Authority Updates
Authority updates can be issued concurrently by different user processes and are serialized at the authority server, which propagates these updates to authority clients. Each update operation corresponds to three events in the audit trail. Two events are logged at the client node. These correspond to the authority update request and reply, respectively. When the authority server receives the update request it logs an additional event that represents the update operation at the server. The C-Pred
of this event is the authority update request from the client and its P-Pred is the update event that was serialized immediately before it at the server. The update event at the authority server is the C-Pred of the update reply event at the client;
theP-Predof the reply event is the update request. Figure 5-1 shows the correlation
of the events at the authority server and two authority clients.
!"#$%&!'(&)!&*% !"#$%&!'(&"+, *&(-&('!"#$%&" #$%&'()* +,(-./%(0)1&/2&/ *&(-&('!"#$%&! ... !"#$%&"'(&)!&*% !"#$%&"'(&"+, #$%&'()3
Figure 5-1: Authority Updates Correlation
5.1.2
Authority Lookups
An authority lookup operation corresponds to one event in the audit trail. Authority lookups are processed at the authority client, which caches authority state and may not be up to date with the authority server. TheC-Predof these events is the latest
authority update event seen by their authority client - i.e. the latest authority update reflected in the answer from the authority client.
5.2
Node Creation and Deletion
Once the authority state is running, nodes can be added to the Aeolus system. The creation of an Aeolus node takes place in several steps. First the node is registered with the authority state. As part of node registration, the authority state creates a root principal ID for this node (the first platform instance on that node will run on behalf of this principal ID). After registration, various node components are initialized (for example, the file system manager (if this is a storage node), and the logging client; the node also keeps structures to track platform instances it has launched and the services they provide. Finally, the first platform instance is created on this node to run the start-up application code. When the node is launched, a node creation event is logged. This event record stores information about the node, such as the node’s hostname and root principal ID. This event has noP-Pred since it is the first system event on this machine; however, it has aC-Predevent returned as part of the authority state registration reply, representing the registration event at the authority server. After the node creation event, two more events are recorded. First an event is created to represent the launch of the start-up PI. This event has the node creation event as its predecessor; the platform instance launch events are described in more detail in the next section. The second event is the launch of the first user thread in the start-up PI, which has the platform instance launch event as its predecessor and stores the principal ID that the thread runs on behalf of.
A node can also be deleted from the Aeolus system. Upon node deleted, the authority state is notified to remove the node from the system. Two events are created for this operation in the user thread requesting the deletion: the request event, which includes the information about the node (i.e. node hostname), and the reply event. An event is also recorded at the authority state server to represent the deletion at the server.
5.3
Platform Instance Launch and Shutdown
As mentioned in Section 5.2, when a node starts up, Aeolus launches the start-up platform instance. In addition, Aeolus provides a mechanism to launch other platform instances locally and remotely. When a platform instance is created, it is associated with a principal ID (the start-up platform instance of each node runs on behalf of the node root principal). Application developers can specify what principal to launch a platform instance with, as long as information flow rules are obeyed (namely, the caller has null labels and has the authority to act on behalf of the specified principal). The caller also specifies what application to run in this platform instance and any application arguments (the application is specified as the full path name to its class). This code starts running in a user thread of this platform instance.
The launch of a platform instance caused by a call in a user thread corresponds to five event records in the audit trails. The first event is the PI launch request, which includes the parameters discussed above, such as the platform instance’s principal ID and the application name (the arguments to the application are not included). This event has only one predecessor; namely, itsP-Pred. The second event is logged when the new platform instance is created at the appropriate Aeolus node. This event has as its P-Pred the node creation event and as its C-Pred the PI launch request event; it also stores the the platform instance’s principal ID and the application name. The next event is logged when the first user thread of this platform instance is launched to run the specified application. After this application thread finishes, the return from the PI launch event is created. The P-Pred of the return event is the latest invocation of an Aeolus API method in the user application thread. This event becomes the C-Pred of the final event recorded for this operation. This last event is created in the thread that issued the launch request and represents the PI launch reply.
In the case of the start-up platform instance launch only three events are recorded. These events are the events described above excluding the request and reply events of the caller user thread.
Figure 5-2 shows the correlation of the platform instance launch events. The events recorded during the start-up platform instance launch are the three events at the server side; the figure also shows the node creation event that triggers the start-up platform instance launch.
!"#$%&'()'*+,#+-. !"#$%&'()'*+/!0 !"#$%&'() !"#$%&'#-+*'.&*+"1 %*+".+'$21+ !"#$%&'(#)$ ($*+$*'(#)$ !"#$%&'()'*+.#*$ 333
Figure 5-2: Platform Instance Launch Events Correlation
We are interested in knowing what code is being executed at this platform instance. To monitor this, we log the hash value of the loaded application class (this is achieved by extending the default Java ClassLoader to compute the MD5 hash function of all the classes it loads).
A platform instance can also be shut down locally or remotely. This operation corresponds to four events: the shutdown request and reply in the caller user thread and two events for the shutdown at the appropriate node. When shutting down, the platform instance terminates all its user threads and unregisters its services from the node registry. It also ships any remaining event records to the centralized collector (see Chapter 6 for more details about the audit trail collection framework).
5.4
Service Registration
In order to enable communication between system nodes, each node has a registry of services it hosts. A user thread in a PI can register a service with Aeolus that will be handled by that PI and a user thread on a different node can invoke a method on this service (via the RPC mechanism described below). When registering a service, the name of the service and the name of the implementing class are specified. The service registration corresponds to one event in the audit trail. This event stores the name of the service being registered.
5.5
Remote Procedure Calls
Users can invoke methods on remote services registered with Aeolus by retrieving a service proxy from Aeolus at the client side - this proxy serves as a local reference to the remote service object. A method invocation on this proxy triggers Aeolus to send an RPC request from the client node to the node hosting the service. This request carries some Aeolus specific information necessary to start the processing of the RPC request at the server (such as the caller’s process labels), as well as information about the invoked service, method, and the user-supplied parameters to the remote method call. When the server receives an RPC request it forwards it to the PI that handles that service; the PI then starts a new user thread with the specified information flow state running the specified service method (this thread runs on behalf of the platform instance principal). When this new thread finishes, it sends back an RPC reply to the client carrying the result of the computation and its process labels in order to propagate any contamination back to the caller.
RPCs cause four events to be added to the audit trail: two events at the client side (send-RPC and receive-RPC-reply) and two events at the server side (receive-RPC and send-RPC-reply). We correlate the events at the client and the server side, such that the first event that occurs at the server side as a result of the RPC request has as
after receiving the RPC reply has as its C-Pred the last server-side event recorded during the remote method invocation. This is achieved by carrying predecessor event IDs via the RPC request and reply. Furthermore, the node service registry serves as an indirect communication point for service registration and invocation events. More specifically, if upon the receipt of an RPC request at a given Aeolus node, the requested service is found on that node, then we know that the service registration event is a predecessor to the subsequent events generated by this RPC’s receipt. Therefore, a predecessor of the receive-RPC event is the registration event of the service whose method is being invoked.
Figure 5-3 shows the correlation of the client and server side events, as well as the service registration and access events, which is achieved through the platform instance service registry.
!"#$%&'( )"*"+,"%&'(%)"-./ )"*"+,"%&'( !"#$%&'(%)"-./ )"0+!1")%!"),+*" 222 !"#$%&'(#)$ ($*+$*'(#)$
Figure 5-3: Remote Procedure Call Events Correlation
5.5.1
Client-Side
Before a user thread can make remote procedure calls it needs to get the service proxy from Aeolus. This operation corresponds to one event in the audit trail that specifies the name of the obtained service. Each remote method invocation on a service corresponds to two events at the client side. The first event is the send-RPC request, which is generated when a method is invoked on the local service proxy. This
event stores information about the service and the remote method being invoked (the parameters to the remote method are not recorded). The second event is registered upon the receipt of the RPC reply. This event has two predecessors. Its P-Pred is the send-RPC request event and its C-Pred is the last server event.
5.5.2
Server-Side
Similar to the client side events, two events are recorded at the server side for each received RPC request. After a new user thread starts processing the RPC request, the first event in this new thread is the receipt of the RPC request. This event has two predecessors: the send-RPC request event at the client and the registration event of the service being invoked. When the method invocation returns, the send-RPC-reply event is generated, which becomes the predecessor of the receive-RPC-reply event at the client. The P-Pred of this event is the latest event generated by the remote method or, if no events were recorded during the remote method execution, it is the receipt of the RPC request event.
5.6
Local Calls and Forks
Users can make a local call with a different principal by invoking the Aeolus Call
operation, which runs the user-supplied code object with the desired principal ID in the same user thread. Two events are recorded for this operation: one for the call and one for the return from the call. The call event stores the principal ID that the call runs with; it does not store the actual code. Both events only have one predecessor. The event record for the return event has as its P-Pred the latest event recorded during the execution of the supplied code object.
Users can also fork a new user thread by supplying the code and principal for this thread. An Aeolus Fork operation corresponds to two events: a fork request event recorded in the parent thread and the launch of the new user thread event recorded in the child thread. The fork request event is the predecessor of the new user thread launch event. As with the Calloperation, the fork request stores the principal of the
child thread but does not store the code object being run in that thread.
5.7
Local Authority Closures
Authority closures provide the ability to grant authority directly to code. Users can create authority closures by specifying the full class name of the desired closure to
the CreateClosure operation. This operation corresponds to one event in the audit
trails. A closure creation call is an authority update event and therefore has two predecessors (its C-Pred is the latest authority update event at the server). It stores as a parameter the class name of the closure. It also stores the closure ID as its return value.
To run a closure, users need to get an instance of the given closure type by providing the appropriate closure ID to theGetClosuremethod. This operation also corresponds to one event in the trail. A call to the authority client is made to get the information associated with the given closure ID; this is an authority lookup event and, therefore, this event also has two predecessors (as described in Section 5.1).
Finally, the closure object can be invoked using the CallClosure method. This operation executes the closure code inside the same user thread with the authority associated with the closure ID. This is similar to the local call operation. Two events are logged: one for the call and one for the return from the closure.
5.8
Boxes
Boxes encapsulate sensitive data, allowing it to be passed around without contami-nating the process unless the box content is accessed. Users can create anAeolusBox
object by setting its inner and outer labels. Content can be read and written to the box based on the inner labels. A process can also retrieve the inner and outer labels of the box if the box outer labels permit. Each box operation corresponds to one event record. Since users can share data using the box content, theC-Pred of a box content read or write operation is the event that last updated the box content (or
the box creation event, if no content has been written to the box). In this way, we can know what information was observed by a given box content read event and we can capture the order of box content write events. TheC-Predof the inner or outer label retrieval is the box creation event.
5.9
Shared State
The shared state provides a way for user processes of the same platform instance to exchange information and synchronize. There are three ways of communicating via the shared state - through the use of shared objects, shared queues, and shared locks. Each shared state operation corresponds to one event in the audit trail.
5.9.1
Shared Objects
Shared objects allow for content to be stored and retrieved from the shared state by different user processes. Users can create a shared object, read its content, update its content, and delete the object. Each operation (except create) has as itsC-Pred
the event thatlast updated the content of this shared object. Therefore, a write to a shared state object is a predecessor to any subsequent reads and the subsequent write or delete of this object. The create event is treated as a first write of the object.
5.9.2
Shared Queues
Shared queues provide messaging capabilities to user threads by allowing them to enqueue and dequeue items. Information can be shared via the objects enqueued in the shared queue and also via the order in which the objects were enqueued. When a process dequeues an item from the queue, it gets access to the content provided by a potentially different process; therefore, the C-Pred of each successful dequeue operation is the enqueue event of the dequeued item. To maintain the order of the enqueue and dequeue operations, the C-Pred of an enqueue event is the event that
is the C-Pred of the first enqueue event.
5.9.3
Shared Locks
Shared locks are provided to allow for user process synchronization. Users can create a shared lock and execute lock, unlock, and trylock operations on it. These opera-tions are also considered process communication events although they don’t directly share any data. The C-Pred is maintained such that the chain of lock and unlock operations on a shared lock can be reconstructed. More specifically, a lock (or suc-cessful trylock) operation will be a predecessor of the unlock operation and the unlock operation will be a predecessor to the subsequent successful lock or trylock.
5.9.4
Deleted Objects
A problem arises with setting the C-Pred of events accessing shared state objects that have been deleted. Ideally, we would like to set the C-Pred of such an event to be the object’s deletion event; however, this would require us to keep the deleted objects in the shared state forever. We do not store these objects and instead fill in the record’s C-Pred field in the post-collection processing step by finding the deletion event for the appropriate object and setting theC-Predfield to that event’s ID. Since multiple delete operations could have been issued for the same object concurrently, we are interested in the delete operation that actually succeeded, which will be captured by the event’s status field. If the delete event is not found because the deletion event occurred a long time ago and has been archived, this field will remain blank.
5.10
File System
In the Aeolus distributed platform, sensitive user data can be stored persistently on designated storage nodes. Each storage node runs an Aeolus FS manager, which is responsible for servicing file system requests on data stored in the node’s underlying file system. Each Aeolus file and directory is associated with an immutable secrecy
and integrity label, specified at creation time. Before data can be read from or written to a file or directory, Aeolus FS checks these labels and ensures that the requesting user process is authorized to perform these operations. In the current implementation, the label information is stored in a separate hidden metadata file (co-located with the data file).
Users can communicate with specific storage nodes by invoking corresponding file system methods of the Aeolus API and passing the hostname of the desired storage node as an argument to these calls. When a request is submitted for a given storage node for the first time at a compute node, a new Aeolus FS client is created to communicate with the Aeolus FS manager running on the specified node (there will be one client running on a given Aeolus node for each storage node that a user process on that node has communicated with). The Aeolus FS client submits file system requests to its Aeolus FS manager. To improve performance, the Aeolus FS client caches the information received from the manager. The client cache stores file content and labels based on the file pathname. If the data for a file is present in the cache upon a file read operation, the client checks the file labels and returns the data from the cache if the read is permitted. All file writes and directory updates (i.e. file and directory creations and deletions) are forwarded to the server. To ensure causal consistency, the server invalidates files in client caches by piggybacking a list of file names that have been modified in each client reply (the server also sends periodic invalidations to the clients). File stream operations are treated as block reads and writes; more specifically, when a file stream is open for reading, the entire file content is fetched to the client and writes to a file stream are accumulated locally and only sent to the server when the file stream is closed (as one file write).
We need to capture dependencies between events of different user threads that communicate by observing and updating data stored in the file system. More specifi-cally, we want to set theC-Predof each file read and write event to be the event that corresponds to the write operation that they observe (we treat directory content list-ing and file creations and deletions as reads and writes to the directory, respectively). Therefore, we would like to know the latest write event of each file or directory. One
possibility would be to keep this information in the metadata file that currently just stores the labels (this is similar to the shared state approach); however, this solution would require an additional write of the metadata file per each data file write opera-tion (each file write would need to update the metadata file to reflect the latest write event). To avoid the cost of two disk writes, we have the Aeolus FS manager log its own events and correlate these events with those at the user side compute nodes. We describe this approach in detail below. Figure 5-4 shows the correlation of events recorded at the file system server and client side for file read and write operations described below. !"#$%&'(" )"!*"!%!"#$%&'(" !"#$%&'("%!"+(, -!'."%&'(" )"!*"!%-!'."%&'(" -!'."%&'("%!"+(, !"#$%&'(" !"#$%&'("%!"+(, -!'."%&'(" )"!*"!%-!'."%&'(" -!'."%&'("%!"+(, !"# !$#
Figure 5-4: File System Events Correlation. (a) Events generated by two consecutive reads of the same file. The first read is cached at the client. (b) Events generated by two consecutive writes to the same file. The two write events at the server are correlated in the post-collection step.
5.10.1
Client Side
Each file system operation invoked through Aeolus corresponds to two events at the file system client side (i.e., in the invoking user thread). The first event represents the
file system operation request (e.g., file read request). This event includes information about the file involved (e.g. the file path name and file labels if the file is being created) but does not include application level data, such as the content written to or read from the file. The second event represents the file system reply and includes any Aeolus-relevant information returned from the file system to the client; for example, its status indicates whether the operation failed at the server, which could be due to a violation of information flow control rules. This event has two predecessors: its
P-Pred is the request event and its C-Pred is the event at the file server that the
reply observes.
5.10.2
Server Side
Aeolus FS manager receives concurrent file system requests from its clients. For each given file, it serializes the requests for this file such that there are no concurrent writes or concurrent reads and writes (i.e. only concurrent reads are allowed). Therefore, the Aeolus FS manager observes the exact order of file write operations for each given file and for each file read operation it knows what write operation preceded it (since reads and writes do not run concurrently).
The order that the manager observes is reflected in the order of its logged events. For each client request, the manager logs an event after the execution of this request. This event has as its predecessor the request event from the client. The manager then forwards the ID of its server event back to the client where that is set as the predecessor of the reply event. The client also stores this ID in its cache, so that any read from the cache has this event as its predecessor. Since operations are serialized at the server, we can reconstruct the predecessors of each server event in the post-collection step: for each file operation, we can find the latest update event at the server stored earlier in the log.
5.11
Use of I/O Devices
Users can write or read from various I/O devices. I/O devices are considered to be outside of our system. To ensure that sensitive data cannot be leaked outside the system, writing to an I/O device is only allowed if the security label of the user thread is null. To ensure that low-integrity data does not influence a high-integrity user thread, reading from an I/O device is only allowed if the integrity label of the user thread is null. Both operations correspond to one event record in the log, which denotes whether the user was reading or writing to a device outside the system. In the current prototype, we do not include information about the device being accessed; however, this can be included in the future.
5.11.1
Application Level Event Creation
Applications can include additional events in the audit trail by calling thecreateEvent
method of the interface to our auditing sub-system. This method creates an event containing the user-supplied information and sets its P-Pred to the latest event in this user thread.
Chapter 6
Implementation
In this chapter we describe our audit trail collection and storage strategy, as well provide more details about what information is actually stored in an event record. More details on the implementation of the collection data structures can be found in Appendix B.
6.1
Collection and Storage
6.1.1
Collection
The audit trail collection framework consists of a central logging service responsible for aggregating event records generated across the entire system and logging clients
responsible for sending local event records to the central service.
As illustrated in Figure 6-1, each platform instance runs a logging client that ships the event records generated by its user threads’ activities to the central logging service via Java RMI. To optimize performance, event records are sent to the logging service
periodically in batches, instead of sending an event record as soon as it is created.
This strategy may lead to some events being lost if a node fails; we leave the repair of the audit trail in the presence of failures as something to be dealt with in future work (see discussion in Chapter 9).
collector. The log collector accumulates event records based on the ID of the user thread in which the corresponding user operation ran. When an event record is created, it is appended to the collection of event records generated by its user thread. This allows event records generated concurrently by different user threads to be stored in parallel.
When the records are shipped to the central logging service they are assembled into a structured collection that maps the user thread ID to a list of its event records. The event record shipment is scheduled at a fixed time rate, as opposed to shipping when a given record volume has been reached; the rate is a configuration parameter, e.g. 1 second. Along with the event records, each shipment also includes the ID of the sender platform instance and a system timestamp: all the events in this shipment will be stored with this timestamp to reduce performance overhead of querying the system clock every time an event occurs.
!"#$%&'()#*"&& +%,&-." /"&#%)*"& !"#$%&' 01 2$-"3, !%,4#)-,5 1,6," 2$-"3,' !"##$%#& '($)%* !"##$%#& '($)%* !"#& +,*,-,.) !"#& +,*,-,.) ')%*/,(& !"##$%# 0)/1$2) 7&")'84)"6. !"#&'"(()2*"/ !"#&'"(()2*"/ 146)".'1,6," 9636:") ($6,;#)<'=3&,63*"'>(=? 7&")'84)"6. 7&")'84)"6. !@@$-*6,-#3' 2#." !@@$-*6,-#3'2#." !@@$-*6,-#3'2#." A#."'1")B-*" /":-&,)5 3,1, &45 6
6.1.2
Storage
After arriving at the central logging service, the event records are processed and stored in a logically centralized database. The processing step includes filling in the timestamp field, as well as the P-Pred if it’s missing (the next section explains why this predecessor is not stored whenever possible). However, this field is easily derivable since the event records are stored and shipped in the order that they were created by the user thread; therefore, with some exceptions, the P-Pred is the previous event in the event record list associated with the given user thread ID.
Storing logs in the database provides more efficiency and flexibility for data pro-cessing. We store the records in a MySQL relational database and the Neo4j graph database; the later is good for dependency graph generation [1]. Currently, a database entry includes all the information stored in an event record, as well as the ID of its platform instance and user thread.
Archiving and protecting the data in the database is left for future work, as discussed in Chapter 9.
6.2
Event Records
This section describes our strategy for creating globally unique event IDs and what event information is excluded from an event record to reduce the logging overhead.
6.2.1
Event IDs
We use a uniform scheme for creating structured unique IDs for the events in our system. The structure of event IDs provides information about the context of each event within our system (e.g. the node or platform instance at which the event ran), which can be used in recovering from partial audit trail data loss (e.g. due to a node failure) and provides additional user-readibility of audit trail records.
Most recorded events are generated at the invocation of an Aeolus API method in a user thread of a platform instance running on one of our system nodes. Each platform
instance has a system-wide unique ID (no platform instance will ever run with the same ID in the system). Within each platform instance, each user computation runs inside a user thread whose ID is unique relative to the platform instance; however, user threads can be reused and an event from the same user thread may or may not be part of the same user computation. To identify events within a user thread, we keep a counter that is incremented after each recorded event. To avoid endlessly increasing this event counter, we reset it every time a user thread is reused and associate instead
anincarnation number with each user thread to reflect how many times it has been
reused.
Therefore, most events can be uniquely identified by the following 4-tuple:
(PI ID, user thread ID, user thread incarnation #, event counter).
However, there are several events in the system that are not recorded inside a user thread. These are special events recorded at the creation and deletion of a system node, the launching and shutdown of a platform instance, and the Aeolus FS manager events. Since each platform instance has a unique ID, we have two special event IDs for the PI launch and shutdown events, namely:
PI Launch: (PI ID, -, -, 0)
PI Shutdown: (PI ID, -, -, 1).
Furthermore, if we associate the node hostname with the unique ID of its start-up PI, we obtain the following unique IDs for a node creation and node deletion events:
Node Creation: (hostname, start-up PI ID, -, 0)
Node Deletion: (hostname, start-up PI ID, -, 1).
The file system manager events need to be unique across storage nodes and storage node relaunches. We differentiate events at different storage nodes by including the node hostname in the ID. We use an incarnation number for each relaunch of the file system manager (this is a counter persistently stored in a special file system configuration file on each node). Finally, the file system manager maintains an event
counter for its events and so the IDs of events logged by the file manager look as follows:
Aeolus FS manager events: (hostname, incarnation #, -, event counter)
6.2.2
Eliding
We avoid storing information in event records whenever possible in order to reduce event processing costs and the size of the event records. Since event records are sent to a central log collector, the size of the record affects the communication overhead.
Primarily, we do not include information that can be deduced from the audit trail history. For example, we can derive the labels of each user thread event since they are stored when the thread first starts running and any further label modifications are recorded in the audit trail. Therefore, it is not necessary to record the return value of an authority operation, such as a declassify or endorse request. On the other hand, we do log the return values of all non-deterministic operations, such as the IDs of newly created principals, tags, closures, and shared state objects, which are generated randomly. We also record whether an operation succeeded or failed, since unpredictable non-Aeolus failures are possible.
Due to the way that the event records are collected (as discussed in Section 6.1.1), we often do not need to store the P-Pred of these events. This information can be re-derived at the central log collector when the event records are processed after the shipment.
Finally, we do not record the timestamp in the event records. This reduces the size of the events and avoids the expensive read of the system clock for each event. Instead, the timestamp is computed when the PI’s logging client sends events to the central logging service, as described in the Section 6.1.1.
Chapter 7
Auditing Case Studies
In this chapter, we present audit trail records collected during the run of several sample applications. Our first example is a small application built solely for demon-strative purposes. It shows uses of the shared state, forks, and remote procedure calls. Our next example is a simple medical clinic application. It demonstrates uses of au-thority and persistent data storage via the file system. We present the collected audit trails as dependency graphs. These graphs were generated using the open source tool
graphviz [7] from the data stored in the log database.
7.1
Demo Application
Our first example is a small distributed client-server application built for demon-strative purposes only. The application runs on two nodes: the service runs on
26-2-69.dynamic.csail.mit.eduand the client runs oneigenharp.csail.mit.edu.
Table 7.1 shows the pseudocode of the program executed at the service and the client and Figure 7-1 shows the graph of event records stored during the run of this application. The service program registers the RpcT est service with Aeolus, writes to an I/O device, and waits for clients to connect. The client program runs in two threads. The starter thread first creates a shared queue, forks a second thread providing it the handle to the queue, and then waits to dequeue a value from the shared queue. The forked thread3 places an object in the queue and terminates.
Table 7.1: Demo Client-Service Program
Server−Side
1. RpcTestService service = new RpcTestService()
2. registerService(“RpcTest”, service)
3. writeToIODevice(screen, “Started service...”)
Client−Side
1. handle = createSharedQueue(sLabel=empty, iLabel=empty) 2. AeolusCallable c = new TestCallable(handle)
3. fork(c, p2)
4. value =waitAndDequeue(handle)
5. RpcTest serviceStub = (RpcTest) getService(26-2-69.dynamic.csail.mit.edu, ”edu.mit.csail.aeolus.testing.RpcTest”)
6. result = serviceStub.testMethod(value)
7. createEvent(“APP-EVENT-RECEIVE-RPC-REPLY”, ret-val = result)
T estCallable(handle) 1. value = new Integer(5)
2. enqueue(handle, value)
RpcT estService.testM ethod(value)
1. writeToIODevice(screen, value)
2. return 1
After it receives the value from the queue, the starter thread obtains a local stub for the service RpcT est on host 26-2-69.dynamic.csail.mit.edu and invokes the remote method testM ethod. The method runs at the server in a new user thread; it writes to an I/O device and returns to the client. Finally, since Aeolus does not log application values such as parameters and results of remote procedure calls, the client creates an application event to store the value returned by the remote method invocation.
The IDs of each event in the graph provide information about what platform in-stance and user thread a given event occurred in. For example, the
create-shared-queue event was created in platform instance with ID 7 and user thread with ID
13. Each node also includes the parameters and the return value stored with each event record. For example, the pi-launch event parameters specify the ID of the created platform instance and its root principal ID; the parameter to fork