© 2015 International Monetary Fund
GREECE
PRELIMINARY DRAFT DEBT SUSTAINABILITY ANALYSIS
The following document has been released: A Preliminary Draft Debt Sustainability Analysis (DSA) prepared by the staff of the IMF. Elements of this DSA are included in the “Preliminary Debt Sustainability Analysis for Greece” as referred to by the Greek government on its official website.
This preliminary draft DSA was prepared by Fund staff in the course of the policy discussions with the Greek authorities in recent weeks. It has not been agreed with the other parties in the policy discussions, and it has been circulated to, but neither discussed with nor approved by the IMF’s Executive Board. Since it was prepared, the Greek
authorities have closed the banking sector, imposed capital controls, and incurred arrears to the Fund. These developments are likely to have a significant adverse economic and financial impact that has not yet been reflected in this draft DSA.
Note that the financing for the coming months assumed European support before the second European program expired. Note also that the amount of IMF disbursements going forward will be decided by the IMF Executive Board. Greece is precluded from purchasing these resources unless it clears all arrears to the Fund in full.
Copies of this report are available to the public from International Monetary Fund Publication Services
PO Box 92780 Washington, D.C. 20090 Telephone: (202) 623-7430 Fax: (202) 623-7201 E-mail: publications@imf.org Web: http://www.imf.org
Price: $18.00 per printed copy
International Monetary Fund
Washington, D.C.
Greece: Debt Sustainability Analysis
Preliminary Draft
At the last review in May 2014, Greece’s public debt was assessed to be getting back on a path toward sustainability, though it remained highly vulnerable to shocks. By late summer 2014, with interest rates having declined further, it appeared that no further debt relief would have been needed under the November 2012 framework, if the program were to have been implemented as agreed. But significant changes in policies since then—not least, lower primary surpluses and a weak reform effort that will weigh on growth and privatization—are leading to substantial new financing needs. Coming on top of the very high existing debt, these new financing needs render the debt dynamics unsustainable. This conclusion holds whether one examines the stock of debt under the November 2012 framework or switches the focus to debt servicing or gross financing needs. To ensure that debt is sustainable with high probability, Greek policies will need to come back on track but also, at a minimum, the maturities of existing European loans will need to be extended significantly while new European financing to meet financing needs over the coming years will need to be provided on similar concessional terms. But if the package of reforms under consideration is weakened further—in particular, through a further lowering of primary surplus targets and even weaker structural reforms—haircuts on debt will become necessary.
Public Sector DSA
A. Background
1. At the time of the last review in May 2014 (the IMF’s Fifth Review under the extended arrangement), public debt dynamics were considered to be sustainable but highly vulnerable. Debt/GDP was projected to fall from 175 percent of GDP at end–2013 to about 128 percent of GDP in 2020 and further to 117 percent of GDP in 2022. These were above the thresholds agreed to in November 2012, of debt coming down to 124 percent of GDP in 2020 and to “substantially below” 110 percent of GDP in 2022. It assumed policy implementation as planned under the program— medium-term primary surpluses of 4+ percent of GDP and steadfast and timely implementation of structural and financial sector reforms to underpin the high growth rate and privatization projections. However, debt sustainability risks were very significant, vulnerable in particular to shocks to growth and the primary surplus, and debt could not be considered sustainable with high probability. 2. If the program had been implemented as assumed, no further debt relief would have been needed under the agreed November 2012 framework. Declining interest rates helped to improve the debt dynamics. Other factors such as the return of the HFSF bank recapitalization buffer to the EFSF as part of the extension of the EU program at end–February 2015 also improved the debt dynamics, while historical revisions of data marginally worsened the debt dynamics.
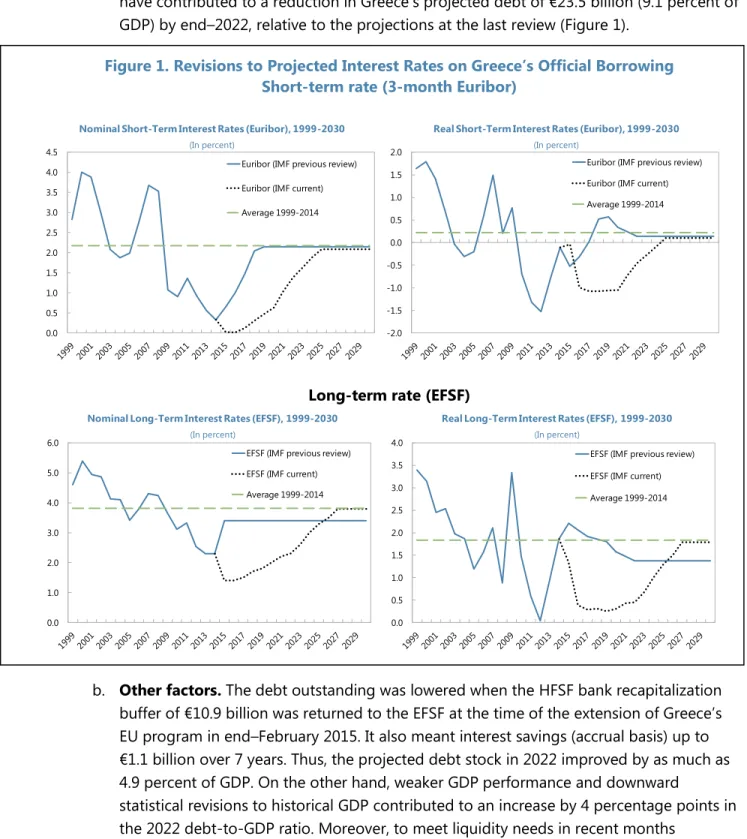
a. Lower interest rates. Relative to the last review, for the 2015–22 period, the projected 3-month Euribor declined on average 122 basis points and the projected EFSF interest rate declined on average 161 basis points. The medium-term implied interest rate (accrual basis) fell from 3.3 percent to 2.3 percent. As a result, Greece’s projected interest charges
during 2014-2022 dropped by nearly 30 percent on an accrual basis.1 Lower interest rates
have contributed to a reduction in Greece’s projected debt of €23.5 billion (9.1 percent of GDP) by end–2022, relative to the projections at the last review (Figure 1).
Figure 1. Revisions to Projected Interest Rates on Greece’s Official Borrowing Short-term rate (3-month Euribor)
Long-term rate (EFSF)
b. Other factors. The debt outstanding was lowered when the HFSF bank recapitalization buffer of €10.9 billion was returned to the EFSF at the time of the extension of Greece’s EU program in end–February 2015. It also meant interest savings (accrual basis) up to €1.1 billion over 7 years. Thus, the projected debt stock in 2022 improved by as much as 4.9 percent of GDP. On the other hand, weaker GDP performance and downward
statistical revisions to historical GDP contributed to an increase by 4 percentage points in the 2022 debt-to-GDP ratio. Moreover, to meet liquidity needs in recent months
1On a cash basis, the impact is smaller as we take into consideration the interest deferral on some EFSF loans. 0.0 0.5 1.0 1.5 2.0 2.5 3.0 3.5 4.0 4.5
Euribor (IMF previous review) Euribor (IMF current) Average 1999-2014
Nominal Short-Term Interest Rates (Euribor), 1999-2030
(In percent) -2.0 -1.5 -1.0 -0.5 0.0 0.5 1.0 1.5 2.0
Euribor (IMF previous review) Euribor (IMF current) Average 1999-2014
Real Short-Term Interest Rates (Euribor), 1999-2030
(In percent) 0.0 1.0 2.0 3.0 4.0 5.0 6.0
EFSF (IMF previous review) EFSF (IMF current) Average 1999-2014
Nominal Long-Term Interest Rates (EFSF), 1999-2030
(In percent) 0.0 0.5 1.0 1.5 2.0 2.5 3.0 3.5 4.0
EFSF (IMF previous review) EFSF (IMF current) Average 1999-2014
Real Long-Term Interest Rates (EFSF), 1999-2030
following the loss of market access that had begun to be gained in mid-2014,2 Greece
has been resorting to short-term borrowing from intra-government entities (two-week repo operations paying up to 3 percent of interest). The State has been able to tap about €11 billion from local governments, social security funds, and other entities since the last review. These operations have replaced external borrowing and, thus, reduced debt as defined in the Maastricht criteria. Rolling over indefinitely about 2/3 of this short-term borrowing (by making them part of the Treasury Single Account operations and repaying the rest) would lead to a fall in the 2022 debt-to-GDP ratio by approximately
5 percentage points of GDP.
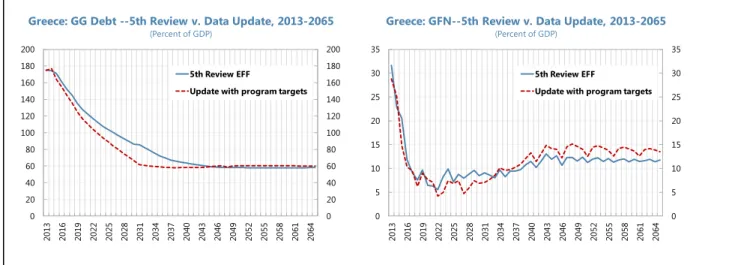
c. Implications. Taking into account all these background factors, if the key program targets had remained achievable, Greece’s medium-term debt profile would have improved by up to 13 percent of GDP. Greece’s debt-to-GDP ratio—projected at 127.7 percent in 2020 and 117.2 percent in 2022 during the last review—would have declined to 116.5 percent in 2020 and 104.4 percent in 2022 (see Figure 2, which shows projections of the stock of debt and of gross financing needs). No further relief would, therefore, have been needed under the November 2012 framework.
Figure 2. General Government Debt and Gross Financing Needs (GFN) from an Update of Macroeconomic Inputs to the DSA without Policy Changes, 2013–2065
B. Baseline scenario—Financing needs and debt projections
3. However, very significant changes in policies and in the outlook since early this year have resulted in a substantial increase in financing needs. Altogether, under the package proposed by the institutions to the Greek authorities, these needs are projected to reach about
2In 2014, Greece was able to issue a 5-year bullet bond with a coupon of 4.75 percent in April (€3 billion), and a 3-year bullet bond paying a coupon of 3.50 percent in July (€1.5 billion). Later that 3-year, the country swapped T-bills held by domestic banks for additional €1.6 billion in 3-year and 5-year bonds with these coupons.
0 20 40 60 80 100 120 140 160 180 200 0 20 40 60 80 100 120 140 160 180 200 2013 2016 2019 2022 2025 2028 2031 2034 2037 2040 2043 2046 2049 2052 2055 2058 2061 2064 5th Review EFF
Update with program targets
Greece: GG Debt --5th Review v. Data Update, 2013-2065 (Percent of GDP) 0 5 10 15 20 25 30 35 0 5 10 15 20 25 30 35 2013 2016 2019 2022 2025 2028 2031 2034 2037 2040 2043 2046 2049 2052 2055 2058 2061 2064 5th Review EFF
Update with program targets
Greece: GFN--5th Review v. Data Update, 2013-2065 (Percent of GDP)
€50 billion from October 2015 to end 2018, requiring new European money of at least €36 billion over the three-year period (Figure 3 and Table 1).
Lower fiscal targets. The 2014 primary fiscal balance fell short of the program target by 1.5 percent of GDP. Moreover, the proposed reduction in the primary surplus targets from 3 percent of GDP in 2015 and 4.5 percent of GDP in 2016 and beyond to 1 percent of GDP in 2015, 2 percent in 2016, 3 percent in 2017, and 3.5 percent in 2018 onwards would add cumulatively about 7 percentage points of GDP to financing needs during 2015–18. Over the next three years, needs will be €13 billion more from this factor relative to the last review.
Lower privatization proceeds. The projected privatization proceeds under the program were €23 billion over the 2014–22 period. Half of these proceeds were to come from privatizing state holdings of the banking sector. However, given the very high and rising levels of nonperforming loans in the banking system that in turn will require setting aside the bank recapitalization buffer as a potential backstop, it is highly unlikely that these proceeds will materialize. Of the remainder, the authorities have provided only vague commitments and have stated their opposition to further privatization of key assets. Against this
background and given the very poor performance to date of cumulative privatization
proceeds of only about €3 billion over the last 5 years, it is prudent and timely to take a more realistic view of how much privatization proceeds can materialize (Box 1 and text figure). With the politically less sensitive
privatizations completed, and clear signs of decline in proceeds, staff assumes annual proceeds of about €500 million over the next few years. This adds about €9 billion to financing needs during 2015–18 relative to the last review.To the extent that
privatization receipts exceed the levels assumed in the DSA, any excess should be used to pay down debt, which would bolster debt sustainability and investor confidence. 0 2 4 6 8 10 12 14 16 2012 2013 2014 2015 2016 2017 2018
Projected Annual Privatization Proceeds
(Billions of euros)
4th SBA Review (July 2011)
EFF Request (March 2012)
5th EFF Review (May 2014) Current Projection Actual Proceeds
Lower economic growth. There is a substantial weakening in the delivery of structural reforms and in the reform commitments. This has made untenable the assumption until the last review that Greece would go from having the lowest average TFP growth in the euro area since it joined the EU in 1981 to having among the highest TFP growth, and that it would go to the highest labor force participation rates and to German employment rates (Box 2). Thus, relative to the last review, staff has
downgraded the real long-term growth rate by 50 basis points to 1½ percent. (Growth in the 2-3 percent range is assumed over the next few years, as confidence returns and the output gap is gradually closed.) Clearly, growth risks remain to the downside, which is examined in the robustness scenarios below to ensure debt can be deemed
sustainable with high probability.
Clearing arrears. Against the backdrop of tight financing conditions, the government has been accumulating arrears, including unprocessed pension and tax refund claims. The estimated stock stands at over €7 billion and will need to be cleared. This would add about €5 billion to financing needs during 2015–18 relative to the last review. Cross-country experience suggests that unreported arrears may be significant under tight financing conditions because agencies may not report all invoices received in such a constrained budgetary situation. This would impart an upside risk to the estimate.
Rebuilding buffers and paying down short-term borrowing. Also as part of managing the tight liquidity conditions, state deposits in commercial banks and at the Bank of Greece declined to less than €1 billion at end–May 2015. This is against targeted levels under the program of €5 billion in 2015 and €8 billion over the medium term built into the last DSA. These targeted levels—at up to 8-month forward financing needs—are below what Ireland and Portugal had when they exited their programs, which allowed for covering 12-month forward financing needs, but nevertheless provide a cushion for meeting payments.
Moreover, staff assumes replenishment of Greece’s SDR holdings, amounting to €0.7 billion, which were consumed in May 2015 to repay debt due to the IMF. As regards short-term borrowing from general government entities to recycle cash surpluses, as noted above, about €6 billion of the €10.7 billion ought to be consolidated into the Treasury Single Account, based on IMF technical assistance and discussions with the authorities. The rest of the amounts would need to be repaid. These would add €6½ billion to financing needs during 2015–18 relative to the last review. Note that this assumes that the HFSF bank
recapitalization buffer remains set aside, pending a comprehensive assessment of bank balance sheets by the Single Supervisory Mechanism and the Fund.
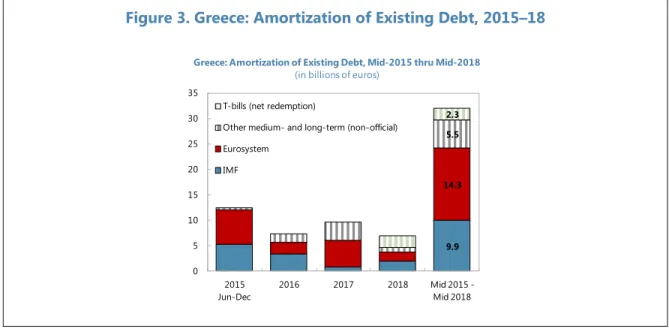
Interest rates. Borrowing costs related to the Greek loan facility (Euribor) and the EFSF are shown in Figure 1—current forecasts are taken till the end of the decade, after which it is assumed that the rates rise to historical averages. Borrowing from the market is assumed at an average maturity of 5 years and average nominal interest rate of 6¼ percent for the next several decades. This is calibrated as follows: the market cost of Greek debt prior to the crisis—when there was limited differentiation of risk and spreads were compressed—was about 5 percent, to which an additional modest spread is considered.3
Figure 3. Greece: Amortization of Existing Debt, 2015–18
3Alternatively, a similar result is derived by taking the euro area risk free rate of 3½-4 percent (WEO, average of France and Germany long-term nominal interest rates during 1999-2014), with the remaining difference being the Greece-specific risk premium, as estimated using the approach of Laubach (2009). This approach consists of an increase in the risk premium of 4 bps for every percentage point increase in debt-to-GDP ratio above 60 percent. For instance, with debt of 120 percent of GDP, the premium would be about 2½ percentage points, for a nominal rate of 6-6½ percent. For further details, see Laubach, Thomas, “New Evidence on the Interest Rate Effects of Budget Deficits and Debt.” Journal of the European Economic Association, June 2009.
9.9 14.3 5.5 2.3 0 5 10 15 20 25 30 35 2015 Jun-Dec 2016 2017 2018 Mid 2015 -Mid 2018 T-bills (net redemption)
Other medium- and long-term (non-official) Eurosystem
IMF
Greece: Amortization of Existing Debt, Mid-2015 thru Mid-2018
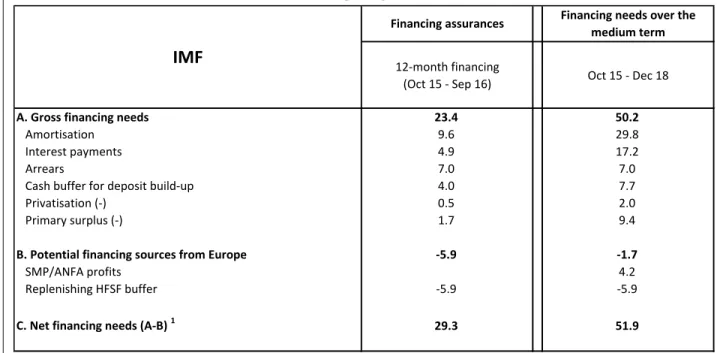
Table 1. Greece: State Government Financing Requirements and Sources, Oct 2015–Dec 2018
12-month financing
(Oct 15 - Sep 16) Oct 15 - Dec 18
A. Gross financing needs 23.4 50.2
Amortisation 9.6 29.8
Interest payments 4.9 17.2
Arrears 7.0 7.0
Cash buffer for deposit build-up 4.0 7.7
Privatisation (-) 0.5 2.0
Primary surplus (-) 1.7 9.4
B. Potential financing sources from Europe -5.9 -1.7
SMP/ANFA profits 4.2
Replenishing HFSF buffer -5.9 -5.9
C. Net financing needs (A-B) 1 29.3 51.9
Financing needs over the medium term
IMF
Financing assurances
1
The amount of IMF disbursements will be decided by the IMF Executive Board. There are €16 billion available in total under the current arrangement.
Box 1. Privatization Proceeds
Privatization projections have been scaled back to €500 million per year. This amount is based on a realistic assessment of privatization results to date and future prospects. Over the course of the SBA and the EFF arrangement, receipts have consistently fallen short of program projections by huge margins. The fourth SBA review in July 2011 projected €50 billion to materialize through end–2015. Actual receipts throughthe first quarter of 2015 were €3.2 billion, about 94 percent below the target. These were based on asset sales that were the easiest to sell (least socially and politically sensitive and with fewer legal obstacles), whereas none of the more sensitive infrastructure assets (airports, ports, rail, utilities) that dominate the remaining privatization portfolio were sold. Even the lowered projections of the 1st and 2nd EFF review in January 2013 have since been disappointed. In the 5th EFF
review, projected receipts from 2014 to 2022 were scaled back further to €23 billion, of which half was expected to come from sale of the state’s share in banks and about a quarter each from corporate assets and real estate. In the one year that has passed since the 5th review, €400 million
has materialized, three-quarters of which came from the auction of mobile phone frequencies.
The privatization projections in the new DSA assume no sales of bank shares or of major corporate assets, and modest real estate sales. Banks’ strained balance sheets and acute liquidity shortfalls point to a very high risk of capital injections and dilution of existing equity. Under these
circumstances, it is not reasonable to assume revenues from bank sales. Remaining corporate assets will be more difficult to sell than those that have been sold to date—all the more so in light of the government’s announced intention to add new conditions to future sales, including retention of a significant government stake and further safeguards for labor, environment, and local community benefits. Finally, the sale of real estate assets faces well-known obstacles including lack of a good database, disputed property rights, and problems securing needed permits for land development (such as environmental, forestry, coastline, and spatial planning), indicating that real estate privatization will be a protracted process with limited annual receipts.
Experience has shown that there is deep-seated political resistance to privatization in Greece. Against this background, it is critical for a realistic and robust DSA to assume reduced privatization revenues, which will derive from small annual concession payments, occasional extraordinary dividends, and gradual real estate sales – totaling about €500 million per year. Privatization should still be pursued, principally to improve governance and the investment climate rather than for fiscal reasons. To the extent that privatization receipts exceed the levels assumed in the DSA, any excess should be used to pay down debt, which would bolster debt sustainability and investor confidence.
Projected Actual Projected Actual
At the 1st and 2nd Review (Jan 2013) 2.5 0.9 6.4 1.6
Revised projection 1/ 0.5 0.2 2.0 …
1/ Actual for 2015 (1-year forward) refers to outcomes for January-May 2015. 1-year forward 3-year forward
Box 2. Growth Projections
Medium- to long-term growth projections in the program have been premised on full and decisive implementation of structural reforms that raises potential growth to 2 percent. Such growth rates stand in marked contrast to the historical record: real GDP growth since Greece joined the EU in 1981 has averaged 0.9 percent per year through multiple and full boom-bust cycles and TFP growth has averaged a mere 0.1 percent per year. To achieve TFP growth that is similar to what has been achieved in other euro area countries, implementation of structural reforms is therefore critical.
What would real GDP growth look like if TFP growth were to remain at the historical average rates since Greece joined the EU? Given the shrinking working-age population (as projected by Eurostat) and maintaining investment at its projected ratio of 19 percent of GDP from 2019 onwards (up from 11 percent currently), real GDP growth would be expected to average –0.6 percent per year in steady state. If labor force participation increased to the highest in the euro area, unemployment fell to German levels, and TFP growth reached the average in the euro area since 1980, real GDP growth would average 0.8 percent of GDP. Only if TFP growth were to reach Irish levels, that is, the best performer in the euro area, would real GDP growth average about 2 percent in steady state. With a weakening of the reform effort, it is implausible to argue for maintaining steady state growth of 2 percent. A slightly more modest, yet still ambitious, TFP growth assumption, with strong
assumptions of employment growth, would argue for steady state growth of 1½ percent per year.
4. Financing needs add up to over €50 billion over the three-year period from October 2015 to end–2018. It is assumed that it could take until September for the Greek authorities to complete the prior actions and for the necessary assurances on financing and debt sustainability to be in place. Financing needs until then could be met from already committed European funds, including the temporary use of about €6 billion of the HFSF buffer. The 12-month forward financing requirements from October 2015 onward amount to about €29 billion. This includes the need to reconstitute the bank recapitalization buffer, pending a comprehensive assessment of capital needs, in view of the high non-performing loans in the banking sector. The 3-year financing need from October 2015 to December 2018 amounts to about €52 billion. The
amount and tranching of Fund disbursements will be determined by the IMF’s Executive Board. However, it is assumed, in line with the practice in euro zone programs, that the European partners will cover at least 2/3 of the financing needs.
5. It is unlikely that Greece will be able to close its financing gaps from the markets on terms consistent with debt sustainability. The central issue is that public debt cannot migrate back onto the balance sheet of the private sector at rates consistent with debt sustainability, until debt-to-GDP is much lower with correspondingly lower risk premia (see Figure 4i). Therefore, it is imperative for debt sustainability that the euro area member states provide additional resources of at least €36 billion on highly concessional terms (AAA interest rates, long maturities, and grace period) to fully cover the financing needs through end–2018, in the context of a third EU program (see also paragraph 10).
6. Even with concessional financing through 2018, debt would remain very high for decades and highly vulnerable to shocks. Assuming official (concessional) financing through end– 2018, the debt-to-GDP ratio is projected at about 150 percent in 2020, and close to 140 percent in 2022 (see Figure 4ii). Using the thresholds agreed in November 2012, a haircut that yields a reduction in debt of over 30 percent of GDP would be required to meet the November 2012 debt targets. With debt remaining very high, any further deterioration in growth rates or in the medium-term primary surplus relative to the revised baseline scenario discussed here would result in significant increases in debt and gross financing needs (see robustness tests in the next section below). This points to the high vulnerability of the debt dynamics.
Figure 4. Baseline Scenario for the DSA, 2013–2065
i. Without Official (Concessional) Financing
0 20 40 60 80 100 120 140 160 180 200 0 20 40 60 80 100 120 140 160 180 200 2013 2016 2019 2022 2025 2028 2031 2034 2037 2040 2043 2046 2049 2052 2055 2058 2061 2064 5th Review EFF
Current baseline without concessional financing
Greece: GG Debt--Previous Review v. Current Baseline without Concessional Financing (Percent of GDP)
0 5 10 15 20 25 30 35 0 5 10 15 20 25 30 35 2013 2016 2019 2022 2025 2028 2031 2034 2037 2040 2043 2046 2049 2052 2055 2058 2061 2064 5th Review EFF
Current baseline without concessional financing
Greece: GFN--Previous Review v. Current Baseline without Concessional Financing (Percent of GDP)
ii. With Official (Concessional) Financing in 2015–2018
C. Switching from a Stock to a Gross Financing Needs Basis to Assess Debt Sustainability
7. Given the extraordinarily concessional terms that now apply to the bulk of Greece’s debt, the debt/GDP ratio is not a very meaningful proxy for the forward-looking debt burden.
For the same reason, it has become increasingly problematic to compare the debt stock to the applicable benchmarks in the MAC DSA framework, which are derived from a historical sample of crisis episodes in which debt stocks would have been mostly, if not entirely, on market terms. It therefore makes sense to focus directly on the future path of gross financing needs (GFN), and use the MAC DSA benchmarks of 15–20 percent of GDP for that ratio to define a sustainable path. Given Greece’s weak policy framework and easy loss of market access, the lower threshold is clearly the relevant one.
8. If the program were implemented as specified at the last review, debt servicing would have been within the recommended threshold of 15 percent of GDP on average during 2016– 45 (see Figure 2). This would require primary surpluses of 4+ percent of GDP per year and decisive and full implementation of structural reforms that delivers steady state growth of 2 percent per year (with the best productivity growth in the euro area) and privatization.
9. However, the debt dynamics would still be very vulnerable to changes in the
assumptions, and staff could not affirm that debt is sustainable with high probability as required under the exceptional access policy. In particular, if primary surpluses or growth were lowered as per the new policy package—primary surpluses of 3.5 percent of GDP, real GDP growth of 1½ percent in steady state, and more realistic privatization proceeds of about €½ billion annually—debt servicing would rise and debt/GDP would plateau at very high levels (see Figure 4i). For still lower primary surpluses or growth, debt servicing and debt/GDP rises unsustainably. The debt dynamics are unsustainable because as mentioned above, over time, costly market financing is replacing highly subsidized official sector financing, and the primary surpluses are insufficient to offset the
0 20 40 60 80 100 120 140 160 180 200 0 20 40 60 80 100 120 140 160 180 200 2013 2016 2019 2022 2025 2028 2031 2034 2037 2040 2043 2046 2049 2052 2055 2058 2061 2064 5th Review EFF
Current baseline with concessional financing
Greece: GG Debt--Previous Review v. Current Baseline with Concessional Financing (Percent of GDP)
0 5 10 15 20 25 30 35 0 5 10 15 20 25 30 35 2013 2016 2019 2022 2025 2028 2031 2034 2037 2040 2043 2046 2049 2052 2055 2058 2061 2064 5th Review EFF
Current baseline with concessional financing
Greece: GFN--Previous Review v. Current Baseline with Concessional Financing (Percent of GDP)
difference.4 In other words, it is simply not reasonable to expect the large official sector held debt to
migrate back onto the balance sheets of the private sector at rates consistent with debt sustainability.
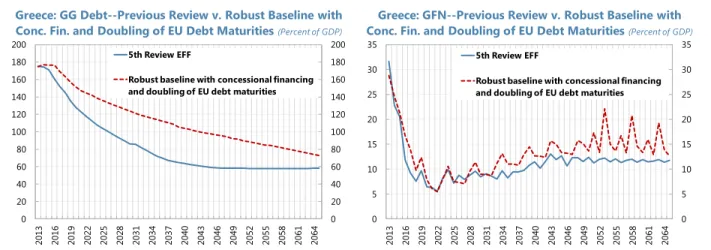
10. Given the fragile debt dynamics, further concessions are necessary to restore debt sustainability. As an illustration, one option for recovering sustainability would be to extend the grace period to 20 years and the amortization period to 40 years on existing EU loans and to provide new official sector loans to cover financing needs falling due on similar terms at least through 2018. The scenario below considers this doubling of the grace and maturity periods of EU loans (except those for bank recap funds, which already have very long grace periods). In this scenario (see charts below), while the November 2012 debt/GDP targets would not be achievable, the gross financing needs would average 10 percent of GDP during 2015-2045, the level targeted at the time of the last review.
iii. With Concessional Financing in 2015–2017 and Doubling of EU Maturities
Note: Doubling of EFSF maturities excludes bank recapitalization loans that already have 30-year grace period; in those cases, maturities are extended to 39 years of grace and 1 year bullet repayment. The debt/GDP and GFN/GDP ratios continue to decline even after 40 years because a primary surplus of 3.5 percent of GDP is assumed to be maintained forever.
D. Robustness Tests—Assessing Debt as Sustainable with High Probability
11. Under the Fund’s exceptional access criteria, debt sustainability needs to be assessed with high probability.
4 Put technically, the debt-stabilizing primary balance can be defined simply as (r – g) times the debt/GDP ratio, where r and g are the nominal interest rate and nominal GDP growth rates, respectively. For plausible (r – g) of about 2½ percent and for debt/GDP ratio of 100 percent, a primary surplus of 2½ percent of GDP would be required, simply to stabilize debt. For higher debt/GDP ratios, the primary surpluses need to be higher to stabilize debt and even higher to bring debt down to safer levels.
0 20 40 60 80 100 120 140 160 180 200 0 20 40 60 80 100 120 140 160 180 200 2013 2016 2019 2022 2025 2028 2031 2034 2037 2040 2043 2046 2049 2052 2055 2058 2061 2064 5th Review EFF
Current baseline with concessional financing and doubling of EU debt maturities
Greece: GG Debt--Previous Review v. Current Baseline with Conc. Fin., and Doubling of EU Debt Maturities (Percent of GDP)
0 5 10 15 20 25 30 35 0 5 10 15 20 25 30 35 2013 2016 2019 2022 2025 2028 2031 2034 2037 2040 2043 2046 2049 2052 2055 2058 2061 2064 5th Review EFF
Current baseline with concessional financing and doubling of EU debt maturities
Greece: GFN--Previous Review v. Current Baseline with Conc. Fin., and Doubling of EU Debt Maturities (Percent of GDP)
While the systemic exception was applied in the past, there is no rationale for continuing to invoke it when debt relief is needed now on official sector (rather than private) claims. A debt operation on official claims will not generate adverse market spillovers. On the contrary, by allowing debt to be assessed as sustainable with high probability, such action will have a catalyzing effect in restoring full market access.
If grace periods and maturities on existing European loans are doubled and if new financing is provided for the next few years on similar concessional terms, debt can be deemed to be sustainable with high probability. Underpinning this assessment is the following: (i) more plausible assumptions—given persistent underperformance—than in the past reviews for the primary surplus targets, growth rates, privatization proceeds, and interest rates, all of which reduce the downside risk embedded in previous analyses. This still leads to gross financing needs under the baseline not only below 15 percent of GDP but at the same levels as at the last review; and (ii) delivery of debt relief that to date have been promises but are assumed to materialize in this analysis.
12. The analysis is robust to somewhat lower growth and primary surplus targets.
What if growth were lower—closer to the historical pattern of about 1 percent per year? As noted in Box 2, real GDP growth of about 1 percent would still require strong assumptions about labor market dynamics and structural reforms that yield TFP growth at the average of euro area countries. In such a scenario, Greece’s debt would remain above 100 percent of GDP for the next three decades. Doubling the maturity and grace on existing EU loans and offering similar concessional terms on new borrowing, as specified above, would be vital to preserve gross financing needs within a safe range—the average GFN during 2015-2045 would be 11¼ percent of GDP (Figure 5).
Figure 5. Scenario with Lower Growth and Primary Surplus of 3½ percent of GDP, 2013–2065
What if primary surplus targets could not exceed 3 percent of GDP over the medium term? In that case, the provision of concessional financing for a prolonged period (10 years) would keep the GFN stable and below the 15-percent threshold over the next three decades. The decline in the debt-to-GDP ratio, nevertheless, would be very gradual (Figure 6).
Figure 6. Scenario with Lower Growth and Primary Surplus of 3 percent of GDP, 2013–2065
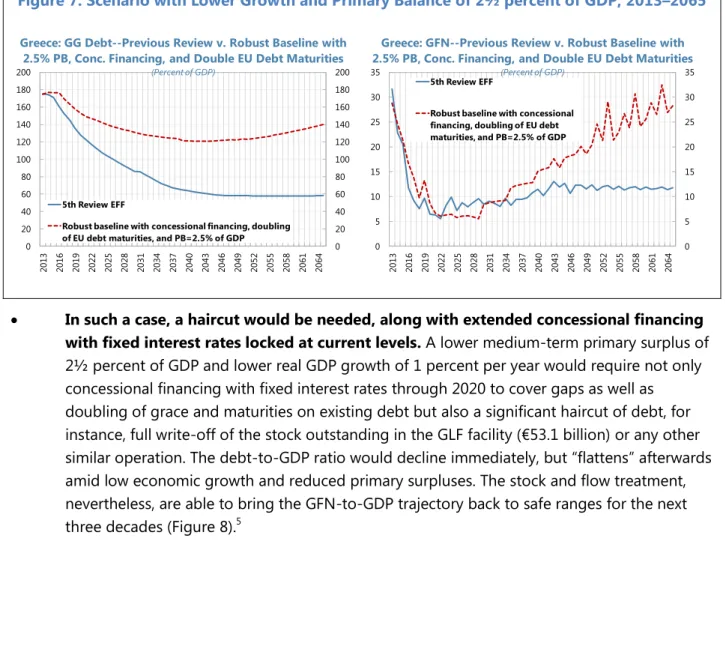
However, lowering the primary surplus target even further in this lower growth environment would imply unsustainable debt dynamics. If the medium-term primary surplus target were to be reduced to 2½ percent of GDP, say because this is all that the Greek authorities could credibly commit to, then the debt-to-GDP trajectory would be unsustainable even with the 10-year concessional financing assumed in the previous
scenario. Gross financing needs and debt-to-GDP would surge owing to the need to pay for the fiscal relaxation of 1 percent of GDP per year with new borrowing at market terms. Thus, any substantial deviation from the package of reforms under consideration—in the form of lower primary surpluses and weaker reforms—would require substantially more financing and debt relief (Figure 7).
0 20 40 60 80 100 120 140 160 180 200 0 20 40 60 80 100 120 140 160 180 200 2013 2016 2019 2022 2025 2028 2031 2034 2037 2040 2043 2046 2049 2052 2055 2058 2061 2064 5th Review EFF
Robust baseline with concessional financing and doubling of EU debt maturities
Greece: GG Debt--Previous Review v. Robust Baseline with Conc. Fin. and Doubling of EU Debt Maturities (Percent of GDP)
0 5 10 15 20 25 30 35 0 5 10 15 20 25 30 35 2013 2016 2019 2022 2025 2028 2031 2034 2037 2040 2043 2046 2049 2052 2055 2058 2061 2064 5th Review EFF
Robust baseline with concessional financing and doubling of EU debt maturities
Greece: GFN--Previous Review v. Robust Baseline with Conc. Fin. and Doubling of EU Debt Maturities (Percent of GDP)
0 20 40 60 80 100 120 140 160 180 200 0 20 40 60 80 100 120 140 160 180 200 2013 2016 2019 2022 2025 2028 2031 2034 2037 2040 2043 2046 2049 2052 2055 2058 2061 2064 5th Review EFF
Robust baseline with concessional financing, doubling of EU debt maturities, and PB=3% of GDP
Greece: GG Debt--Previous Review v. Robust Baseline with 3% PB, Conc. Financing and Double EU Debt Maturities
(Percent of GDP) 0 5 10 15 20 25 30 35 0 5 10 15 20 25 30 35 2013 2016 2019 2022 2025 2028 2031 2034 2037 2040 2043 2046 2049 2052 2055 2058 2061 2064 5th Review EFF
Robust baseline with concessional financing, doubling of EU debt maturities, and PB=3% of GDP
Greece: GFN--Previous Review v. Robust Baseline with 3% PB, Conc. Financing and Double EU Debt Maturities
Figure 7. Scenario with Lower Growth and Primary Balance of 2½ percent of GDP, 2013–2065
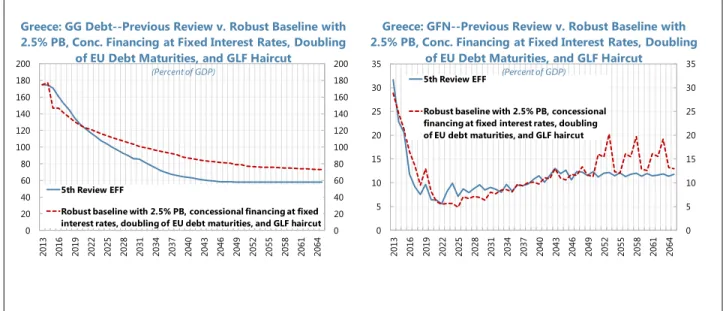
In such a case, a haircut would be needed, along with extended concessional financing with fixed interest rates locked at current levels. A lower medium-term primary surplus of 2½ percent of GDP and lower real GDP growth of 1 percent per year would require not only concessional financing with fixed interest rates through 2020 to cover gaps as well as doubling of grace and maturities on existing debt but also a significant haircut of debt, for instance, full write-off of the stock outstanding in the GLF facility (€53.1 billion) or any other similar operation. The debt-to-GDP ratio would decline immediately, but “flattens” afterwards amid low economic growth and reduced primary surpluses. The stock and flow treatment, nevertheless, are able to bring the GFN-to-GDP trajectory back to safe ranges for the next three decades (Figure 8).5
5Concessional loans with fixed interest rates locked at current low levels also offer a critical improvement to Greece’s gross financing needs, especially in the outer years of the projection period. In a low growth, low primary surplus scenario, even small interest rate shocks can tilt the GFN-to-GDP ratio upwards. These operations could be implemented for a limited period through the issuance of long-term bonds with fixed coupons by the ESM.
Alternatively, fixed-for-floating swap contracts could be offered by European creditors to Greece, also in the context of a new financial program.
0 20 40 60 80 100 120 140 160 180 200 0 20 40 60 80 100 120 140 160 180 200 2013 2016 2019 2022 2025 2028 2031 2034 2037 2040 2043 2046 2049 2052 2055 2058 2061 2064 5th Review EFF
Robust baseline with concessional financing, doubling of EU debt maturities, and PB=2.5% of GDP
Greece: GG Debt--Previous Review v. Robust Baseline with 2.5% PB, Conc. Financing, and Double EU Debt Maturities
(Percent of GDP) 0 5 10 15 20 25 30 35 0 5 10 15 20 25 30 35 2013 2016 2019 2022 2025 2028 2031 2034 2037 2040 2043 2046 2049 2052 2055 2058 2061 2064 5th Review EFF
Robust baseline with concessional financing, doubling of EU debt maturities, and PB=2.5% of GDP
Greece: GFN--Previous Review v. Robust Baseline with 2.5% PB, Conc. Financing, and Double EU Debt Maturities
Figure 8. Scenario with GLF Haircut and Concessional Financing, 2013–2065 0 20 40 60 80 100 120 140 160 180 200 0 20 40 60 80 100 120 140 160 180 200 2013 2016 2019 2022 2025 2028 2031 2034 2037 2040 2043 2046 2049 2052 2055 2058 2061 2064 5th Review EFF
Robust baseline with 2.5% PB, concessional financing at fixed interest rates, doubling of EU debt maturities, and GLF haircut
Greece: GG Debt--Previous Review v. Robust Baseline with 2.5% PB, Conc. Financing at Fixed Interest Rates, Doubling
of EU Debt Maturities, and GLF Haircut (Percent of GDP) 0 5 10 15 20 25 30 35 0 5 10 15 20 25 30 35 2013 2016 2019 2022 2025 2028 2031 2034 2037 2040 2043 2046 2049 2052 2055 2058 2061 2064 5th Review EFF
Robust baseline with 2.5% PB, concessional financing at fixed interest rates, doubling of EU debt maturities, and GLF haircut
Greece: GFN--Previous Review v. Robust Baseline with 2.5% PB, Conc. Financing at Fixed Interest Rates, Doubling
of EU Debt Maturities, and GLF Haircut (Percent of GDP)
17
17
17
Greece
Source: IMF staff.
(Indicators vis-à-vis risk assessment benchmarks)
Greece Public DSA Risk Assessment
5/ Includes liabilities to the Eurosystem related to TARGET. 4/ An average over the last 3 months, 17-Mar-15 through 15-Jun-15.
2/ The cell is highlighted in green if gross financing needs benchmark of 20% is not exceeded under the specific shock or baseline, yellow if exceeded under specific shock but not baseline, red if benchmark is exceeded under baseline, white if stress test is not relevant.
400 and 600 basis points for bond spreads; 17 and 25 percent of GDP for external financing requirement; 1 and 1.5 percent for change in the share of short-term debt; 30 and 45 percent for the public debt held by non-residents.
Market Perception Debt level 1/ Real GDP Growth Shock
Primary Balance Shock
3/ The cell is highlighted in green if country value is less than the lower risk-assessment benchmark, red if country value exceeds the upper risk-assessment benchmark, yellow if country value is between the lower and upper risk-assessment benchmarks. If data are unavailable or indicator is not relevant, cell is white.
Lower and upper risk-assessment benchmarks are:
Change in the Share of Short-Term Debt Foreign Currency Debt Public Debt Held by Non-Residents Primary Balance Shock Real Interest Rate Shock Exchange Rate Shock Contingent Liability Shock Exchange Rate Shock Contingent Liability shock
1/ The cell is highlighted in green if debt burden benchmark of 85% is not exceeded under the specific shock or baseline, yellow if exceeded under specific shock but not baseline, red if benchmark is exceeded under baseline, white if stress test is not relevant.
Real Interest Rate Shock External Financing Requirements Real GDP Growth Shock Heat Map
Upper early warning
Evolution of Predictive Densities of Gross Nominal Public Debt (Percent of GDP)
Debt profile 3/
Lower early warning
Debt Profile Vulnerabilities Gross financing needs 2/
1 1.5 1 2 1 2 Not applicable for Greece 400 600 1 2 17 25 1 2
Bond Spread over German Bonds External Financing Requirement 5/ Annual Change in Short-Term Public Debt Public Debt in Foreign Currency
(Basis points) 4/ (Percent of GDP) (Percent of total) (Percent of total)
0 50 100 150 200 250 0 50 100 150 200 250 2013 2015 2017 2019 2021 2023 10th-25th 25th-75th 75th-90th Percentiles: Baseline Symmetric Distribution 0 50 100 150 200 250 0 50 100 150 200 250 2013 2015 2017 2019 2021 2023
Restricted (Asymmetric) Distribution
no restriction on the growth rate shock no restriction on the interest rate shock 0 is the max positive pb shock (percent GDP) no restriction on the exchange rate shock
Restrictions on upside shocks:
30 45
1 2
Public Debt Held by Non-Residents
19
As of June 15, 2015
2004–2012 2/ 2013 2014 2015 2016 2017 2018 2019 2020 2021 2022 2023 2024 Sovereign Spreads
Nominal gross public debt 123.0 175.0 177.1 176.7 176.2 169.7 162.3 155.8 149.9 144.8 142.2 138.0 134.2 Spread (bp) 3/ 1149 Public gross financing needs 22.4 18.1 29.2 24.5 19.0 15.7 12.9 14.1 11.3 9.0 8.2 10.4 12.6 CDS (bp) 2758 Real GDP growth (percent) -1.2 -3.9 0.8 0.0 2.0 3.0 3.0 2.0 1.7 1.7 1.5 1.5 1.5 Ratings Foreign Local Inflation (GDP deflator, percent) 2.3 -2.3 -2.6 -1.2 0.7 1.4 1.5 1.8 1.9 2.0 2.0 2.0 2.0 Moody's Caa2 Caa2 Nominal GDP growth (percent) 1.1 -6.1 -1.8 -1.2 2.8 4.4 4.5 3.9 3.7 3.7 3.5 3.5 3.5 S&Ps CCC CCC Effective interest rate (percent) 4/ 4.6 2.4 2.2 2.1 2.2 2.2 2.2 2.4 2.5 2.8 3.0 3.2 3.5 Fitch CCC CCC
2004–2012 2013 2014 2015 2016 2017 2018 2019 2020 2021 2022 2023 2024 Cumulative Change in gross public sector debt 6.9 18.5 2.1 -0.4 -0.4 -6.5 -7.4 -6.6 -5.8 -5.1 -2.6 -4.2 -3.8 -42.9 Identified debt-creating flows 14.2 15.9 8.6 5.3 -3.4 -7.1 -7.5 -6.1 -5.6 -5.1 -4.4 -4.0 -3.6 -41.6 Primary deficit 3.6 -1.0 0.0 -1.0 -2.0 -3.0 -3.5 -3.5 -3.5 -3.5 -3.5 -3.5 -3.5 -30.5 Primary (noninterest) revenue and grants 40.3 45.7 45.4 45.5 44.0 43.6 42.8 42.4 41.7 41.7 41.7 41.7 41.7 426.6 Primary (noninterest) expenditure 43.8 44.7 45.4 44.5 42.0 40.6 39.3 38.9 38.2 38.2 38.2 38.2 38.2 396.1 Automatic debt dynamics 5/ 5.6 13.6 8.9 6.5 -1.1 -3.8 -3.8 -2.4 -1.9 -1.3 -0.7 -0.4 0.0 -8.9 Interest rate/growth differential 6/ 5.6 14.1 7.2 5.8 -1.0 -3.8 -3.7 -2.3 -1.8 -1.3 -0.7 -0.4 0.0 -9.3
Of which: real interest rate 2.9 7.6 8.6 5.8 2.4 1.3 1.2 0.9 0.8 1.2 1.4 1.6 2.0 18.7
Of which: real GDP growth 2.8 6.5 -1.4 0.0 -3.4 -5.1 -4.9 -3.1 -2.6 -2.5 -2.1 -2.1 -2.0 -27.9
Exchange rate depreciation 7/ 0.0 -0.5 1.7 … … … …
Other identified debt-creating flows 5.0 3.4 -0.3 -0.3 -0.3 -0.3 -0.3 -0.2 -0.2 -0.2 -0.2 -0.1 -0.1 -2.1 Net privatization proceeds -0.1 -0.6 -0.3 -0.3 -0.3 -0.3 -0.3 -0.2 -0.2 -0.2 -0.2 -0.1 -0.1 -2.1 Contingent liabilities 0.7 0.0 0.0 0.0 0.0 0.0 0.0 0.0 0.0 0.0 0.0 0.0 0.0 0.0 Other liabilities (bank recap. and PSI sweetner) 4.3 3.9 0.0 0.0 0.0 0.0 0.0 0.0 0.0 0.0 0.0 0.0 0.0 0.0 Residual, including asset changes 8/ -7.2 2.6 -6.5 -4.9 2.9 0.5 0.1 -0.5 -0.3 0.0 1.8 -0.2 -0.2 -1.0
-0.1 Actual
Contribution to Changes in Public Debt
Actual
Figure 1. Greece: Public Sector Debt Sustainability Analysis (DSA) - Baseline Scenario Debt, Economic and Market Indicators 1/
Projections
Debt-stabilizing primary balance 9/ Projections
(Percent of GDP, unless otherwise indicated)
-80 -60 -40 -20 0 20 40 60 80 -80 -60 -40 -20 0 20 40 60 80 2004 2005 2006 2007 2008 2009 2010 2011 2012 2013 2014 2015 2016 2017 2018 2019 2020 2021 2022 2023 2024
Debt-Creating Flows (Percent of GDP)
Primary deficit Real GDP growth Real interest rate Exchange rate depreciation
Other debt-creating flows Residual Proj.
-100 -80 -60 -40 -20 0 20 40 -60 -50 -40 -30 -20 -10 0 10 20 30 cumulative
Source: IMF staff projections.
1/ Public sector is defined as general government. 2/ Based on available data.
3/ Bond Spread over German Bonds.
4/ Defined as interest payments divided by debt stock at the end of previous year.
5/ Derived as [(r - p(1+g) - g + ae(1+r)]/(1+g+p+gp)) times previous period debt ratio, with r = interest rate; p = growth rate of GDP deflator; g = real GDP growth rate; a = share of foreign-currency denominated debt; and e = nominal exchange rate depreciation (measured by increase in local currency value of U.S. dollar).
6/ The real interest rate contribution is derived from the denominator in footnote 4 as r - π (1+g) and the real growth contribution as -g. 7/ The exchange rate contribution is derived from the numerator in footnote 2/ as ae(1+r).
8/ For projections, this line includes exchange rate changes during the projection period. Also includes ESM capital contribution, arrears clearance, SMP and ANFA income, and the effect of deferred interest. 9/ Assumes that key variables (real GDP growth, real interest rate, and other identified debt-creating flows) remain at the level of the last projection year.
Baseline scenario 2015 2016 2017 2018 2019 2020 2021 2022 Historical scenario 2015 2016 2017 2018 2019 2020 2021 2022 Real GDP growth 0.0 2.0 3.0 3.0 2.0 1.7 1.7 1.5 Real GDP growth 0.0 -1.9 -1.9 -1.9 -1.9 -1.9 -1.9 -1.9 Inflation -1.2 0.7 1.4 1.5 1.8 1.9 2.0 2.0 Inflation -1.2 0.7 1.4 1.5 1.8 1.9 2.0 2.0 Primary balance 1.0 2.0 3.0 3.5 3.5 3.5 3.5 3.5 Primary balance 1.0 -2.9 -2.9 -2.9 -2.9 -2.9 -2.9 -2.9 Effective interest rate 2.1 2.2 2.2 2.2 2.4 2.5 2.8 3.0 Effective interest rate 2.1 2.3 2.5 2.7 3.0 3.4 3.7 4.0
Constant primary balance scenario
Real GDP growth 0.0 2.0 3.0 3.0 2.0 1.7 1.7 1.5 Inflation -1.2 0.7 1.4 1.5 1.8 1.9 2.0 2.0 Primary balance 1.0 1.0 1.0 1.0 1.0 1.0 1.0 1.0 Effective interest rate 2.1 2.3 2.3 2.4 2.6 2.8 3.0 3.3 Source: IMF staff.
Greece Public DSA - Composition of Public Debt and Alternative Scenarios
Underlying Assumptions
(Percent)
Composition of Public Debt
Baseline Historical Constant Primary Balance
Alternative Scenarios 0 20 40 60 80 100 120 140 160 180 200 0 20 40 60 80 100 120 140 160 180 200 2004 2006 2008 2010 2012 2014 2016 2018 2020 2022 By Currency (Percent of GDP) Local currency-denominated Foreign currency-denominated Proj. 0 20 40 60 80 100 120 140 160 180 200 0 20 40 60 80 100 120 140 160 180 200 2004 2006 2008 2010 2012 2014 2016 2018 2020 2022 By Maturity (Percent of GDP)
Medium and long-term Short-term Proj. 0 5 10 15 20 25 30 35 40 45 50 0 10 20 30 40 50 60 2013 2015 2017 2019 2021 2023
Public Gross Financing Needs (Percent of GDP)
Proj. 0 50 100 150 200 250 300 0 50 100 150 200 250 300 2013 2015 2017 2019 2021 2023
Gross Nominal Public Debt (Percent of GDP)
Proj.
2015 2016 2017 2018 2019 2020 2021 2022 2015 2016 2017 2018 2019 2020 2021 2022
Primary Balance Shock Real GDP Growth Shock
Real GDP growth 0.0 2.0 3.0 3.0 2.0 1.7 1.7 1.5 Real GDP growth 0.0 -2.7 -1.7 3.0 2.0 1.7 1.7 1.5 Inflation -1.2 0.7 1.4 1.5 1.8 1.9 2.0 2.0 Inflation -1.2 -0.4 0.2 1.5 1.8 1.9 2.0 2.0 Primary balance 1.0 2.0 2.0 2.0 2.0 2.0 2.0 2.0 Primary balance 1.0 -0.6 -2.1 3.5 3.5 3.5 3.5 3.5 Effective interest rate 2.1 2.2 2.2 2.2 2.5 2.6 2.9 3.2 Effective interest rate 2.1 2.3 2.4 2.6 2.7 2.8 3.1 3.3
Real Interest Rate Shock Real Exchange Rate Shock
Real GDP growth 0.0 2.0 3.0 3.0 2.0 1.7 1.7 1.5 Real GDP growth 0.0 2.0 3.0 3.0 2.0 1.7 1.7 1.5 Inflation -1.2 0.7 1.4 1.5 1.8 1.9 2.0 2.0 Inflation -1.2 1.2 1.4 1.5 1.8 1.9 2.0 2.0 Primary balance 1.0 2.0 3.0 3.5 3.5 3.5 3.5 3.5 Primary balance 1.0 2.0 3.0 3.5 3.5 3.5 3.5 3.5 Effective interest rate 2.1 2.3 2.7 2.9 3.1 3.4 3.7 4.0 Effective interest rate 2.1 2.3 2.3 2.3 2.5 2.6 2.9 3.1
Combined Shock Contingent Liability Shock
Real GDP growth 0.0 -2.7 -1.7 3.0 2.0 1.7 1.7 1.5 Real GDP growth 0.0 -2.7 -1.7 3.0 2.0 1.7 1.7 1.5 Inflation -1.2 -0.4 0.2 1.5 1.8 1.9 2.0 2.0 Inflation -1.2 -0.4 0.2 1.5 1.8 1.9 2.0 2.0 Primary balance 1.0 -0.6 -2.1 -0.7 -1.1 -1.8 -1.8 -1.8 Primary balance 1.0 -12.4 3.0 3.5 3.5 3.5 3.5 3.5 Effective interest rate 2.1 2.3 2.8 3.0 3.4 3.9 4.3 4.7 Effective interest rate 2.1 2.4 3.0 2.6 2.8 3.0 3.2 3.4
Lower Growth Scenario
Real GDP growth 0.0 1.0 2.0 2.0 1.0 0.7 0.7 0.5 Inflation -1.2 0.7 1.4 1.5 1.8 1.9 2.0 2.0 Primary balance 1.0 2.0 3.0 3.5 3.5 3.5 3.5 3.5 Effective interest rate 2.1 2.3 2.3 2.4 2.6 2.7 3.0 3.2 Source: IMF staff.
Underlying Assumptions (Percent)
Greece Public DSA - Stress Tests Baseline Primary Balance Shock
Real GDP Growth Shock
Real Interest Rate Shock Macro-Fiscal Stress Tests
Real Exchange Rate Shock
Combined Macro-Fiscal Shock
Baseline Contingent Liability Shock
Lower growth scenario
Additional Stress Tests 120 140 160 180 200 220 120 140 160 180 200 220 2015 2016 2017 2018 2019 2020
Gross Nominal Public Debt
(Percent of GDP) 300 325 350 375 400 425 450 475 500 300 325 350 375 400 425 450 475 500 2015 2016 2017 2018 2019 2020
Gross Nominal Public Debt
(Percent of Revenue) 0 5 10 15 20 25 30 35 0 5 10 15 20 25 30 2015 2016 2017 2018 2019 2020
Public Gross Financing Needs
(Percent of GDP) 120 140 160 180 200 220 120 140 160 180 200 220 2015 2016 2017 2018 2019 2020
Gross Nominal Public Debt
(Percent of GDP) 300 350 400 450 500 550 300 350 400 450 500 550 2015 2016 2017 2018 2019 2020
Gross Nominal Public Debt
(Percent of Revenue) 0 5 10 15 20 25 30 35 40 45 0 5 10 15 20 25 30 35 40 2015 2016 2017 2018 2019 2020
Public Gross Financing Needs
2010 2011 2012 2013 2014 2015 2016 2017 2018 2019 2020
Baseline: external debt 132.0 149.0 130.7 136.9 140.4 138.5 133.4 126.1 118.5 111.3 107.5 -4.5
Change in external debt 44.8 17.0 -18.3 6.2 3.5 -1.9 -5.1 -7.2 -7.6 -7.2 -3.8
Identified external debt-creating flows (4+8+9) 12.1 19.6 11.0 4.8 0.8 -1.1 -5.4 -7.9 -8.1 -8.0 -7.8
Current account deficit, excluding interest payments 4.8 3.7 -1.6 -4.1 -4.2 -5.1 -4.9 -5.1 -5.0 -5.3 -5.3
Deficit in balance of goods and services 6.6 6.1 2.3 0.1 -1.0 -1.1 -2.5 -2.5 -2.6 -2.6 -2.5
Exports 20.1 23.5 25.5 27.7 30.6 30.1 29.9 30.1 30.4 30.9 30.4
Imports 26.8 29.6 27.8 27.8 29.5 29.1 27.4 27.6 27.9 28.3 27.8
Net non-debt creating capital inflows (negative) 0.4 0.2 -0.4 -1.5 0.5 0.0 1.0 0.4 -0.1 -0.8 -1.0
Automatic debt dynamics 1/ 6.9 15.7 13.0 10.4 4.5 3.9 -1.6 -3.2 -3.0 -1.9 -1.6
Contribution from nominal interest rate 2.6 3.9 2.6 2.0 1.9 2.3 2.2 2.4 2.5 2.5 2.4
Contribution from real GDP growth 5.0 12.7 10.5 5.4 -1.1 0.0 -2.7 -3.8 -3.6 -2.3 -1.9
Contribution from price and exchange rate changes 2/ -0.7 -1.0 -0.1 3.0 3.6 1.7 -1.0 -1.8 -1.8 -2.1 -2.1 Residual, incl. change in gross foreign assets (2-3) 3/ 32.7 -2.6 -29.3 1.4 2.6 -0.7 0.3 0.7 0.5 0.8 4.1 External debt-to-exports ratio (in percent) 655.3 633.7 512.3 494.6 459.3 460.0 445.8 419.3 389.7 360.3 354.2
Gross external financing need (billions of euros) 4/ 200.6 216.5 203.7 176.8 134.6 116.4 77.7 74.9 92.1 93.9 108.6
Percent of GDP 88.7 104.2 104.9 96.9 75.2 65.7 42.7 39.4 46.4 45.5 50.8
Scenario with key variables at their historical averages 5/ ... ... ... ... ... ... 149.6 160.0 170.7 182.3 198.5 8.5
Key macroeconomic assumptions underlying baseline
Real GDP growth (percent) -5.4 -8.9 -6.6 -3.9 0.8 0.0 2.0 3.0 3.0 2.0 1.7
GDP deflator (change in percent) 0.8 0.8 0.1 -2.3 -2.6 -1.2 0.7 1.4 1.5 1.8 1.9
Nominal external interest rate (percent) 6/ 2.8 2.7 1.6 1.4 1.4 1.6 1.6 1.9 2.0 2.2 2.2
Growth of exports (euro terms, percent) 7.7 7.2 1.4 1.9 8.4 -2.6 2.1 5.0 5.6 5.5 1.9
Growth of imports (euro terms, percent) 0.3 1.4 -12.1 -6.1 4.3 -2.8 -3.0 4.9 5.6 5.5 2.0
Current account balance -9.9 -9.9 -2.4 0.6 0.9 1.2 1.2 1.0 0.8 0.9 0.9
Net non-debt creating capital inflows -0.4 -0.2 0.4 1.5 -0.5 0.0 -1.0 -0.4 0.1 0.8 1.0
3/ For projection, line includes the impact of price and exchange rate changes.
4/ Defined as current account deficit, plus amortization on medium- and long-term debt, plus short-term debt at end of previous period.
5/ The key variables include real GDP growth; nominal interest rate; dollar deflator growth; and both non-interest current account and non-debt inflows in percent of GDP.
7/ Long-run, constant balance that stabilizes the debt ratio assuming that key variables (real GDP growth, nominal interest rate, dollar deflator growth, and non-debt inflows in percent of GDP) remain at their levels of the last projection year.
1/ Derived as [r - g - r(1+g) + ea(1+r)]/(1+g+r+gr) times previous period debt stock, with r = nominal effective interest rate on external debt; r = change in domestic GDP deflator in euro terms, g=real GDP growth , e = nominal appreciation (increase in dollar value of domestic currency), and a = share of domestic-currency denominated debt in total external debt.
2/ The contribution from price and exchange rate changes is defined as [-r(1+g) + ea(1+r)]/(1+g+r+gr) times previous period debt stock. r increases with an appreciating domestic currency (e > 0) and rising inflation (based on GDP deflator).
6/ The external DSA is based on net external debt while the interest rates in the public sector DSA are based on gross debt. Nevertheless, average interest rates generally follow a rising trend, and are more closely correlated at the end of the projection period, as more new debt is contracted at higher interest rates.
Greece: Net External Debt Sustainability Framework, 2010–20
(Percent of GDP, unless otherwise indicated)
Debt-stabilizing non-interest current account
7/
Actual Projections
Greece: External Debt Sustainability: Bound Tests, 2010–20 1/
(Net external debt in percent of GDP)
Sources: Greek authorites; and IMF staff estimates.
1/ Shaded areas represent actual/preliminary data. Figures in the boxes represent average projections for the respective variables in the baseline and scenario being presented. Ten-year (pre-crisis) historical average for the variable is also shown.
2/ Current account balance lower by 1.5 percent of GDP due to delayed program implementation and terms -of-trade shock. 3/ Impact of100bps shock to Bund rates on Greece's official interest rates and income balance.
4/ Decline in FDI due to reduced privatization receipts. Baseline 108 0 20 40 60 80 100 120 40 60 80 100 120 140 160 180 2010 2012 2014 2016 2018 2020 Baseline Scenario Gross financing needs (right scale)
Historical 199 Baseline 108 50 75 100 125 150 175 200 225 250 50 75 100 125 150 175 200 225 250 2010 2012 2014 2016 2018 2020 Baseline and Historical Scenarios Non-interest C/A shock 120 Baseline 108 80 100 120 140 160 180 80 100 120 140 160 180 2010 2012 2014 2016 2018 2020 Non-interest Current Account Shock 2/ (Percent of GDP) Bund rate shock 113 Baseline 108 80 100 120 140 160 180 80 100 120 140 160 180 2010 2012 2014 2016 2018 2020
Interest Rate Shock 3/ (Percent) FDI shock 112 Baseline 108 80 100 120 140 160 180 80 100 120 140 160 180 2010 2012 2014 2016 2018 2020 FDI Shock 4/ Combined shock 125 Baseline 108 80 100 120 140 160 180 80 100 120 140 160 180 2010 2012 2014 2016 2018 2020