User Guide - English
FUJITSU Software ServerView Suite
ServerView Inventory Manager
ServerView Operations Manager V6.21this manual. Your feedback helps us optimize our documentation to suit your individual needs.
Feel free to send us your comments by e-mail to
Certified documentation according to DIN EN
ISO 9001:2008
To ensure a consistently high quality standard and user-friendliness, this documentation was created to meet the regulations of a quality man-agement system which complies with the requirements of the standard DIN EN ISO 9001:2008.
cognitas. Gesellschaft für Technik-Dokumentation mbH
www.cognitas.de
Copyright and trademarks
Copyright © 2009 - 2013 Fujitsu Technology Solutions. All rights reserved.
Delivery subject to availability; right of technical modifications reserved. All hardware and software names used are trademarks of their respective manufacturers.
Contents
Contents 3
1 Introduction 5
1.1 Concepts 8
1.1.1 Data collections 8
1.1.2 Report definitions 10
1.1.3 Reports 11
1.1.4 Tasks 12
1.2 Requirements 13
1.3 Changes since the previous manual 13 1.4 ServerView Suite link collection 13 1.5 Documentation for the ServerView Suite 15
1.6 Typographic conventions 15
2 First-time startup 17
3 Managing data collections and reports 19
3.1 Starting the Inventory Manager 19 3.2 Closing the Inventory Manager 19 3.3 Creating/Editing a data collection 20 3.4 Creating/Editing a report definition 22 3.5 Creating/Editing a report for data export 24 3.6 Creating/Editing a report for presentation 26
4 User interface 29
4.1 Wizards 29
4.2 Inventory Manager main window 31
4.3 Manage Data Collections tab 32
4.3.1 Data collections tree 32
4.3.2 Servers in collections tree 33
4.3.3 Data collections view 34
4.3.4 Create/Edit Data Collection Wizard 37 4.3.4.1 Define Collection Properties step (Create Data
Col-lection Wizard) 37
4.3.4.2 Schedule Task step (Create Data Collection Wizard) 39 4.3.4.3 Assign Servers step (Create Data Collection Wizard) 41 4.3.4.4 Setting step (Create Data Collection Wizard) 42 4.3.4.5 Summary step (Create Data Collection Wizard) 43
4.3.5 Servers in data collections view 44 4.3.6 Settings for data collections 47
4.4 Manage Reports tab 50
4.4.1 Reports tree 50
4.4.2 Report Definitions tree 51
4.4.3 Servers in reports tree 52
4.4.4 Reports view 53
4.4.5 Create/Edit Report Wizard 57 4.4.5.1 Choose Report Definition step (Create Report Wizard)
58 4.4.5.2 Graphical Format step (Create Report Wizard) 62 4.4.5.3 Output Formats step (Create Report Wizard) 68 4.4.5.4 Format Parameters step (Create Report Wizard) 70 4.4.5.5 Schedule Report step (Create Report Wizard) 72 4.4.5.6 Assign Servers step (Create Report Wizard) 74 4.4.5.7 Report Settings step (Create Report Wizard) 75 4.4.5.8 Results step (Create Report Wizard) 76 4.4.5.9 Summary step (Create Report Wizard) 83
4.4.6 Report definitions view 84
4.4.7 Create/Edit Report Definition Wizard 86 4.4.7.1 View step (Create Report Definition Wizard) 87 4.4.7.2 Filter step (Create Report Definition Wizard) 89 4.4.7.3 Summary step (Create Report Definition Wizard) 91
4.4.8 Servers in reports view 92
4.4.9 Settings for reports 95
4.5 Manage Diagnostics 102
4.5.1 Servers tree 103
4.5.2 Tasks tree 104
4.5.3 Manage Diagnostics - Servers 105 4.5.4 Manage Diagnostics - Tasks 108
4.5.5 Deleting log files 111
5 Appendix 113
5.1 Predefined standard data type sets for data collections 113 5.2 Predefined standard report definitions 114 5.3 Views for customized report definitions 117
1
Introduction
The ServerView Inventory Manager (simply called Inventory Manager below) is a component of the Asset Management of the PRIMERGY ServerView Suite and is available via ServerView Operations Manager.
The Inventory Manager offers handy and flexible access to managing cus-tomized collections of several types of data and their storage in the Server-View database. You can create reports based on this data and display them on screen or export them regularly in several output formats.
The following types of system data can be collected and used in reports:
l Inventory data
Overview of all hardware, firmware and software components of a sys-tem. This includes some general server information, such as the host name, IP address, UUID, serial number etc. as well as version infor-mation which can be used in Update Management.
l System history values which are collected in the database for a period of
time:
o Power consumption data
o Overall status information of a system o Ambient temperature data
o Performance data (CPU, memory, network, storage)
You can only create reports if data has previously been collected and stored in the database. The Web-based interface of the Inventory Manager helps you specify data collections according to your needs. If you want to use the Update Management, it is essential that inventory data is collected on a reg-ular basis to ensure that up to date version information is available. If you want to analyze the state of your systems over a period of time, system his-tory data should be collected at short intervals.
As the collection of data takes some time and uses up system resources, such tasks need to be scheduled carefully. To find an appropriate scheduling time, you need to consider the number of managed nodes and other tasks which are also running on the Central Management Station (CMS) at the time of collection.
If data has been collected and stored in the database, reports can be created on the basis of this data. The Web-based interface of the Inventory Manager helps you define reports according to your needs. Several types of data can be combined in one report. Reports can be created immediately and shown on screen, or they can be created on a regular basis and stored in a file or in a different database.
Reports can be generated in CSV (Comma Separated Value) format. For stor-age in the database, an SQL script can be generated, which must be execut-ed later on, or the data can be storexecut-ed directly via ODBC.
The storage of report data at intervals might help you find out about changes to your system components (e.g. versions) or give you an overview of the state of your systems (overall, temperature, power, performance) over a peri-od of time.
As the creation of reports is based on already available data in the database, the scheduling of such tasks can be done more easily. The presentation of report data is executed immediately and summarizes values of interest to you in compact form. For example, system status values over a period of time can be shown in a graph to let you see the maximum values at a glance. The following figure shows the Inventory Manager’s components:
Figure 1: Inventory Manager and its components Inventory Manager
Inventory Manager is the Web-based user interface which supports the specification of data collections and reports and the export or pre-sentation of report data.
ServerViewDB (SV DB)
The key component is the database, where all data collections and report specifications are stored, along with scheduling information for data collection and export of report data, as well as data gathered during data collection.
Data Collection
Data Collection gathers data from managed nodes, scheduled or once immediately, and stores it in the database.
Data Export
Data Export uses the collected data to create reports and store them as exported data in the file system or database.
Data Presentation
Data Presentation uses the collected data to create reports and presents them on screen.
1.1
Concepts
1.1.1
Data collections
Data Collections gather data from managed nodes and store it in the data-base. This data forms the basis for the creation of reports.
Several types of system data are supported as the basis for a collection:
Data type set Protocol Contents
Inventory data SNMP General server information such as host name, net address, UUID, serial number. hardware, firmware, software system components
Power Consumption data
SNMP Power utilization; collected over a period of time
Status information SNMP Overall system status; collected over a period of time
Temperature data SNMP Ambient system temperature; collected over a period of time
Performance data VME CPU, memory, network and storage; col-lected over a period of time
Collecting Performance data is only possible ifPerformance Mon-itoringis enabled in the Base Configuration Wizard.
Configuration Wizard-Threshold Management-Usage Per-formance Monitoring=Yes
The type of protocol used for data collection depends on the protocol which can be used to access a managed node and which is appropriate for the type of collection. In most cases SNMP is used to connect to ServerView agents on a managed node. For performance data, the data which is collected by the VME Performance Service is used directly.
The data types can be used to define data collection tasks. Each data type can be used separately for a collection or some of them can be combined in one Data Collection definition.
The Inventory Manager distinguishes two types of data types:
l Standard data typesrefer to the data types directly
l Customized data typesare user defined and can refer to a set of data
types
Both standard and customized data type definitions can be used to run a Data Collection immediately or within a scheduled task.
Before you create reports, you should define a data collection task to collect the data you require later on. If you want to use Update Management, it is essential that inventory data is collected regularly so that data in the data-base is always up-to-date.
If you do not want to create reports or use Update Management, it is not nec-essary to collect any data at all. Moreover, if no data is collected, the data-base will not become overloaded with data.
1.1.2
Report definitions
Report definitions refer to data which is stored in the database and are used to define a report. A report definition can be built from a selection of supported database views. A report definition is defined by
l the name of such a view which defines the data contents.
l a selection of attributes which restricts or reorganizes the data contents. l a filter definition which allows you to show only subsets of data.
Each report definition refers to precisely one view with one selection of attrib-utes and one filter.
The Inventory Manager distinguishes two types of report definitions:
l Standard report definitionsrefer to predefined report definitions which
include the most significant data with the most important attributes and no filter.
l Customized report definitionsare user defined and can refer to a user
specific selection of data, attributes and filter.
Both standard and customized report definitions can be used to run a report. Before you create a report, you should check if there are report definitions available to define a report task which will later produce the data you require. Report definitions can also be defined directly when you specify a report.
1.1.3
Reports
Reports are built from data which is stored in the database by previously run-ning data collections. Reports form the basis for the presentation of this data on screen or its storage during an export task.
The basis for a report is report definitions which refer to data in the database directly and might limit or reorganize the contents of this data.
Each report definition can be used separately to define a report, or several can be combined. A report can then be used to export the report data to a file or database, either immediately, or on a scheduled basis. Or the report can be used to show the data immediately on screen.
For export purposes, reports can be generated in CSV (Comma Separated Value), XML, PDF or HTML format. For storage in the database, an SQL script can be generated, which must be executed later on, or the data can be stored directly via ODBC.
For use in presentations, report data can be shown as a table, line diagram, or pie diagram.
In table presentation, all attributes defined in the report definition are listed. 1.1 Concepts
1.1.4
Tasks
Tasks for collecting data and exporting reports follow the common Server-View task rules. The following are specified in a task:
l What is to be done, in this case collecting data or exporting a report l When it is to be done - scheduled or once immediately
l Which servers are to be included – list of assigned servers
When a task is activated, a corresponding task is created on the Central Man-agement Station, which runs in the background when the scheduled time is reached. The status and result of this task are stored in the database; output data from data collection is also stored in the database, export data in a file or the database.
The status and result of these tasks can be seen in the Inventory Manager on theManage Diagnosticstab. Here you will find an overview of the latest task runs and more detailed information in the log data for the task.
1.2
Requirements
The most up-to-date information on the hardware and software requirements for ServerView can be found in the ServerView Operations Manager Instal-lation Guides (Windows/Linux), in the "Release Notes" information file, which can be opened e.g. from the ServerView program group, and in the product specifications for ServerView.
1.3
Changes since the previous manual
This edition of the manual applies to the Inventory Manager as of ServerView V6.21 and replaces the following online manual: “ServerView Inventory Man-ager - ServerView Operations ManMan-ager V6.20”, June 2013 edition.
This manual contains the following changes:
l New tabPresentation Font Settingsin theManage Reportstab.
Presentation Settingstab renamed toGraphical Settings.
l Minor changes in theResults step.
1.4
ServerView Suite link collection
Via the link collection, Fujitsu Technology Solutions provides you with numer-ous downloads and further information on the ServerView Suite and PRIM-ERGY servers.
For ServerView Suite, links are offered on the following topics:
l Forum l Service Desk l Manuals
l Product information l Security information l Software downloads l Training
The downloads include the following:
o Current software statuses for the ServerView Suite as well as
addi-tional Readme files.
o Information files and update sets for system software components
(BIOS, firmware, drivers, ServerView agents and ServerView update agents) for updating the PRIMERGY servers via Server-View Update Manager or for locally updating individual servers via ServerView Update Manager Express.
o The current versions of all documentation on the ServerView
Suite.
You can retrieve the downloads free of charge from the Fujitsu Tech-nology Solutions Web server.
For PRIMERGY servers, links are offered on the following topics:
l Service Desk l Manuals
l Product information l Spare parts catalogue
Access to the link collection
You can reach the link collection of the ServerView Suite in various ways: 1. Via ServerView Operations Manager.
l SelectHelp–Linkson the start page or on the menu bar.
This opens the start page of the ServerView link collection.
2. Via the start page of the online documentation for the ServerView Suite on the Fujitsu Technology Solutions manual server.
You access the start page of the online documentation via the fol-lowing link:
l In the selection list on the left, selectIndustry standard servers. l Click the menu itemPRIMERGY ServerView Links.
This opens the start page of the ServerView link collection. 3. Via the ServerView Suite DVD.
l In the start window of the ServerView Suite DVD, select the option
Select ServerView Software Products.
l ClickStart. This takes you to the page with the software products of
the ServerView Suite.
l On the menu bar selectLinks.
This opens the start page of the ServerView link collection.
1.5
Documentation for the ServerView Suite
The documentation can be downloaded free of charge from the Internet. You will find the online documentation athttp://manuals.ts.fujitsu.comunder the linkIndustry standard servers.
For an overview of the documentation to be found underServerView Suite
as well as the filing structure, see the ServerView Suite sitemap ( Server-View Suite–Site Overview).
1.6
Typographic conventions
The following typographic conventions are used:
Convention Explanation
Indicates various types of risk, namely health risks, risk of data loss and risk of damage to devices.
Indicates additional relevant information and tips.
bold Indicates references to names of interface elements.
Convention Explanation
monospace Indicates system output and system elements, e.g., file names
and paths.
monospace semibold
Indicates statements that are to be entered using the keyboard.
blue con-tinuous text
Indicates a link to a related topic.
pink con-tinuous text
Indicates a link to a location you have already visited. <abc> Indicates variables which must be replaced with real values. [abc] Indicates options that can be specified (syntax).
[key] Indicates a key on your keyboard. If you need to enter text in uppercase, the Shift key is specified, for example, [SHIFT] + [A] for A. If you need to press two keys at the same time, this is indicated by a plus sign between the two key symbols.
Screenshots
Some of the screenshots are system-dependent, so some of the details shown may differ from your system. There may also be system-specific dif-ferences in menu options and commands.
2
First-time startup
The ServerView Base Configuration Wizard includes a step for configuring the Inventory Manager. Here the collection of inventory data can be sched-uled to ensure that inventory data in particular is available for use in Update Management, which you might have selected in an earlier step. Data col-lections for all other types of data as well as for inventory data can be spec-ified in the Web-based user interface of the Inventory Manager.
3
Managing data collections and
reports
3.1
Starting the Inventory Manager
You start the Inventory Manager either via the ServerView Operations Man-ager start screen or via theServerListmain window.
1. Start ServerView Operations Manager.
How to do this is described in the documentation for ServerView Oper-ations Manager.
2. Click the menu itemAsset Management–Inventory Managereither in the ServerView Operations Manager start screen or in theServerList
main window.
This opens the Inventory Manager main window.
3.2
Closing the Inventory Manager
You close the Inventory Manager by closing the main window.
l To close the Inventory Manager main window, click the Close icon in the
3.3
Creating/Editing a data collection
Data collections gather data from managed nodes and store it in the data-base. This data forms the basis for the creation of reports.
Before you create reports, you should define a data collection task to collect the data you require later on. If you want to use Update Management, it is essential that inventory data is collected regularly so that data in the data-base is always up-to-date.
1. Select theManage Data Collectionstab.
2. In the navigation bar on the left, selectCollections. 3. On theManage Data Collectionstab, clickCreate....
For editing an existing data collection, select this data collection and clickEdit....
TheNew Data Collection Creation Wizardopens with theDefine Col-lection Propertiesstep.
4. Enter a uniqueNamefor the data collection. (create only) 5. Enter a helpfulDescriptionof the data collection.
6. UnderData Set to be retrieved, select the data type sets you want to use.
Multiple selection is possible.
For more information about data type sets, see"Predefined standard data type sets for data collections" on page 113.
7. ClickNext.
TheSchedule Taskstep opens.
In this step you specify when and how often the task will be executed, and whether the related log files are to be saved.
8. ClickNext.
TheAssign Serversstep opens.
In this step, select one or more servers you want to assign to the task. 9. ClickNext.
TheSettingsstep opens.
If you want the person defined in the collection settings to be notified every time the task is executed, enable theSend a notification email ...option.
If you want the inventory data to be updated every time the task is executed, enable theRecollect Inventory Data ...option. 10. ClickNext.
TheSummarystep opens.
This step shows a summary of the selected values and adjustments. 11. ClickFinishto save the data collection and activate the task.
3.4
Creating/Editing a report definition
Report definitions refer to data which is stored in the database and are used to define a report.
Each report definition refers to precisely one view with one selection of attrib-utes and one filter.
1. Select theManage Reportstab.
2. In the navigation bar on the left, selectReport Definitions
3. To create a new report definition, clickCreate....
To edit an existing report definition, select this report definition and click
Edit....
TheCreate report definitiondialog is shown.
4. Enter a uniqueNameof the report definition. (create only) 5. Enter a helpfulDescriptionof the report definition.
6. On the left, select aViewto define the content for this report definition. EachViewdefines a specific selection of data relating to the managed servers.
For more information about views, see"Views for customized report def-initions" on page 117.
7. On the right, select theView Attributesyou need to restrict the data con-tent of theView.
If you select theShow Detailed Descriptionoption, additional infor-mation about the views / attributes is displayed.
If you want to use the report definition in a report which includes the data for several servers, you should have a server- identifying attrib-ute in your selection, e.g.ServerName,ServerIdorScId.
8. ClickNext.
For further restrictions, a filter function is available.
With the help of the selection listsAttribute,OperationandValueand the logical operatorC.O., you define filter conditions for further reducing the amount of data in the selectedView.
<attribute> - <operation> - <value> - [AND | OR] 9. Select theAttributeyou want to use as a filter.
This selection list contains all the attributes contained in the selected
View.
10. Select theOperationyou want to use as a filter.
Depending on which type of attribute you have selected as a filter, this selection list will contain either character or number operators.
11. Select one of the displayedValuesor enter one of your own as a filter. The Inventory Manager automatically identifies values which match the ones set underAttributeand displays them in theValueselection list. 12. Select the logical operatorC.O.
You use the logical operator to specify whether all set conditions have to be fulfilled (AND) or just one (OR).
When you have selected the logical operator, a new line for defining addi-tional filter conditions is displayed.
To remove a condition from the table, select the corresponding line and clickDelete.
To change the order of the conditions, select the corresponding line and clickMove UporMove Down.
If you want to define further conditions, repeat step 8 to 12. 13. ClickNext.
TheSummarystep opens.
A summary of the selected values and adjustments is shown. 14. ClickFinishto save the report definition.
3.5
Creating/Editing a report for data export
Reports are built from data which is stored in the database by previously run-ning data collections. Reports form the basis for the presentation of this data on screen or its storage during an export task.
Before you create a report, you should check if there are report def-initions available to define a report task which will later produce the data you require.
1. Select theManage Reportstab.
2. In the navigation bar on the left, selectReports
3. To create a new report, clickCreate....
To edit an existing report, select this report and clickEdit....
TheCreate Report Wizardopens with theChoose Report Definition
step.
In this step you select the content (report definition) of the report. 4. Enter a uniqueNamefor the report. (create only)
5. Enter a helpfulDescriptionof the report.
6. Make sure theRun as Presentationoption is disabled, because you want the report to be exported in an output format.
Otherwise, the report will be displayed on screen.
7. Select all the report definitions you need from theReport Contentslist on the left.
If necessary, you can define a new report definition by clickingCreate.... 8. ClickNext.
TheOutput Formatsstep opens.
9. ClickNext.
TheFormat Parametersstep opens.
In this step, specify the information required for the data export. 10. ClickNext.
TheSchedule Reportstep opens.
In this step you specify when and how often the task will be executed, and whether the related log files are to be saved.
11. ClickNext.
TheAssign Serversstep opens.
In this step, select one or more servers you want to assign to the task. 12. ClickNext.
TheSettingsstep opens.
Enable theSend a notification email ...option if you want the person defined in the report settings to be notified every time the task is execut-ed.
13. ClickNext.
TheSummarystep opens.
This step shows a summary of the selected values and adjustments. You will also see a warning if data from prior data collection is missing in the database for your selected report and servers.
14. ClickFinishto save the report and activate the task. The export files are stored as follows:
For Windows:
C:\Program Files\Fujitsu\ServerView Suite\svom\data\ ServerView\Reports
For Linux:
/opt/fujitsu/ServerViewSuite/svom/data/ServerView/Reports For x64:
C:\Program Files (x86)\Fujitsu\ServerView Suite\svom\data\ ServerView\Reports
To change this setting, clickManage Reportstab -Settingsin the navigation bar -General Settingstab.
3.6
Creating/Editing a report for presentation
Reports are built from data which is stored in the database by previously run-ning data collections. Reports form the basis for the presentation of this data on screen or its storage during an export task.
Before you create a report, you should check if there are report def-initions available to define a report task which will later produce the data you require.
1. Select theManage Reportstab.
2. In the navigation bar on the left, selectReports
3. To create a new report, clickCreate....
To edit an existing report, select this report and clickEdit....
TheCreate New Reportwizard opens with theChoose Report Def-initionstep.
In this step you select the content (report definition) of the report. 4. Enter a uniqueNamefor the report. (create only)
5. Optional: Enter a helpfulDescriptionof the report.
6. Enable theRun as Presentationoption, because you want to display the report on the screen.
7. Select all report definitions you want to use for the report from the
Reports Contentslist on the left.
If necessary, you can define a new report definition by clickingCreate...
8. ClickNext.
TheGraphical Formatsstep opens.
9. In this step, select the graphical formats for the presentation on screen. For use in presentations, report data can be shown as a table, a pie dia-gram, and/or a line diagram.
10. ClickNext.
TheAssign Serversstep opens.
In this step, select one or more servers you want to assign to the task. 11. ClickNext.
TheResultsstep opens.
This step shows the presentation of the selected values and adjust-ments.
In this step, it is possible to save to a file (html format) or to print the pre-sentation.
4
User interface
4.1
Wizards
A wizard is an assistant that guides you, step by step, through a task. A wizard usually consists of several steps that you work through in
sequence. The number of steps used and their sequence are shown in a tree structure on the left. Steps that you have already completed are indicated in the tree.
Mandatory input (input fields, selections) is marked with*.
The buttons in the bottom right of each step allow you to progress through the wizard.
Previous
Opens the previous step in the wizard.
Next
Opens the next step in the wizard.
Nextis only possible if all mandatory fields (marked with*) are filled.
Finish
Closes the wizard and applies all your settings.
Cancel
Cancels the wizard without saving your changes.
Help
Buttons for assignment >
Copies the entry selected in the list on the left into the list on the right.
>>
Copies all entries selected in the list on the left into the list on the right.
<
Removes the selected entry from the list on the right.
<<
Removes all entries from the list on the right.
Undo
4.2
Inventory Manager main window
Figure 2: Inventory Manager main window
The Inventory Manager offers handy and flexible access to managing cus-tomized collections of several types of data and their storage in the Server-View database. You can create reports based on this data and display them on screen or export them regularly in several output formats.
The main window contains the following elements (from top to bottom):
l ServerView Suite header l ServerView Suite menu bars
l Work area with the tree structure on the left and tabs on the right.
The navigation area on the left contains a tree structure. The view selected here determines the content shown in the work area on the right.
If you clickSettings, there is no tree structure in the navigation bar on the left.
4.3
Manage Data Collections tab
Depending on the view you selected in the navigation bar on the left, different functions are available on theManage Data Collectionstab.
l In theCollectionsview you define, schedule and run data collection
tasks.
l TheServersview shows an overview of all tasks for the servers
select-ed in the navigation bar.
l In theSettingsfor data collections,
o you define the maximum number of records (limit) written for status
information and temperature data for every server.
o you configure the settings for contacting the person who is to be
noti-fied every time a specinoti-fied data collection task is executed.
4.3.1
Data collections tree
This tree contains an overview of all defined data collections.
Standard Data Types
Contains predefined data collections which can be scheduled and assigned to server.
Custom Data Collections
Contains modified Standard Data Types and data collections you have defined yourself and which can be modified or deleted.
4.3.2
Servers in collections tree
This tree contains an overview of all servers in theServerList.
For a description of the icons, see the online help of theServerBrowser appli-cation.
1. Start theServerBrowserapplication. 2. ClickHelp-ON ServerBrowser
TheServerBrowseronline help is displayed.
3. TheBrowsing Panesection contains a description of the server icons.
All Servers
All servers in theServerList.
Groups
Customized groups, which you created with theServerListapplication. 4.3 Manage Data Collections tab
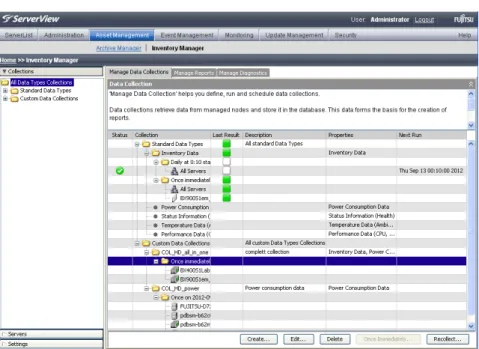
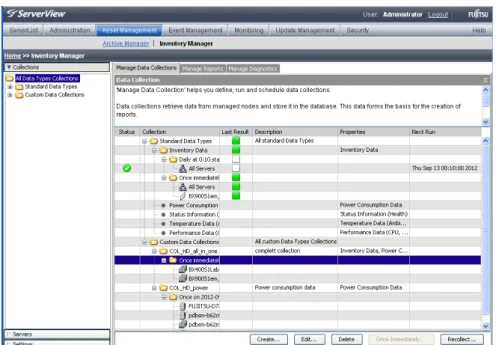
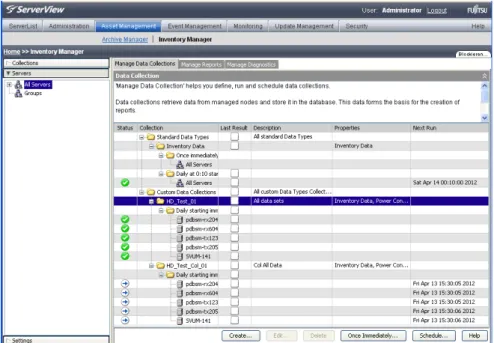
4.3.3
Data collections view
Figure 3: Data collections
In the table, a context menu is available. To open the context menu, right-click an entry in the table.
This view contains an overview of all defined data collections and their con-tents.
Two groups of data collections are available:
l Standard Data Types
Contains predefined data collections which can be scheduled and assigned to server.
l Custom Data Collections
Contains modified Standard Data Types and data collections you have defined yourself and which can be modified or deleted.
For every data collection the following information is shown:
Status
The icon in the first column indicates whether the defined task is acti-vated or not or the task is currently running on the server.
Task is activated. Task is currently running
Collection
Displays the name of the data collections, the defined tasks and the assigned servers.
Last Result
Indicates the status of the last run. Undefined, no result available
Last run has been successfully completed. An error occurred.
Description
For data collections: Description of the data collection.
For tasks: Specification as to when and how often the task will be executed, and whether the related log files are to be saved.
Properties
Data types contained in the task.
Next Run
Date of next execution.
Buttons Create...
Opens theData Collection Wizardto create a new data collection.
Edit...
Opens theData Collection Wizardto modify an existing data col-lection.
Delete
Deletes the selected task or server assignment.
Once Immediately...
Opens theCreate Data Collection Wizardwith theAssign Server
step to modify the selected data collection and start this task.
Recollect...
Opens theData Collection Wizardto assign server to a data collection task for collecting inventory data.The task runs once immediately.
Additional functions in the context menu Copy
Opens theCreate Data Collection Wizardto copy the selected data collection or data collection task.
Schedule...
Opens theCreate Data Collection Wizardwith theSchedule Task
step to create a scheduled task of the selected data collection.
Assign/De-assign Servers...
Opens theCreate Data Collection Wizardto assign or deassign servers.
Activate...
Deactivate
Deactivates the selected activated task.
Stop
Stops the selected task if it is currently running.
4.3.4
Create/Edit Data Collection Wizard
You can only create reports if data has previously been collected and stored in the database. TheData Collection Wizardhelps you specify data col-lections according to your needs.
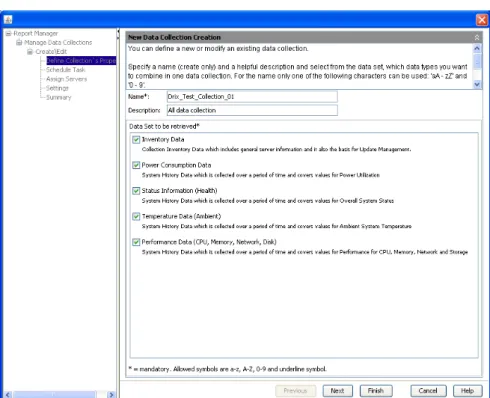
4.3.4.1 Define Collection Properties step (Create Data Collection Wizard)
Figure 4: Define collection properties
In this step, select the data type set(s) you want to use.
Name
Unique name of the data collection. Allowed characters: a-z, A-Z, 0-9, _
Description
Helpful description of the data collection.
Data set to be retrieved
Predefined data type sets for selection. Multiple selection is possible.
For more information about data type sets, see"Predefined standard data type sets for data collections" on page 113.
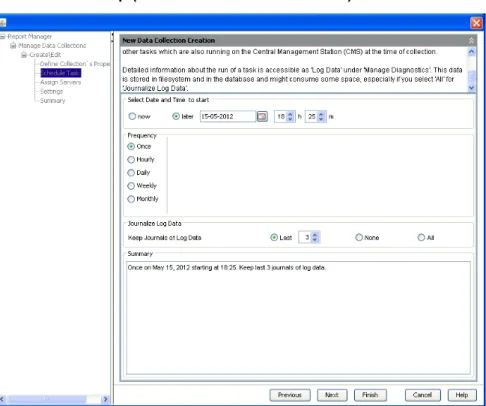
4.3.4.2 Schedule Task step (Create Data Collection Wizard)
Figure 5: Schedule task
In this step you specify when and how often the task will be executed, and whether the related log files are to be saved.
As the collection of data takes some time and uses up system resources, such tasks need to be scheduled carefully. To find an appropriate scheduling time, you need to consider the number of managed nodes and other tasks which are also running on the Central Management Station (CMS) at the time of collection.
Select Date and Time to start
Here you specify when the task is to be executed.
now Starts the task as soon as it has been activated.
later Starts the task at the specified time. Select the date, hour, and minutes.
Frequency
Here you specify how often the task is to be executed.
Once Execute task once
Hourly Execute task hourly
Daily Execute task daily
Weekly Execute task weekly
Monthly Execute task monthly
Journalize Log Data
Here you specify whether log files are to be saved, and if so, how many.
Last Only save the last log files
You can specify the number of last log files.
None Do not save any log files
All Save all log files
This option should be used carefully as log files can take up a lot of disk space.
Summary
4.3.4.3 Assign Servers step (Create Data Collection Wizard)
Figure 6: Assign servers
In this step, select one or more servers you want to assign to the task. If you select a blade server, the task is performed for the management blade and the server blades that belong to this blade server.
Available Servers
List of available servers in theServerListand the customized groups.
Attach Servers(mandatory)
List of the servers you have assigned to the task.
Undo
Undoes the last action you performed in the dialog.
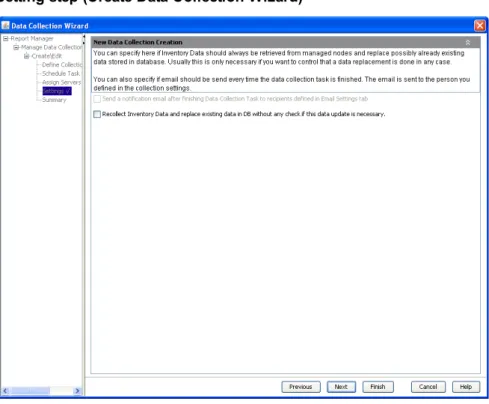
4.3.4.4 Setting step (Create Data Collection Wizard)
Figure 7: Settings
Send a notification email ...
Enable this option if you want the person defined in the data collection settings to be notified every time the task is executed.
Recollect Inventory Data ...
Enable this option if you want the inventory data to be updated every time the task is executed.
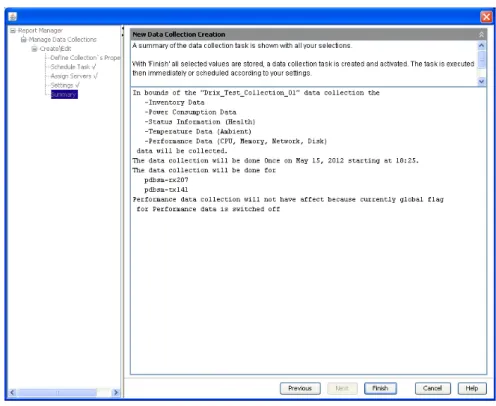
4.3.4.5 Summary step (Create Data Collection Wizard)
Figure 8: Summary
This step shows a summary of the selected values and adjustments. ClickFinishto save the data collection and activate the task.
4.3.5
Servers in data collections view
Figure 9: Servers
This view contains an overview of all tasks for the server selected in the navi-gation bar on the left.
For every server the following information is shown:
Status
The icon in the first column indicates whether the defined task is acti-vated or not or the task is currently running on the server.
Task is activated. Task is currently running
Last Result
Indicates the status of the last run. Undefined, no result available
Last run has been successfully completed. The log file contains server related information An error occurred.
The log file contains server related information
Collection
Type and name of the data collection, the defined tasks or the assigned servers.
Description
For data collections: Data types selected for the data collection For tasks: Specification as to when and how often the
task will be executed, and whether the related log files are to be saved.
Properties
Selected Data type set.
Next Run
Date of next execution.
Buttons Create...
Opens theCreate Data Collection Wizardto create a new data col-lection.
Edit...
Opens theCreate Data Collection Wizardto modify the selected data collection.
Delete
Deletes the selected task or server assignment.
Once Immediately...
Opens theCreate Data Collection Wizardwith theAssign Server
step to modify the selected data collection and start this task.
Schedule...
Opens theCreate Data Collection Wizardwith theSchedule Task
step to modify the selected data collection.
Additional functions in the context menu Copy
Opens theCreate Data Collection Wizardto copy the selected data collection or data collection task.
Assign/De-assign Servers...
Opens theCreate Data Collection Wizardto assign or deassign servers.
Activate...
Activates the selected, but not yet activated task.
Deactivate
Deactivates the selected activated task.
Stop
4.3.6
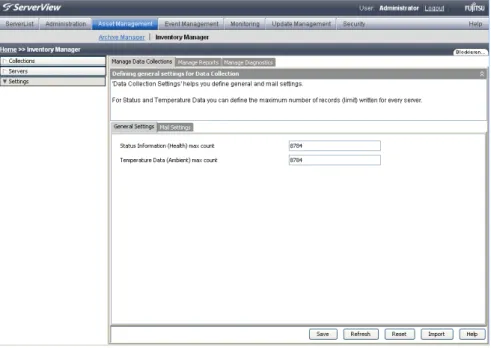
Settings for data collections
General SettingsIn this dialog you define the maximum number of records (limit) written for every server. The records are appended to the file until the limit is reached. Then the new records are still appended, but the oldest entries are deleted in turn.
Figure 10: General settings for data collections Status Information (Health) max.count
Maximum number of records for status information.
Temperature Data (Ambient) max.count
Maximum number of records for temperature data.
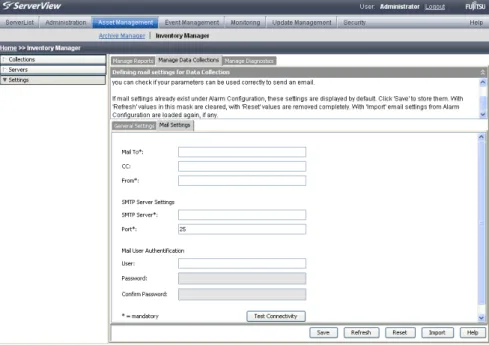
Mail Settings
In this dialog you configure the settings for contacting the person who is to be notified every time a specified data collection task is executed.
Figure 11: Mail setting for data collections
If mail settings already exist underAlarm Configuration, these set-tings are displayed by default.
To confirm the default settings, clickSave.
Mail to
Address of the e-mail recipients.
Cc
Address of further e-mail recipients.
From
SMTP Server Settings SMTP Server
IP address of the SMTP server.
Port
Port number of the SMTP server (default: 25).
Mail User Authentication User / Password
User name and password for authentication on the mail server.
Confirm Password
Enter password again.
Buttons
Test Connectivity
A test email is sent to the entered email addresses to check whether the email parameters are valid.
Save
Saves the current settings to the database.
Refresh
Imports the email parameters stored in the database to this dialog.
Reset
Clears the dialog box and removes the email parameters stored in the database.
Import
Imports the email parameters from the Event Management database to this dialog.
To save the imported email parameters to the database, clickSave. 4.3 Manage Data Collections tab
4.4
Manage Reports tab
Depending on the view you selected in the navigation bar on the left, different functions are available on theManage Reportstab.
l In theReportsview you define, schedule and run reports. l In theReport Definitionsview you define report definitions.
l TheServersview shows an overview of all tasks for the servers
select-ed in the navigation bar.
l In theSettingsfor data collections, you configure the settings for
con-tacting the person who is to be notified every time a specified report task is executed.
4.4.1
Reports tree
This tree contains an overview of all defined reports. Two groups of reports are available:
Standard Reports and Presentations
Contains predefined standard reports and presentations which cannot be modified or deleted.
Custom Reports and Presentations
Contains customized reports and presentations which are defined by you and can be modified or deleted.
4.4.2
Report Definitions tree
This tree contains an overview of all defined report definitions.
Standard Report Definition
Contains predefined report definitions which cannot be modified or delet-ed.
Custom Report Definition
Contains the report definitions which are defined by you and can be mod-ified or deleted.
4.4.3
Servers in reports tree
This tree contains an overview of all servers in theServerList.
For a description of the icons, see the online help of theServerBrowser appli-cation.
1. Start theServerBrowserapplication. 2. ClickHelp-ON ServerBrowser
TheServerBrowseronline help is displayed.
3. TheBrowsing Panesection contains a description of the server icons.
All Servers
All servers in theServerList.
Groups
4.4.4
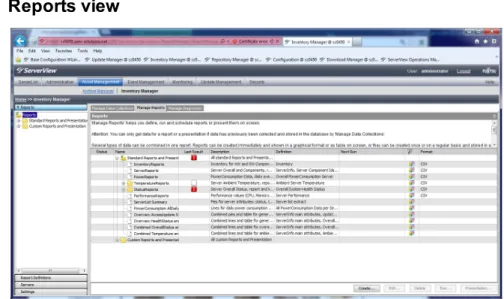
Reports view
Figure 12: Reports
In the table, a context menu is available. To open the context menu, right-click an entry in the table.
This view contains an overview of all defined reports and their contents. Two groups of reports are available:
l Standard Reports and Presentation
Contains predefined standard reports which cannot be modified or delet-ed.
l Custom Reports and Presentation
Contains customized reports which are defined by you and can be mod-ified or deleted.
For every report the following information is shown:
Status
The icon in the first column indicates whether the defined task is acti-vated or not or the task is currently running on the server.
Task is activated. Task is currently running
Name
Name of the report, the defined task or the assigned servers.
Last Result
Indicates the status of the last run. Undefined, no result available
Last run has been successfully completed. The log file contains server related information Last run has been successfully completed.
The log file contains a summary of the complete report. An error occurred.
The log file contains server related information An error occurred.
The log file contains a summary of the complete report.
Description
Description of the entry.
Definition
Name of the selected report definitions.
Next Run
Date of next execution.
The entries of this column indicate whether at least one graphical format has been defined for the corresponding report definition.
At least one graphical format has been defined for the cor-responding report definition.
If no icon is shown, no graphical format has been defined for the corresponding report definition.
Format
Output format of the report.
Buttons Create...
Opens theCreate Report Wizardto create a new report.
Edit...
Opens theCreate Report Wizardto modify the selected report.
Delete
Deletes the selected report or task.
Run...
Opens theCreate Report Wizardto assign servers to the selected report.
Presentation
Opens theCreate Report Wizardto specify the presentation on screen of the selected report.
Additional functions in the context menu Copy
Opens theCreate Report Wizardto copy the selected report or report task.
Once immediately...
Opens theCreate Report Wizardwith theAssign Serverstep to mod-ify the selected report and start this task.
Schedule...
Opens theCreate Report Wizardwith theSchedule Taskstep to create a scheduled task of the selected task.
Assign/De-assign Servers...
Opens theCreate Report Wizardwith theAssign Serverstep to assign or deassign servers to the selected task.
Activate...
Activates the selected, but not yet activated task.
Deactivate
Deactivates the selected activated task.
Stop
4.4.5
Create/Edit Report Wizard
Before you create a report, you should check if there are report def-initions available for defining a report task which will later produce the data you require.
Reports are built from data which is stored in the database by previously run-ning data collections. Reports form the basis for the presentation of this data on screen or its storage during an export task.
The export files are stored as follows: For Windows:
C:\Program Files\Fujitsu\ServerView Suite\svom\data\ ServerView\Reports
For Linux:
/opt/fujitsu/ServerViewSuite/svom/data/ServerView/Reports For x64:
C:\Program Files (x86)\Fujitsu\ServerView Suite\svom\data\ ServerView\Reports
To change this setting, clickManage Reportstab -Settingsin the navigation bar -General Settingstab.
4.4.5.1 Choose Report Definition step (Create Report Wizard)
Figure 13: Choose report definitions
In this step you select the content (one or more report definitions) of the report from theReportstree displayed underReports Contents.
Before you create a report, you should check if there are report def-initions available to define a report task which will later produce the data you require.
If it is necessary to define a new report definition, clickCreate...
Using theRun as Presentationoption, you choose whether to create a report for exporting data or for displaying it on the screen.
Name(mandatory field) Unique name of the report.
Allowed characters: a-z, A-Z, 0-9, _
Description
Here you can enter a helpful description of the report.
Run as Presentation
Enable this option if you want the report to be displayed on the screen. If you want the report to be exported in an output format, this option must be disabled.
Show description
For each report in theReports Contentstree, the related description is shown (if available).
Reports Contents(mandatory)
From theReportstree structure on the left that contains all available report definitions, you can select the subset of report definitions that you need for creating your report. The resulting subset is shown in the tree structure on the right. Standard report definitions and custom report def-initions are split into separate folders.
Beyond that, the report definitions of each folder are arranged in the sub-ject areasGeneral Information,Computer Information, andStatus Informationas described below.
Hovering over a report definition name with your mouse pointer dis-plays a tool tip with a short description of this report definition (if available). IfShow descriptionis enabled, for each report in the
Reports Contentstree, the related description is shown (if avail-able).
l General Information
o ServerInfo
o ServerInfo main attributes
o ServerIdList
o ServerComponent Ids o Inventory
o SERVER_LIST o SERVER_LIST extract
o SERVER_LIST main attributes o GROUP_LIST
o GROUP_SERVER o Update ServerList
l Computer Information
o Memory o MemoryArray o BIOS
o CPU
o Operating System
l Status Information
o Overall System Health Status o Overall System Health Status extract o Ambient Server Temperature
o Ambient Server Temperature extract o Server Performance
o Server Performance CPU o Server Performance Memory o Server Performance Network o Server Performance Storage
o Overall PowerConsumptionData Server extract,
aver-age/min/max per day
o Overall PowerConsumptionData Server, average/min/max per
day
o Last month PowerConsumption Data Server, average per hour o Last week PowerConsumption Data Server, average/min/max
per minute
o LastWeek PowerConsumption Data Server, average per
min-ute
Create...
Starts theCreate Report Definitiondialog to create a new report def-inition.
4.4.5.2 Graphical Format step (Create Report Wizard)
(for presentation on screen only)
Figure 14: Select graphical formats
In this step, you can select the graphical formats for the presentation on screen and define the related settings. The following types of graphical for-mats are available:
l table, l line diagram, l pie diagram.
Presenting data in these formats requires that the corresponding for-mat(s) is (are) selected. Deselecting a format causes the related pre-sentation to be ignored even if parameters are configured for this for-mat.
Table
In table presentation, all attributes defined in the report definition are list-ed.Tableis selected per default.
Lines
In line presentation, the values of the attributes defined in the report def-inition are shown as points arranged on a two-dimensional (xy) diagram.
Lineis only enabled for selection if the report definition currently being processed includes attributes that are suitable for being displayed in a line diagram.
WhenLinesis selected, a set of options is displayed allowing you to define the required line diagram parameters.
Available Options Lines diagram title
Title of the line diagram. This text field is preset with the name of the report definition currently being processed.
to show separate diagram for each server
Displays a separate line diagram for each selected server. This option is disabled if the report definition is based on a view that does not contain theServerNameattribute.
This applies to the following views:
l SV_ComponentTypeList l SV_ContainerList l SV_ReportData l SV_ServerMetaData l SV_ServerPerformanceMetaData l SV_ServerStatusMetaData l SV_ServerTemperatureMetaData
l VWFunctionalContainer l VWInfo
l VWPhysicalContainer
to show one diagram for all selected servers
Displays one line diagram for all selected servers. Within this diagram, a separate line for each line attribute and server is shown.This option is disabled if the report definition is based on one a view that does not contain theServerNameattribute (see above).
X axis name
Name of the x-axis.X axis nameis preset with the x-axis attrib-ute name. Currently, "Timestamp" is the only possible name for
X axis name.
Y axis name
Name of the y-axis.Y axis nameis preset with the string "Y axis name". According to the type of data the report definition is based on, the presetY axis nameis automatically mapped to a more meaningful name (see the table below).
Report definition is based on: -+
Temperature data Temperature Power consumption data Power Consumption Status information Status
Performance data (networks) Performance, Network Performance data (CPU) Performance, CPU Performance data (storage) Performance, Storage Performance data (memory) Performance, Memory
Line for the attribute
Offers for selection the attributes for which no line is defined yet (in the report definition currently being processed).
Title
Allows you to enter a diagram title of your choice.Titleis preset with the name of selected attribute and changes when another attribute is selected.
Add Line
Adds a new line to the diagram.
Detach line
Removes the corresponding line.
Pies
In pie presentation, the values of the attributes defined in the report def-inition are shown as pie diagrams.
WhenPiesis selected, a set of options is displayed allowing you to define the required line diagram parameters.
Available Options Effects
Here you can select your preferred style for displaying the pie diagrams.
2D
2D look
exploded
2D exploded look
3D
3D look
to show separate diagram for each server
Displays a separate pie diagram for each selected server. This option is disabled if the report definition is based on one a view that does not contain theServerNameattribute.
This applies to the following views:
This applies to the following views:
l SV_ComponentTypeList l SV_ContainerList l SV_ReportData l SV_ServerMetaData l SV_ServerPerformanceMetaData l SV_ServerStatusMetaData l SV_ServerTemperatureMetaData l VWFunctionalContainer l VWInfo l VWPhysicalContainer
to show one diagram for all selected servers
Displays one pie diagram showing data of all servers as con-tinuous data.This option is disabled if the report definition is based on one a view that does not contain theServerName
attribute (see above).
Pie for the attribute
Offers for selection the attributes for which no line is defined yet (in the report definition currently being processed).
Title
Allows you to enter a diagram title of your choice.Titleis preset with the name of seleceted attribute and changes when another
attribute is selected.
Add Pie
Adds a new pie to the diagram.
Detach line
Removes the corresponding pie diagram.
4.4.5.3 Output Formats step (Create Report Wizard)
(for data export only)
Figure 15: Select output formats
In this step, select at least one output format for the report.
For export purposes, reports can be generated in CSV (Comma Separated Value), XML, PDF or HTML format. For storage in the database, an SQL script can be generated, which must be executed later on, or the data can be stored directly via ODBC.
The export files are stored as follows: For Windows:
C:\Program Files\Fujitsu\ServerView Suite\svom\data\ ServerView\Reports
For Linux:
/opt/fujitsu/ServerViewSuite/svom/data/ServerView/Reports For x64:
C:\Program Files (x86)\Fujitsu\ServerView Suite\svom\data\ ServerView\Reports
To change this setting, clickManage Reportstab -Settingsin the navigation bar -General Settingstab.
4.4.5.4 Format Parameters step (Create Report Wizard)
(for data export in CSV, ODBC and SQL only)
Figure 16: Specify format parameters
In this step you specify the information required for the data export.
CSV
Choose Separator
Specify the separator character for the export file, e.g. tab, sem-icolon, comma or blank.
Choose Text Delimiter
Specify the text delimiter character for the export file, e.g. double quotes (“), single quotes (’) or no delimiter (none).
ODBC
The values of the existing database connection are displayed.
Name
ODBC data source name
Driver
ODBC drivers to access the data base
Server Name
IP address or DNS name of the data base server
Type
Type of the data source
Description
Description of the data source
Database Name
Name of the database for the exported data
User
Access account for the database
Password
Password of the account
SQL
MSSQL / SQL
Select the desired database format.
4.4.5.5 Schedule Report step (Create Report Wizard)
(for data export only)
Figure 17: Schedule report
In this step you specify when and how often the task will be executed, and whether the related log files are to be saved.
Schedule Definition
Select Date and Time to start
Here you specify when the task is to be executed.
now Starts the task as soon as it has been activated.
later Starts the task at the specified time. Select the date, hour, and minutes.
Frequency
Here you specify how often the task is to be executed.
Once Execute task once
Hourly Execute task hourly
Daily Execute task daily
Weekly Execute task weekly
Monthly Execute task monthly
Journalize Log Data
Here you specify whether log files are to be saved, and if so, how many.
Last Only save the last log files
You can specify the number of last log files.
None Do not save any log files
All Save all log files
This option should be used carefully as log files can take up a lot of disk space.
Summary
The field shows a summary of the values specified.
4.4.5.6 Assign Servers step (Create Report Wizard)
Figure 18: Assign servers
In this step, select one or more servers you want to assign to the task. If you select a blade server, the task is performed for the management blade and the server blades that belong to this blade server.
Available Servers
List of available servers in theServerListand the customized groups.
Attach Servers(mandatory)
List of the servers you have assigned to the task.
Undo
4.4.5.7 Report Settings step (Create Report Wizard)
(for data export only)
Figure 19: Report Settings Send a notification email ...
Enable this option if you want the person defined in the report settings to be notified every time the task is executed.
4.4.5.8 Results step (Create Report Wizard)
(for presentation on screen only)
This step shows the presentation of the report. Depending on the settings you made in the previous steps, the presentation may comprise one or more tables, pie diagrams, and/or line diagrams.
For presentation, saving and printing presentation data, the Inventory Manager internally uses third-party libraries containing fonts to present data in a certain manner. By default, these libraries try to use the "Arial" font for saving and printing data. The required libraries are expected to be installed on your local system where the browser is started. Gen-erally, you can assume that such a font library is available on your sys-tem. However, this cannot be guaranteed for all systems where Server-View Operations Manager is installed or where the browser is started. This especially applies to Linux systems.
Therefore, it might be necessary in some cases that you provide such a font for use in Inventory Manager by using theLoad fontbutton.
Explicitly providing a font file is normally required only when the following warning occurred:
Font does not contain all symbols necessary for displaying pre-sentation. You may see wrong or missing symbols instead of meaningful characters. Please load a font that contains all required symbols.
Usually, this happens only with Japanese characters.
You can bypass this problem by loading an additional font manually: 1. Find an appropriate font (file typettforttc).
l On Windows systems, fonts are located in%windir%\Fonts l On Linux systems, font files may be located, for example, in
/var/fonts. Please search the Internet for details about installing fonts under the various Linux systems.
For European languages, the font should contain extended Latin mapping, digits and special symbols. To support Japanese lan-guage correctly, the font should contain both mapping sets of Jap-anese characters.Normally, thefontfolders on your system con-tain a variety of font files, but not all of them meet the
requirements.
If you cannot see font files in your browser dialog (although shown by the file explorer in the file system), your browser might be miss-ing the necessary access rights for this directory. In this case, please copy the relevant font files into a directory that can be accessed by your browser and try again.
If you cannot find an appropriate font in the local font folders then please search the Internet for such a font and download the fonts to your system. For Linux systems, there are some rpm packages that contain helpful font files:ipam.ttf,VL-PGothic-Regular.ttf,
VL-Gothic-Regular.ttf.
2. Select the appropriate fonts and copy them to your system.
For selecting and installing the correct fonts and checking them for all required symbols, you have the option to either load the fonts one by one, or check the corresponding font by using special programs that show font mapping. Such programs are available for download in the Internet.
3. ClickLoad fontto load the fonts from the system where your browser has been started into Inventory Manager (see below).
Report presentation as a table
A table lists all attributes of a report definition for all servers that have been been assigned in theAssign Serversstep.
Figure 20: Report presentation (table) Report presentation as a pie diagram
A pie diagram visualizes the percentage value of one attribute of a report def-inition that has been selected in theChoose Report Definitionstep. Depending on your settings made in theGraphical Formatsstep, the dia-gram may show percentage values of all assigned servers or of only one of them.
The default maximum number of sections displayed in a pie diagram is restricted to 10. Therefore, possibly not all of the original sectors may displayed in the diagram: The 10 biggest shares are each displayed in a separate sector. The aggregate values of the remaining sectors are shown in theOtherssector. You can use thePresentation Settings
tab to increase the number of displayed sectors (see"Settings for reports" on page 95).
Figure 21: Report presentation (pie diagram) Report presentation as a line diagram
A line diagram visualizes one attribute of a report definition that has been selected in theChoose Report Definitionstep. Depending on your settings made in theGraphical Formatsstep, the diagram may show a line for each assigned servers or for only one of them.