* Corresponding Author: School of Business Administration, Kyungpook National University,
THE
RELATION
BETWEEN
CASH
HOLDINGS
ANDR&D
EXPENDITURES ACCORDING TO OWNERSHIP STRUCTURE
Hyuna Kim
*and Sun-Young Park
**Abstract: In this paper, we examine how the cash holdings have an impact on R&D expenditures and whether the ownership mechanisms moderate the R&D expenditures- the resource of internal funds relationship. The result showed that cash holdings have a positively relationship with R&D expenditures. Specially, we found that institutional ownership had a positive moderating effect of the R&D expenditures-the resource of internal funds relationship. In additional analysis, the large business group and the share of managers doesn’t moderate the relationship between cash holdings and R&D expenditures. These results provide that institutional investor in Korea tend to be long-term oriented, “active” and “sophisticated” investor. They are less likely to evaluate corporate executives on the basis of short-term earnings alone and are more likely to support value-creating.
Keywords: Cash Holdings, R&D Expenditures, R&D Investments, Ownership Mechanisms, Ownership Structure
1. Introduction
These days, corporations have increased R&D investments in order to achieve continuous economic growth and competitiveness in the rapidly changing management environment and unlimited competition.
Prior studies suggest that there is positive correlation between the R&D investments and economic growth rate (Romer, 1990; Lucas, 1988). These findings raise the further interest of whether R&D expenditures are associated with firm performance. Various ownership mechanisms have been identified to help ensure that managers make strategic corporate decisions such as R&D investments in ways that enhance shareholder value.
Prior studies have examined that how the internal and external funds and liquidity of company affect R&D expenditures and how the ownership mechanisms affect decision makings about investment. However, researchers argue whether the ownership structures indirectly affect the R&D expenditures-the resource of internal funds relationship.
In this paper, we examine how the cash holdings have an impact on R&D expenditures and whether the ownership mechanisms moderate R&D expenditures-the resource of internal funds relationship.
We drew our sample firms that were listed on the Korea Stock Exchange (KSE) and collected data for the years 2005 to 2010. We used the KIS-VALUE database to gather financial data. Firms with missing for
one or more years during the study period were excluded, resulting in 1,675 firms (year) for which all information was collected.
The result showed that cash holdings have a positively relationship with R&D expenditures. Specially, we found that institutional investor had a positive moderating effect of the resource of internal funds-R&D expenditures relationship.
We have attempted to empirically demonstrate the moderating effect of the relationship between cash holdings and R&D expenditures. Prior studies have no distinguished the moderating effect. Most studies have examined only the relationship between cash holdings and R&D expenditures.
The rest of this paper is structured as follows. In section 2, we reviewed the literature regarding aspects of ownership structure of R&D expenditures and the source of funding to R&D expenditures. We proposed the hypotheses about the moderating effects of different types of owners on the relationship between cash holdings and R&D expenditures. In section 3, we designed the research and in section 4, we did the empirical test and presented the results. Finally, we concluded with implications and pointed out the directions for future research.
2. Theoretical Background and Hypotheses
2.1. Literature Review
Since this paper aims to investigate the moderating affects of different types of owners on the relationship between cash holdings and R&D expenditures. In the following parts we will review the literature regarding aspects of ownership structure of R&D expenditures and the source of funding to R&D expenditures.
According to resource-based view, the resources a firm possesses decide its strategy. Financial factors such as financial slack have been considered as important resources in determining firm’s R&D investment. Sharfman et al. (1988) simplified their classification and identified slack resources from high discretion to low discretion. According to the perspective from Cyert and March (1963), it is definitely the case that slack promotes R&D activities. Many empirical studies have showed supports for it. Singh (1986) reported that both absorbed and unabsorbed slack have a positive relationship with risk taking projects. Zajac and Bazerman (1991) reported that the factors that might enhance innovation in internal corporate joint venture. And they found that organizational slack is positively related to innovativeness.
However, other researchers claim that slack is kind of unnecessary cost and is not conducive to innovation. Thus, this view predicts negative relationship between slack and R&D investments. Nohria and Gulati (1996) reconciled above contradictive views by arguing that there is an inverse U-shaped relationship between slack and innovation. Kim et al. (2008) provide further evidence for Korean firms that the relationship between slack and R&D investments is curvilinear. Therefore, these studies showed
that certain amount of slack resources is needed for innovation while too much slack indicates wasted of resources.
Ownership structure is the basis of corporate governance (Williamson and Mellanby, 1963). Several studies have been done on the effects of ownership structure on firm performance, capital structure and other aspects. So, R&D investments are important research studying in this area. Many studies mainly use agency theory to investigate the influences of ownership structure on R&D investments. Agency problem occurs because of interests’ conflict and information asymmetry between owners and managers (Fama and Jensen, 1983; Eisenhardt, 1989). Therefore, previous researchers link R&D investments with ownership structure in terms of incentive misalignment and information asymmetry (Lee and O’Neill, 2003). Most of studies have been reported that relationship between ownership and R&D investments. Drucker (1986), Mitroff (1987) and Scherer (1986) held the view that institutional investor are short-term oriented which lead to their myopic investment strategy. However, Jarrell et al. (1985) indicated the opposite. Graves (1988) found that increased institutional investor ownership decreases R&D investments. Hoskisson et al. (2002) provided one persuasive argument that different types of institutional investors have different investment horizons. Block and Thams (2007) didn’t find evidence that family firms are more long-term oriented. But Kim et al. (2008) found that controlling owners promote R&D investments. Therefore, more empirical studies need to be done to discern the role of controlling owners on R&D investments.
2.2. Hypotheses Development
Although existing literature indicated two contrary views on the role of financial slack on innovation, namely promoting innovation and wastes of resources, they have the same implication on the relationship between financial slack and R&D expenditures. Slack resources allow firms to take more experimentation and engage in more R&D activities (Bourgeois, 1981). This view supports the arguments that more financial slack would lead to more R&D expenditures. We form the following hypothesis
Hypothesis 1: Cash holdings are positively associated with R&D expenditures.
The relationship between cash holdings and R&D expenditures might differ depending on the ownership structure of corporate. In general, outside owners suffer from informational and control disadvantages unlike inside owners (Williamson, 1975). Nonetheless, institutional investors may be “sophisticated” and “active” investor compared to individual investors. Indeed, domestic institutional investors have strong incentives to incur the cost of monitoring firms because they often hold substantial ownership blocks in firms (Kim et al. 2008). Foreign investors in emerging economies tend to be predominantly institutional investors from U.S. and European
financial institutions (Choe et al. 1999). Before IMF in 1997, foreign investors in Korea were not had own more than 7% of shares in a domestic Korea firms. However, since IMF, such restrictions have been removed. So, the share of foreign owners has been increased. These foreign owners now exercise a larger influence on the corporate governance system than ever before (Joh, 2003; Gillan and Starks, 2003). In developed economies, insofar as institutional investors are “active” as well as “sophisticated” investors, they are less likely to evaluate corporate executives on the basis of short-term earnings alone and are more likely to support value-creating, long-term projects (Kochhar and David, 1996; Hansen and Hill, 1991; Baysinger et al. 1991). In the same view, long-term expenditures such as R&D are positively related to foreign owner (David et al. 2006). But in emerging economies, domestic institutional investor and foreign investors tend to be short-term oriented because of the poor protection that they receive (La Porta et al. 2000). Facing the expropriation hazard by controlling shareholders, these outside investor may prefer to obtain immediate gains through dividends from financial slack (Easterbrook, 1984; Jensen, 1989; La Porta et al. 2002; Shefrin and Statman, 1984).
Thus, we suggest the following hypotheses for testing for moderating effects foreign ownership and institutional ownership may have on the association of cash holdings and R&D expenditures.
Hypothesis 2-1: Foreign ownership moderates the relationship between cash holdings and R&D expenditures.
Hypothesis 2-2: Institutional ownership moderates the relationship between cash holdings and R&D expenditures.
3. Research Design
We examine how the cash holdings have an impact on R&D expenditures and whether the ownership structures moderate between the R&D expenditures and cash holdings. So, we test moderate regression. Sharma et al. (1981) propose a moderator typology for distinguishing moderators by using two dimensions, illustrated by the following regression equation Figure 1.
Model 1: Y = β0 + β1X + ε
Model 2: Y = β0 + β1X + β2Z + ε
Model 3: Y = β0 + β1X + β2Z + β3XZ +ε
Figure 1. Test of moderate regression
Where Y is the dependent variable, X is the independent or predictor variable and Z is the suspected moderator variable. If in model 2 and 3, β2 is significant and β3 is not significant, moderate variable Z is
independent variables but is related to either the independent or dependent variable. If in model 2 and 3, β2 and β3 is significant, moderate variable Z is
Quasi-moderator. It represents a variable that interact with the independent variables and is related to either the independent or dependent variable.
If in model 2, β2 is not significant, in model 3, β3 is significant,
moderate variable Z is pure moderator. It represents a variable that interact with the independent variables but is not related to either the independent or dependent variable. If in model 2, β2 is not significant, in model 3, β3 is
not significant, moderate variable Z is not moderator. It represents a variable that does not interact with the independent variables but is not related to either the independent or dependent variable. It significant differences are found in the subgroups test, the variable is a homologizer (Le et al. 2006).
First, we test whether cash holdings is positing associated with R&D expenditures, specifically we estimate the following model.
) 1 (
, , 7
, 6
, 5 , 4 , 3
, 2 1 , 1 0 ,
t i t i t
i
t i t
i t
i t
i t
i t
i
TANGI ROA
LEV SIZE
SALES MB
CASH RD
where:
:
RD R&D intensity
CASH: Cash holdings
MB: Future investment opportunities
SALES: Growth rate of sales
SIZE: Firm size
LEV: Leverage ratio
ROA: Return on assets
TANGI: Tangible assets investments
In this equation, RD is the R&D intensity that was measured by the ratio of R&D expenditure to sales. We include cash holdings as an independent variable, measured as the ratio of quick assets (cash and marketable securities) to total assets. For control variables, we control for future investment opportunities, growth rate of sales, firm size, leverage ratio, return on assets, and tangible assets investments. MB is the future investment opportunities. This is calculated as (Total liability + Market capital)/Total assets. SALES is growth rate of sales and SIZE is measured using natural log total assets. LEV leverage ratio that measured total debt divided by total assets. ROA is a return of assets that measured as reported earnings divided by total assets. TANGI proxies for reduced funds available for investment and/or entry into a more mature, lower investment stage of the firm’s life cycle (Perry and Grinaker, 1994).
Hypothesis 1 predicts that cash holdings is positing associated with R&D expenditures. We test this prediction by examining if the coefficient on cash holdings is greater than zero. In this paper, we examine whether select ownership structure (i.e. foreign ownership and institutional
ownership) moderate the cash holdings-R&D expenditures relationship. To test hypothesis 2-1, we estimate the following equation (2).
) 2 ( , , 9 , 8 , 7 , 6 , 5 , 4 , 1 , 3 , 2 1 , 1 0 , t i t i t i t i t i t i t i t i t i t i t i t i TANGI ROA LEV SIZE SALE MB FOR CASH FOR CASH RD where:
FOR: Foreign ownership
FOR is measured as the percentage of equity ownership held by both foreign firms and foreign financial institutions. If moderator interacts with the independent, the regression coefficient β3 of the interactive variable,
CASH-FOR in the above equation will prove significant.
To test hypothesis 2-2, we estimate the following equation (3).
) 3 ( , , 9 , 8 , 7 , 6 , 5 , 4 , 1 , 3 , 2 1 , 1 0 , t i t i t i t i t i t i t i t i t i t i t i t i TANGI ROA LEV SIZE SALE MB INSTI CASH INSTI CASH RD where:
INSTI: Institutional ownership
INSTI is measured as the percentage of equity ownership held by domestic institutional investor. If the regression coefficient β3 of the
interactive variable CASH-INSTI is statistically significant, institutional investor moderates between cash holdings and R&D expenditures.
Our initial sample includes all Korean firms that listed on the Korea Stock Exchange (KSE) between 2005 and 2010. The selection criteria of sample are as following.
1) Firms that belong in non financial industry 2) Fiscal year is December 31
3) Firms with financial data in the KIS-VALUE database
These selection criteria give us a sample of 3,893 firm-year observations. Firms with missing data for one or more years during the study period were excluded resulting in 1,675 firm-year observation with all information was collected. Table 1 presents the sample selection process.
Table 1. Sample selection process
2005 2006 2007 2008 2009 2010 Total
observation December 31
fiscal year 649 649 649 649 648 649 3,893
Less than 0.1%
R&D intensity (179) (178) (196) (212) (222) (205) (1,192)
Missing value (161) (150) (128) (103) (86) (91) (719)
Outlier (39) (47) (57) (55) (53) (56) (307)
Total
observation 270 274 268 279 287 297 1,675
4. Results
4.1. Descriptive Statistics and Correlations
Table 2 provides descriptive statistics for the variables included in our study. As presented in this table, the mean (median) value for Cash holdings (CASH) is 0.049 (0.036), and the minimum are 0.000 but this doesn’t mean real zero. Foreign ownership (FOR) and institutional ownership (INSTI) in the descriptive statistics are showing a similar level.
Table 3 presents correlations among our main variables. R&D expenditures (RD) and Cash holdings (CASH) are positively and significantly related (correlation of 0.109). This is evidence that firms with relatively larger cash holdings also invest R&D. This is consistent with prior research. And foreign ownership (FOR) is correlated with R&D expenditures, but institutional ownership (INSTI) is not. Also, the correlation between leverage ratio (LEV) and future investment opportunity (MB) measures is 0.698. Some of the correlation between various independent and control variables are significant, suggesting multicollinearity may be an issue. We estimated the variance inflation factors (VIF) statistics-none of which exceeded 2, which is well below 10, the level at which multicollinearity may be a problem. So, our analyses are unlikely to have a serious problem with multicollinearity.
Table 2. Descriptive statistics
Mean Median Min. Max. Sd.
RD 0.017 0.010 0.001 0.102 0.018
CASH 0.049 0.036 0.000 0.223 0.046
FOR 0.026 0.000 0.000 0.225 0.050
INSTI 0.027 0.000 0.000 0.216 0.049
MB 2.060 1.772 0.406 6.753 1.166
SALES 0.090 0.076 -0.645 0.810 0.180
SIZE 26.581 26.254 23.183 31.102 1.523
LEV 0.439 0.458 0.026 0.855 0.173
ROA 0.040 0.041 -0.319 0.359 0.060
TANGI 0.050 0.033 0.000 0.258 0.051
Notes: RD: R&D intensity (R&D expenditure/sales); CASH: Cash holdings (quick assets (cash and marketable securities)/total assets); FOR: Foreign ownership; INSTI: Institutional ownership; MB: Future investment opportunities ((total liability + market capital)/total assets); SALES: Growth rate of sales ((salest-salest-1)/salest-1);
SIZE: Firm size (ln(total assets)); LEV: Leverage ratio (total debt/total assets); ROA: Return on assets(reported earnings/total assets); TANGI: Tangible assets investments((tangible assetst - tangible assetst-1 + depreciation cost)/total assets)
Table 3. Correlation matrix
RD CASH FOR INSTI MB SALES SIZE LEV ROA TANGI RD 1.000
CASH 0.109 ***
1.000
FOR 0.066 ***
0.078 ***
1.000
INSTI 0.024 0.018 -0.010 1.000
MB 0.065 ***
-0.059 **
0.028 0.000 1.000
SALES -0.046 *
0.009 -0.025 0.048 **
0.122 ***
1.000
SIZE 0.052 **
-0.030 0.289 ***
0.175 ***
0.292 ***
0.084 ***
1.000
LEV -0.044 *
-0.149 ***
-0.099 ***
-0.067 ***
0.698 ***
0.090 ***
0.221 ***
1.000
ROA 0.036 0.145 ***
0.141 ***
0.088 ***
-0.116 ***
0.205 ***
0.143 ***
-0.377 ***
1.000
TANGI 0.023 -0.048 **
-0.010 -0.036 0.059 **
0.094 ***
0.081 ***
0.090 ***
0.006 1.000
*p < 0.1, **p < 0.05, ***p < 0.01
Notes: RD: R&D intensity (R&D expenditure/sales); CASH: Cash holdings (quick assets (cash and marketable securities)/total assets); FOR: Foreign ownership; INSTI: Institutional ownership; MB: Future investment opportunities ((total liability + market capital)/total assets); SALES: Growth rate of sales ((salest-salest-1)/salest-1);SIZE: Firm size (ln(total assets)); LEV: Leverage ratio (total debt/total assets)
4.2. Multiple Regression Results
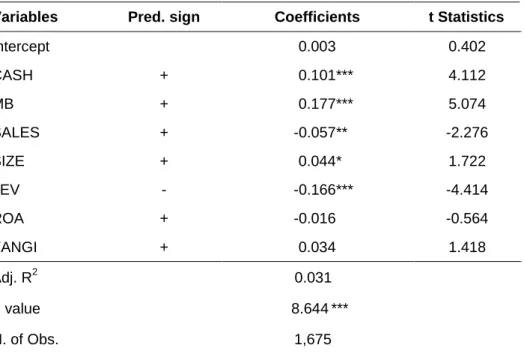
Table 4 provides the empirical analysis of Hypothesis 1. We find evidence that cash holdings is positively associated with R&D expenditures. The estimated coefficient on cash holdings (CASH) is positive and statistically significant. This finding provides consistent support for Hypothesis 1. This is consistent with prior research. The estimated coefficient on future investment opportunity (MB) is positive and statistically significant. This means that firms increase R&D investments when opportunity of future investments occurs. On the other hand, the past growth variable, sales growth rate (SALES) is negatively related with R&D expenditures, against expectation. Lee and Kim (2000) insist that R&D expenditures effect on the return on assets and growth of tangible assets but don’t effect on the growth rate of sales. We think that the firms increase R&D expenditures to cover the low growth rate of current sales. The firm size (SIZE) is marginally significant. The estimated coefficients sign for leverage ratio (LEV) is negative. Tangible assets investments (TANGI) are positive but not statistically significant.
Table 4. Regression analysis on the cash holdings-R&D expenditures relationship
t i t i t
i
t i t
i t
i t
i t
i t
i
TANGI ROA
LEV SIZE
SALES MB
CASH RD
, , 7 , 6
, 5 , 4 , 3 , 2 1 , 1 0 ,
Variables Pred. sign Coefficients t Statistics
Intercept 0.003 0.402
CASH + 0.101 *** 4.112
MB + 0.177 *** 5.074
SALES + -0.057 ** -2.276
SIZE + 0.044 * 1.722
LEV - -0.166 *** -4.414
ROA + -0.016 -0.564
TANGI + 0.034 1.418
Adj. R2 0.031
F value 8.644 ***
N. of Obs. 1,675
*p < 0.1, **P < 0.05, ***p < 0.01
Notes: RD: R&D intensity (R&D expenditure/sales); CASH: Cash holdings (quick assets (cash and marketable securities)/total assets); MB: Future investment opportunities ((total liability + market capital)/total assets); SALES: Growth rate of sales ((salest-salest-1)/salest-1); SIZE: Firm size (ln(total assets)); LEV: Leverage ratio (total debt/total assets); ROA: Return on assets(reported earnings/total assets); TANGI: Tangible assets investments((tangible assetst-tangible assets t-1+depreciation costt)/total assetst).
Table 5 reports the result of Hypothesis 2-1. In the hierarchical regression analysis, we entered our moderator variable that is foreign ownership (FOR), in successive models. From Table 5, in terms of the interactions between the proxies for cash holdings (CASH) and foreign ownership (FOR), the estimate coefficients are insignificant. Our results suggest that foreign ownership doesn’t moderate the relationship between cash holdings and R&D expenditures. We did not support for hypothesis 2-1. Therefore, foreign ownership (FOR) is not a moderator. Other control variable is the same with result of Table 4.
Table 5. Hierarchical regression analysis for examination of the effect of foreign ownership on cash holdings and R&D expenditures
t i t i t
i t
i t
i t
i
t i t
i t
i t
i t
i t
i
TANGI ROA
LEV SIZE
SALE
MB FOR
CASH FOR
CASH RD
, , 9
, 8 , 7 , 6 , 5
, 4 , 1
, 3 , 2 1 , 1 0 ,
Variables Pred. sign Step 1 Step 2 Step 3
Intercept 0.003 0.005 0.005 *
CASH + 0.101 *** 0.099 *** 0.096 ***
FOR - 0.028 0.020
CASH*FOR + 0.013
MB + 0.177 *** 0.174 *** 0.174 ***
SALES + -0.057 ** -0.056 ** -0.056 **
SIZE + 0.044 * 0.036 0.036
LEV - -0.166 *** -0.160 *** -0.160 ***
ROA + -0.016 -0.017 -0.017
TANGI + 0.034 0.035 0.035
Adj. R2 0.031 0.031 0.031
N. of Obs. 1,675 1,675 1,675
F value 8.644*** 7.715*** 6.871***
*p < 0.1, **P < 0.05, ***p < 0.01
Notes: RD : R&D intensity (R&D expenditure/sales); CASH : Cash holdings (quick assets (cash and marketable securities)/total assets); FOR : Foreign ownership; MB : Future investment opportunities ((total liability + market capital)/total assets); SALES : Growth rate of sales ((salest-salest-1)/salest-1); SIZE : Firm size (ln(total assets)); LEV : Leverage ratio (total debt/total assets); ROA : Return on assets(reported earnings/total assets) ; TANGI : Tangible assets investments((tangible assetst-tangible assetst-1+depreciation costt)/total assetst)
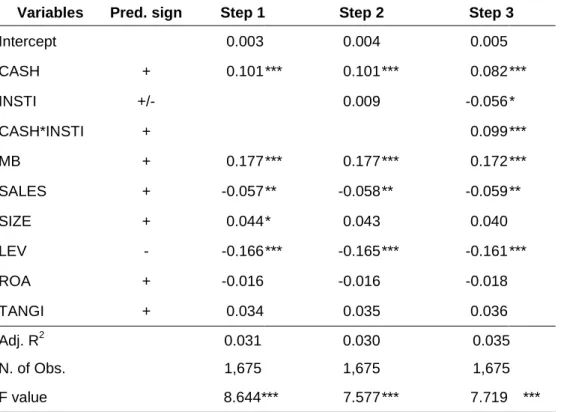
Table 6 shows the result of Hypothesis 2-2. Hypothesis 2-2 predicts that institutional ownership mitigate the relationship between cash holdings and R&D expenditures. In the Step 2 of Table 6, the coefficient of institutional ownership (INSTI) is statistically insignificant and the interaction between cash holdings (CASH) and institutional ownership (INSTI) is statistically significant (with the estimate coefficient equals 0.099). Therefore, institutional ownership (INSTI) is a pure moderator.
Our results suggest that institutional ownership strengthen the relationship between cash holdings and R&D expenditures. So, we can say that they are less likely to evaluate corporate executives on the basis of short-term earnings alone and are more likely to support value-creating.
Table 6. Hierarchical regression analysis for examination of the effect of institutional ownership on cash holdings and R&D expenditures
t i t i t
i t
i t
i t
i
t i t
i t
i t
i t
i t
i
TANGI ROA
LEV SIZE
SALE
MB INSTI
CASH INSTI
CASH RD
, , 9
, 8 , 7 , 6 , 5
, 4 , 1
, 3 , 2 1 , 1 0 ,
Variables Pred. sign Step 1 Step 2 Step 3
Intercept 0.003 0.004 0.005
CASH + 0.101 *** 0.101 *** 0.082 ***
INSTI +/- 0.009 -0.056 *
CASH*INSTI + 0.099 ***
MB + 0.177 *** 0.177 *** 0.172 ***
SALES + -0.057 ** -0.058 ** -0.059 **
SIZE + 0.044 * 0.043 0.040
LEV - -0.166 *** -0.165 *** -0.161 ***
ROA + -0.016 -0.016 -0.018
TANGI + 0.034 0.035 0.036
Adj. R2 0.031 0.030 0.035
N. of Obs. 1,675 1,675 1,675
F value 8.644*** 7.577 *** 7.719 ***
*p < 0.1, **P < 0.05, ***p < 0.01
Notes: RD: R&D intensity (R&D expenditure/sales); CASH: Cash holdings (quick assets (cash and marketable securities)/total assets); INSTI: Institutional ownership; MB: Future investment opportunities ((total liability + market capital)/total assets); SALES: Growth rate of sales ((salest-salest-1)/salest-1); SIZE: Firm size (ln(total assets)); LEV: Leverage ratio (total debt/total assets); ROA: Return on assets(reported earnings/total assets) ; TANGI: Tangible assets investments((tangible assetst-tangible assets t-1+depreciation costt)/total assetst)
4.3. The Additional Analysis
There is a lot of the ownership in corporate apart from outside ownership such as foreign ownership and institutional ownership. So, we test the moderating effects various ownership between cash holdings and R&D expenditures.
A lot of Korean firms are classified as a large business group (or family group). The large business group is that the same person controlled, in effect, business contents of more than two corporate. These firms of large business group are able to gain access to inside information and share resources within the business group (Chang, 2003; Chang et al. 2006). Also, the firms of large business group, which are bound together by formal and informal ties, tend to share resources and coordinate business activities (Granovetter, 1994; Khanna and Rivkin, 2001). So business groups serve as internal capital markets (Leff, 1978; Khanna and Palepu, 1997). In the internal capital market, the firms of large business group can use resources of financial factor under the control of other group members as well as its own financial resources. By sharing and transferring resources of financial, firms of large business group can invest more than what they can afford (Hoshi et al. 1991). Especially, the Korean firms of large business group are sensitive to the cash flows of other group members, rather than to its own cash flow (Shin and Park, 1999). In transferring financial resources among the large business group firms, those with excess cash flows are likely to be providers and those with excess cash flows are likely to be providers and those facing liquidity constraints are likely to be recipients (Scharfstein and Stein, 2000). Therefore, for firms with high levels of financial slack, business group ownership encourages the focal firm to save higher portions of financial slack for other members. The focal firm is less capable of converting financial slack into R&D expenditures. In the hierarchical regression analysis presented Table 7. We entered our moderator variable that is large business group (GROUP) in successive models. In terms of the interactions between the proxies for cash holdings (CASH) and large business group (GORUP), the estimate coefficients are insignificant. We do not find evidence that large business group (GROUP) moderates the strength of the cash holdings-R&D expenditures relationship. But other control variable is the same with result of Table 4.
According to the early work of agency theory, Jensen and Meckling (1976) argued that there are the interest conflicts between owners and managers. Managers in agency theory are likely to seek private interest in contrast to owners’ interest. As insider ownership increases, agency costs may be reduced since managers bear a larger share of these costs. This is Type I conflicts. By contrast, Type II conflicts are more severe in such firms: the majority shareholder may use its controlling position in the firm to extract private benefits at the expense of minority shareholders. Which of these controversial roles of controlling shareholders is more detrimental to firm value is an empirical question that few studies have attempted to
answer (Claessens et al. 2002; Lins, 2003; Cronqvist and Nilsson, 2003). As Demsetz (1983) and Fama and Jensen (1983) insist that managers holding a substantial portion of a firm’s equity may have enough voting power to ensure that their position inside the company is secure. As a result, they may become to a great extent insulated from external disciplining forces such as the takeover threat or the managerial labor market (Farinha, 2003). So managers are likely to use financial slack for their interest and they did not transfer financial slack to the R&D expenditures. This results show that Table 8. We don’t find moderating effect of the share of manager. Therefore, for subgroup analysis, observations of the facilitator were divided into two groups with a median value being employed as a dividing point. In each group, Spearman correlation analysis was performed. The correlations between cash holdings and R&D expenditures are represented in Table 9.
Table 7. Hierarchical regression analysis for examination of the effect of large business group on cash holdings and R&D expenditures
t i t i t i t i t i t i t i t i t i t i t i t i TANGI ROA LEV SIZE SALE MB GROUP CASH GROUP CASH RD , , 9 , 8 , 7 , 6 , 5 , 4 , 1 , 3 , 2 1 , 1 0 ,
Variables Pred. sign Step 1 Step 2 Step 3
Intercept 0.003 -0.011 -0.011
CASH + 0.101 *** 0.099 *** 0.098 ***
GROUP ? -0.078 ** -0.080 **
CASH*GROUP - 0.003
MB + 0.177 *** 0.186 *** 0.186 ***
SALES + -0.057 ** -0.059 ** -0.059 **
SIZE + 0.044 * 0.092 *** 0.092 ***
LEV - -0.166 *** -0.168 *** -0.168 ***
ROA + -0.016 -0.016 -0.017
TANGI + 0.034 0.034 0.034
Adj. R2 0.031 0.034 0.033
N. of Obs. 1,675 1,675 1,675
F value 8.644 *** 8.380 *** 7.445 ***
*p < 0.1, **P < 0.05, ***p < 0.01
Notes: RD: R&D intensity (R&D expenditure/sales); CASH: Cash holdings (quick assets (cash and marketable securities)/total assets); GROUP : 1 if a firm belongs to large business group (o.w. zero); MB: Future investment opportunities ((total liability + market capital)/total assets); SALES: Growth rate of sales ((salest-salest-1)/salest-1); SIZE: Firm size (ln(total assets)); LEV: Leverage ratio (total debt/total assets); ROA: Return on assets(reported earnings/total assets) ; TANGI: Tangible assets investments((tangible assetst-tangible assetst-1+depreciation costt)/total assetst)
Table 8. Hierarchical regression analysis for examination of the effect of the share of manager on cash holdings and R&D expenditures
t i t i t i t i t i t i t i t i t i t i t i t i TANGI ROA LEV SIZE SALE MB MANAGE CASH MANAGE CASH RD , , 9 , 8 , 7 , 6 , 5 , 4 , 1 , 3 , 2 1 , 1 0 ,
Variables Pred. sign Step 1 Step 2 Step 3
Intercept 0.003 0.000 0.000
CASH + 0.101 *** 0.101 *** 0.092 ***
MANAGE + 0.036 0.017
CASH*MANAGE - 0.030
MB + 0.177 *** 0.179 *** 0.178 ***
SALES + -0.057 ** -0.056 ** -0.056 **
SIZE + 0.044 * 0.053 ** 0.052 **
LEV - -0.166 *** -0.166 *** -0.165 ***
ROA + -0.016 -0.018 -0.019
TANGI + 0.034 0.035 0.036
Adj. R2 0.031 0.032 0.031
N. of Obs. 1,675 1,675 1,675
F value 8.644 *** 7.825 *** 7.045 ***
*p < 0.1, **P < 0.05, ***p < 0.01
Notes: RD: R&D intensity (R&D expenditure/sales); CASH: Cash holdings (quick assets (cash and marketable securities)/total assets); MANAGE: The share of manager; MB: Future investment opportunities ((total liability + market capital)/total assets); SALES: Growth rate of sales ((salest-sales t-1)/salest-1); SIZE: Firm size (ln(total assets)); LEV: Leverage ratio (total debt/total assets); ROA: Return on assets(reported earnings/total assets) ; TANGI: Tangible assets investments((tangible assetst -tangible assetst-1+depreciation costt)/total assetst)
Table 9. Subgroup analysis about the share of manager
High MANAGE Low MANAGE
Fisher’s Z RD
CASH 0.111 *** 0.103 *** 0.082
*p < 0.1, **P < 0.05, ***p < 0.01
Notes: RD : R&D intensity (R&D expenditure/sales); CASH : Cash holdings (quick assets (cash and marketable securities)/total assets); MANAGE : The share of manager
In Table 9, correlation coefficients were compared between groups. Whether the difference in correlation coefficients between groups is significant or not cannot be decided by simple comparison. Fisher’s Z statistics can be used to determine the significance of the difference in correlation coefficients between groups. The value of standard Z of in terms
of institutional ownership (INSTI) was 0.082. Therefore, the share of managers doesn’t have moderating effect between R&D expenditures and cash holdings.
5. Conclusion
Prior studies have examined that how the internal and external funds and liquidity of company affect R&D expenditures and how the ownership mechanisms affect decision makings about investment. However, researchers argue whether the ownership structures indirectly affect the R&D expenditures-the resource of internal funds relationship.
In this paper, we examine how the cash holdings have an impact on R&D expenditures and whether the ownership mechanisms moderate the R&D expenditures-the resource of internal funds relationship.
We drew our sample firms that were listed on the Korea Stock Exchange (KSE) and collected data for the years 2005 to 2010. We used the KIS-VALUE database to gather financial data. Firms with missing for one or more years during the study period were excluded, resulting in 1,675 firms (year) for which all information was collected.
The result showed that cash holdings have a positively relationship with R&D expenditures. Specially, we found that institutional ownership had a positive moderating effect of the R&D expenditures-the resource of internal funds relationship. In additional analysis, the large business group and the share of managers doesn’t moderate the relationship between cash holdings and R&D expenditures. These results provide that institutional investor in Korea tend to be long-term oriented, “active” and “sophisticated” investor. They are less likely to evaluate corporate executives on the basis of short-term earnings alone and are more likely to support value-creating.
We have attempted to empirically demonstrate the moderating effect of the relationship between cash holdings and R&D expenditures. Prior studies have no distinguished the moderating effect. Most studies have examined only the relationship between cash holdings and R&D expenditures.
Limitations of our study include our sample consists of firms listed on the Korea Stock Exchange. Therefore, more research is needed to confirm this interpretation of our results. Also, we consider internal cash as a firm resource for R&D expenditures. The level of cash does not offer a complete financing channel of the financial slack of firms. Future research is needed to control the other financing activities, such as equity financing or debt financing status.
References
Baysinger, B.D., Kosnik, R.D., and Turk, T.A., 1991. Effects of board and ownership structure on corporate R&D strategy. Academy of Management Journal, 34 (1), pp.205-214.
Block, J.H. and Thams, A., 2007. Long-term orientation in family firms: a Bayesian analysis. SFB 649 discussion paper.
Bourgeois, L.J., 1981. On the measurement of organizational slack. Academy of Management Review, 6(1), pp.29-39.
Chang, S.J., 2003. Ownership structure, expropriation, and performance of group-affiliated companies in Korea. Academy of Management Journal, 46 (2), pp.238-253.
Chang, S.J., Chung, C.N., and Mahmood, I.P., 2006. When and how does business group affiliation promote firm innovation? A tale of two emerging economies. Organization Science, 17(5), pp.637-656. Choe, H., Kho, B.C., and Stulz, R.M., 1999. Do foreign investors destabilize
stock markets? The Korean experience in 1997. Journal of Financial Economics, 54(2), pp.227-264.
Claessens, S., Djankov, S., Fan, J.P.H., and Lang, L.H.P., 2002. Disentangling the incentive and entrenchment effects of large shareholdings. Journal of Finance, 57(6), pp.2741–2771.
Cronqvist, H. and Nilsson, M., 2003. Agency costs of controlling minority shareholders. Journal of Financial and Quantitative Analysis, 38(4), pp.695-719.
Cyert, R.M. and March, J.G., 1963. A behavioral theory of the firm. Englewood Cliffs, NJ: Prentice Hall.
David, P., Yoshikawa, T., Chari, M.D.R., and Rasheed, A.A., 2006. Strategic investments in Japanese corporations: Do foreign portfolio owners foster underinvestment or appropriate investment? Strategic Management Journal, 27(6), pp.591-600.
Demsetz, H., 1983. The structure of ownership and the theory of the firm. Journal of Law and Economics, 26(2), pp.375-390.
Drucker, P.F., 1986. The changed world economy. Foreign Affairs, 64(4), pp.768-791.
Easterbrook, F.H., 1984. Two agency-cost explanations of dividends. American Economic Review, 74(4), pp.650-659.
Eisenhardt, K.M., 1989. Making fast strategic decisions in high-velocity environments. Academy of Management Journal, 32(3), pp.543-576. Fama, E.F. and Jensen, M.C., 1983. Separation of ownership and control.
Journal of Law and Economics, 26(2), pp.301-325.
Farinha, J., 2003. Dividend policy, corporate governance and the managerial entrenchment hypothesis: An empirical analysis. Journal of Business Finance & Accounting, 30(9-10), pp.1173-1209.
Gillan, S.L. and Starks, L.T., 2003. Corporate governance, corporate ownership, and the role of institutional investors: A global perspective. Journal of Applied Finance, 13(2), pp.4-22.
Granovetter, M., 1994. Business groups. Handbook of Economic Sociology. Princeton, NJ: Princeton University Press.
Graves, S.B., 1988. Institutional ownership and corporate R&D in the computer industry. Academy of Management Journal, 31(2), pp.417-428.
Hansen, G.S. and Hill, C.W.L., 1991. Are institutional investors myopic? A time-series study of four technology-driven industries. Strategic Management Journal, 12(1), pp.1-16.
Hoshi, T., Kashyap, A., and Scharfstein, D., 1991. Corporate structure, liquidity, and investment: Evidence from Japanese industrial groups. Quarterly Journal of Economics, 106(1), pp.33-60.
Hoskisson, R.E., Hitt, M.A., and Jonnson, R.A., 2002. Conflicting voices: The effects of institutional ownership heterogeneity and internal governance on corporate innovation strategies. Academy of Management Journal, 45(4), pp.697-716.
Jarrell, G.A., Lehn, K., and Marr, W., 1985. Institutional ownership, tender offers, and long-term investments. Washington, DC: Office of the chief economist, Securities Exchange Commission.
Jensen, M.C., 1989. Eclipse of the public corporation. Harvard Business Review, 67(5), pp.61-74.
Jensen, M.C. and Meckling, W.H., 1976. Theory of the firm: Managerial behavior, agency costs and ownership structure. Journal of Financial Economics, 3(4), pp.305-360.
Joh, S.W., 2003. Corporate governance and firm profitability: Evidence from Korea before the economic crisis. Journal of Financial Economics, 68(2), pp.287-322.
Khanna. T. and Palepu, K., 1997. Why focused strategies may be wrong for emerging markets. Harvard Business Review, 75(4), pp.41-51. Khanna, T. and Rivkin, J.W., 2001. Estimating the performance effects of
business groups in emerging markets. Strategic Management Journal, 22(1), pp.45-74.
Kim, H., Kim, H., and Lee, P.M., 2008. Ownership structure and the relationship between financial slack and R&D investments: Evidence from Korean firms. Organization Science, 19(2), pp.404-418.
Kochhar, R. and David, P., 1996. Institutional investors and firm innovation: A test of competing hypotheses. Strategic Management Journal, 17(1), pp.73-84.
La Porta, R., Lopez-de-Silanes, F., Shleifer, A. and Vishny, R., 2000. Investor protection and corporate governance. Journal of Financial Economics, 58(1-2), pp.3-27.
La Porta, R., Lopez-de-Silanes, F., and Shleifer, A., 2002. Government ownership of banks. Journal of Finance, 57(1), pp.265-301..
Le, S.A., Walters, B., and Kroll, M., 2006. The moderating effects of external monitors on the relationship between R&D spending and firm performance. Journal of Business Research, 59(2), pp.278-287. Lee, D.L. and Kim, M. H., 2000. A study on the Influence of R&D Expenditure on Film's Growth Rate: Focusing on KOSDAQ market. Journal of Taxation and Accounting, 3(1), pp.5-31.
Lee, P.M. and O’Neill. H.M., 2003. Ownership structures and R&D investments of U.S. and Japanese firms: Agency and stewardship perspectives. Academy of Management Journal, 46(2), pp.212-225.
Leff, N.H., 1978. Industrial organization and entrepreneurship in the developing countries: The economic groups. Economic Development Cultural Change, 26(4), pp.661-675.
Lins, K.V., 2003. Equity ownership and firm value in emerging markets. Journal of Financial and Quantitative Analysis, 38(1), pp.159-184. Lucas, R.E., 1988. On the mechanics of economic development. Journal of
Monetary Economics, 22(1), pp.3-42.
Mitroff, I.I., 1987. Business not as usual. San Francisco, CA: Jossey-Bass. Nohria, N. and Gulati, R., 1996. Is slack good or bad for innovation?
Academy of Management Journal, 39(5), pp.1245-1264.
Perry, S. and Grinaker, R., 1994. Earnings expectations and discretionary research and development spending. Accounting Horizons, 8(4), pp.43-51.
Romer, P.M., 1990. Endogenous technological change. Journal of Political Economy, 98(5), pp.S71-S102.
Scharfstein, D.S. and Stein, J.C., 2000. The dark side of internal capital markets: Divisional rent-seeking and inefficient investment. Journal of Finance, 55(6), pp.2537-2564.
Scherer, F.M., 1986. Innovation and growth: Schumpeterian perspectives. Cambridge: MIT Press.
Sharma, S., Durand, R.M., and Gur-Arie, O., 1981. Identification and analysis of moderator variables. Journal of Marketing Research, 18(3), pp.291-300.
Sharfman, M.P., Wolf, G., Chase, R.B., and Tansik, D.A., 1988. Antecedents of organizational slack. Academy of Management Review, 13(4), pp.601-614.
Shefrin, H.M. and Statman, M., 1984. Explaining investor preference for cash dividends. Journal of Financial Economy, 13(2), pp.253-282. Shin, H. and Park, Y., 1999. Financing constraints and internal capital
markets: Evidence from Korean chaebols. Journal of Corporate Finance, 5(2), pp.169-191.
Singh, J.V., 1986. Performance, slack, and risk taking in organizational decision making. Academy of Management Journal, 29(3), pp.562-585.
Williamson, D.H. and Mellanby, J., 1963. Methods of enzymatic analysis. Bergmeyer, HU. New York: Academic Press Inc.
Williamson, O.E., 1975. Markets and hierarchies: Analysis and antitrust implications. New York: Free Press.
Zajac E.J. and Bazerman, M.H., 1991. Blind spots in industry and competitor analysis: Implications of interfirm (Mis) perceptions for strategic decisions. Academy of Management Review, 16(1), pp.37-56.