I. INTRODUCTION
The development of the Internet as well as ubiquitous access to easy-to-use penetration testing tools combined with anonymity in the net, results in a situation where every machine exposed to the Internet is sooner or later going to be attacked. If the corporate network is well managed and secured, most of the attack attempts are unsuccessful but this is not always the case. Modern IT systems act almost like living creatures: new modules are used, patches are applied, configuration is changed, new users are added, etc. This results in the situation when a perfectly secure system, if managed improperly, suddenly becomes vulnerable and a random cracker can exploit this opportunity to gain access to the corporate network.
To deal with that problem, Intrusion Detection Systems are used more and more often – an additional security layer which can help with the intrusion investigation process (so called digital forensics).
A system administrator is supposed to constantly monitor running services; in most cases this comes down to log analysis (for example, for an HTTP server, ftp, firewall, etc.). The problem with the log review is that logs are stored in separate files and located all over the hard drive. This complicates the task and makes log-information correlation even more difficult. Besides, it is very time consuming and requires thorough knowledge of different
attacks to be able to filter out the important information from/out of the rest. Intrusion Detection Systems can help the administrator with that task: constant automatic monitoring system with centralized database containing information in a unified format is a great improvement itself. What is even more helpful, an IDS system itself analyzes logs and discovers security incidents.
A standard host-based Intrusion Detection System works on a single machine and therefore is unable to detect more sophisticated attacks which were performed using many machines located in different parts of the corporate network. For example, an IDS installed on the Samba server will not be able to raise an alarm when the following attack is performed:
1.HTTP Server port scanning.
2.Samba Server port scanning (from the HTTP Server). 3.A successful login to the Samba server from the HTTP
Server.
Port scanning is an activity which may be considered malicious, but not necessarily implicates a successful break in if we consider every port scanning event as a high alarm, we would end up with a lot of false positives. A successful login to a Samba server is not suspicious at all, but if we add up those two events, the real situation will appear and it can be quite important to notice that.
The present article describes the Distributed Intrusion Detection System “MetaIDS” [1] developed within the
Distributed Intrusion Detection Systems
– MetalDS case study
Marcin Jerzak,Mariusz Wojtysiak
Poznań Supercomputing and Networking Center, ul. Noskowskiego 12/14, 61-704 Poznań, Poland e-mail: [email protected]
(Received: 27 September 2010; revised: 8 November 2010; published online: 23 November 2010)
Abstract: The “Defence in depth” strategy for securing computer systems claims that technologies used to protect a network should fulfill the “Protect, Detect and React” paradigm. “This means that in addition to incorporating protection mechanisms, organizations need to expect attacks and include attack detection tools” [1]. This paper presents MetaIDS – the Intrusion Detection System developed in Poznań Supercomputing and Networking Center. It detects both attack attempts and successful attacks to the system. The paper highlights typical problems with intrusions detection, principle of the MetaIDS work and real attack example seen from the perspective of MetaIDS.
Polish Platform for Homeland Security (PPHS) (2) in Poznań Supercomputing and Networking Center. PPHS brings together universities, research centers, companies and institutions promoting public safety in order to create advanced, integrated tools supporting work of law enforcement body and administration of justice.
MetaIDS is able to detect intrusions and intrusion attempts based on information from many resources all over the corporate network. The system has a modular architecture: if there is a need to add a new information source (for example, a new log source), an administra-tor/developer can implement the new module and just plug it in. The system consists of two basic components: the MetaIDS Server and the MetaIDS Sensor. Sensors are lightweight, stateless applications that are running on an unprivileged account on monitored machines. Sensors collect data and communicate with Server periodically in order to send specified information as well as check for updates, etc. The MetaIDS Server gathers information from every sensor, located all around the network, analyzes it and makes appropriate decisions. All computationally heavy operations are performed on the MetaIDS Server. It requires that the server is run on an efficient machine, but causes that agents running on monitored systems do not lower their availability and performance. A modular architecture design has been applied to both Server and Sensor. Therefore, new modules or new signatures can be developed and imported into the system without significant effort.
In this article we will attempt to explain the basic functionality of our system, starting with the MetaIDS Sensor. Every module has been described separately in the order determined by a logical path of data flow within the monitored infrastructure. The following chapters, for example, describe monitoring, parsing and filtering parts of the system – those modules are invoked in this particular order during the intrusion discovery process. This is the exact path that each separate small event has to pass before it is processed by the MetaIDS Server correlation engine, where all the data are aggregated and normalized.
II. MetalDS COMPONENTS II.1. Sensor
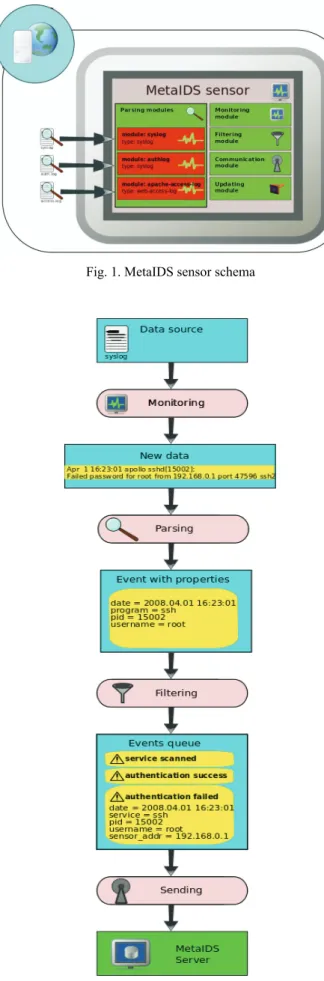
The MetaIDS sensor is a program working on a secured computer in the background. The sensor monitors the security state of that computer and sends information about suspicious events to the MetaIDS server .
The sensor consists of the modules shown in Fig. 1. Monitoring, parsing, filtering and communication modules work in a pipeline by passing results of their work
Fig. 1. MetaIDS sensor schema
to the next module. This pipeline is shown in Fig. 2. Sensor modules working in a pipeline and each phase of work are described below.
II.2. Monitoring module
The monitoring module periodically checks the secured service to find information about new events in the system. Detected events are sent to the parsing module.
The monitoring module works on a data source, from which it reads information related with security. The most common data source is the log file of the monitored service. But there may also exist other data sources like Windows Event Log, or just a device. In such case the module monitors directly the device and detects events unassisted. For example, the module may automatically detect new Wi-Fi networks, to which the monitored computer has been connected.
II.3. Parsing module
The main task of the parsing module is to interpret data from the monitoring module for further processing.
For example, a typical entry in the system log looks like: Mar 11 14:49:59 apollo sshd[6968]: Failed password for root from 192.168.1.1 port 39986 ssh2
and is interpreted by the parsing module in the following way:
date: 2010-03-11 14:49:59 host: apollo
program: sshd pid: 6968
$CONTEXT: Mar 11 14:49:59 apollo sshd[6968]: Failed password for root from 192.168.1.1 port 39986 ssh2
As a result, the parsing module creates in memory an event described by the occurrence date and other attributes containing event details like source address, user name, process identifier etc. In this phase the module is not aware if this event has any impact on security of the monitored system. Therefore, the event has not got its name yet (has not been classified).
Attributes describing the event consist of pairs: name, value (e.g. <program, su>).
The parsing module automatically creates a special attribute called “$CONTEXT”. This attribute contains the unparsed text representing the event. For example, the module parsing the Linux syslog file creates attribute “$CONTEXT” containing one entry from the syslog file. The IDMEF module creates “$CONTEXT” containing the whole XML document representing the event described in the IDMEF format. The “$CONTEXT” attribute allows further to process an event that is not only based on parsed attributes, but also using the unprocessed event description.
The parsing module is strictly associated with the data source format: every type of a log file has its own type of the parsing module. Therefore, one sensor monitoring many log files may contain many parsing modules, depending on the set of services protected by the sensor.
Parsing modules are dynamically configurable. Therefore:
• module parameters for all sensors may be modified in one central point on the MetaIDS server,
• it is possible to modify module parameters without restarting the module or the sensor.
II.4. Filtering module
Not all events detected by previous modules are sent to the MetaIDS server. The filtering module separates events taken out from the data source, choosing only those events which have impact on security.
For example, the following events may be sent to the server:
• unsuccessful login attempt,
• creation of a new user account in the system,
• abnormal program termination.
In turn, the following unimportant events are ignored:
• start of SCSI driver,
• unmount of USB device,
• problems with sound in the system.
Events are filtered basing on filter rules associated with the module. No events are automatically sent to the MetaIDS server. If an event has to be sent to the server, there must exist a proper filter rule which recognizes that event and classify it by assigning a name to that event. Besides assigning a name, the filter rule may also attach additional attributes to the event.
For example, a parsed event containing attributes: date: 2010-03-11 14:49:59
host: apollo program: sshd pid: 6968
$CONTEXT: Mar 11 14:49:59 apollo sshd[6968]: Failed password for root from 192.168.1.1 port 39986 ssh2 after processing by the filtering module, the following attributes may be attached:
name: authentication_failed reason: invalid password
A filter rule contains a condition, deciding if the parsed event should be sent to the MetaIDS server. The condition may test the parsed event attributes using standard operators like =, <, >, <>, <= and => or may scan the unparsed event description (obtained from the $CONTEXT attribute), using regular expressions.
For example:
program = "sshd” AND $CONTEXT match "Failed password for"
The above condition causes sending to the server all events from the sshd process that contain the string “Failed password for”.
Every module has an own set of filter rules.
Rules, similar to parsing modules, are dynamically con-figurable and may be modified without restarting a sensor. II.5. Communication module
All events which have passed the filtering module are moved to the local events queue on the sensor. An independent thread, responsible for the communication with the MetaIDS server, gets events from the queue and sends it to their destination (Fig. 3).
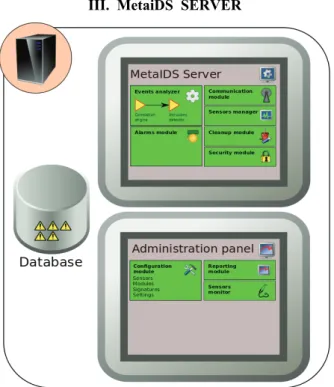
III. MetaiDS SERVER
Fig. 4. MetaIDS server components
The MetaIDS server is a computer dedicated to ana-lyzing events sent by sensors. It consists of three compo-nents: the database, the administration panel (Graphical User Interface for an administrator) and the heart of the system: MetaIDSServer program analyzing events and communicating with sensors (Fig. 4).
III.1. Events analyzer
The most important function of MetaIDS is the analysis of events reported by sensors in order to detect break-in attempts and other security incidents. This analysis is performed by searching for dangerous events sequences. A typical events sequence suggesting that successful break-in attempt might have occurred consists of a se-quence of many failed login attempts. All logins are done from the same IP address. The last login was successful: auth_failed → auth_failed → auth_failed → … → auth_success.
Of course, a legitimate user might also have forgotten her/his password, make many failed login attempts and finally login successfully. However, a real user would make only a couple of login attempts, whereas a “brute-force” attack makes dozens of login attempts in a short time interval.
The events analyzer searches for dangerous events sequences using signatures of known attacks, stored in the database. A signature contains the sequence of event names with conditions which must be fulfilled by the analyzed event in order to be matched to the given signature.
For example, the signature that detects a successful “bruteforce” attack may be similar to:
first_authentication: auth_failed() 5 minutes
auth_failed( src_addr =
first_authentication.src_addr) {9 times 5 minutes} 5 minutes
auth_success( src_addr = first_authentication.src_addr )
The above signature matches with at least ten failed login attempts (event: auth_failed) followed by one successful login (event: auth_success). All matched events have to originate from the same IP address (condition: src_addr = first_authentication.src_addr). The time between two follow-ing matched events cannot be longerthan 5 minutes.
Signatures have to contain the maximum interval between two consecutive events in a sequence. It is signifi-cant because of the following reasons:
• there is low probability that two events between which a long time passed are associated with the same attack. Thus, defining the maximum interval between events helps to reduce the number of false alarms triggered by IDS (false positives),
• events are sent to the server from distributed sensors, not necessarily in the order of their occurrence. Events very often match the signature only partially. For example, 9 events match the signature which expects 10 events. But after a moment the 10-th event may appear and make this sequence complete. That is why the same events have to be analyzed many times, as long as there are chances that any sensor sends an event, which finally will make this “partial” sequence a completely matched one. The maximum interval between events helps to decide how long those partially matched events should be analyzed by the server.
When events completely match the signature, a new event is created, and matched events are marked as correlated with the new event. The new event is assigned a new name and is described by a new set of attributes. For example, 10 failed login attempts followed by a successful login create a new event named “brute-force_success” with attributes: src_addr (the attacker's IP address) and service (the name of the attacked service like “ftp”, “ssh”, etc).
The described functionality of searching events sequen-ces is used for two tasks:
• event correlations – a connection of all events which are results of the same attack,
• detection of break-in attempts and other security incidents.
III.1.1. Correlation engine
Events are sent from a bulk of sensors. A single attack, like scanning of the service in order to find
a vulnerability, may generate hundreds of events. In such case the knowledge about each single event is not important. More significant is information that the scanning was done, the scanned service name, the source IP address and the scanning time.
During the correlation stage, all events which are a consequence of a specified action performed by an intruder are grouped and marked as correlated with a new event describing the attacker's action.
For example, a sequence of requests for nonexistent resources to the Apache HTTP/http server are changed to a “service scanned” event. A sequence of failed login attempts from the same address are changed to a “brute-force” event.
Sometimes events sent by a sensor have an important attribute missing. For example, an event auth_success from a PostgreSQL database does not contain the IP address, from which the login to the database originated. However, the source address is stored in another event originating from PostgreSQL: new_connection. In such case the cor-relation may be used to complete a missing attribute by combining two events: new_connection and auth_success into one event: auth_success.
III.1.2. Intrusion detector
MetaIDS has to inform an administrator about a break-in to her/his system. But how to detect break-break-ins?
As a consequence of the attack, the intruder gets access to the system. MetaIDS must then monitor all authorization operations. The problem is how to differentiate between a successful authorization done by a legitimate user and by the intruder. In most cases during a break-in attempt the intruder performs operations which would rather not be performed by a standard user. For example, the intruder checks what services are running on the system, sends malformed requests to services, tries to guess passwords, etc. If MetaIDS is able to match a successful login with other suspicious actions made during break-in attempts, then the attack will be appropriately detected.
The association between a successful authentication and a suspicious action may be done basing on the source address of those events. For example, a malicious user logs in to the service from the same IP address, from which s/he scanned the service earlier.
However, advanced hackers are aware of the existence of Intrusion Detection Systems. If they have a farm of compromised computers under their control, they are able to send every request from a different IP address, thus making a distributed attack.
In such case the most obvious attribute that might associate events into a sequence – the event source IP address – is useless and MetaIDS has to use other attributes like:
• user name – for example, a distributed attack at one username and a successful login with this username during this attack,
• process identifier – for example a successful login in the process in which the exploit execution was detected.
Both the correlation engine and the intrusion detector work in the same way: they search event sequences based on signatures. The only difference is the importance of generated events: the intrusion detector creates security incidents which should be reported to the administrator, whereas events created by the correlation engine do not have to be noticed by the administrator.
Because of those similarities, both modules were imple-mented using the same mechanism.
III.2. Communication module
The communication module is responsible for com-munication between the MetaIDS server, sensors and the database. The communication is always initiated by the sensor. When the connection between the sensor and the server is established and both sides authenticated each other using the SSL protocol, the server checks if the sensor is registered in the MetaIDS database using the sensor's certificate.
The following requests are supported by the MetaIDS server:
• get all modules and filter rules connected to the given sensor,
• get new/modified modules and filter rules con-nected to the given sensor,
• send new events detected by the sensor,
• send errors occurred during the sensor work. III.3. Sensors manager
This module keeps an eye on assigning proper modules to sensors. Every sensor has been defined a different set of modules, depending on services monitored by the sensor. Additionally, the same module may have a different con-figuration on particular sensors (for example, the same log file may be placed in different directories on computers in the protected network).
The sensor manager is responsible for sending a proper set of modules (together with appropriate parameters) to
the sensor. It is implemented by changing a general defini-tion of the module to the form specified for the given sensor.
III.4. Alarms module
The alarms module goal is to execute a proper action when the intrusion detector detects a new attack. First of all, the alarms module creates a new event in the database in order to store information about the detected incident. In the context of this new event, an administrator may see all details about the attack, s/he can trace elementary steps made by the intruder during the attack, when and how long they took place, etc.
Besides the creation of the new event, it is possible to define other actions like the creation of an e-mail/sms to an administrator, or execution of any external program. Such an action may be assigned to the signature and as soon as events completely match to this signature, assigned actions will be executed automatically.
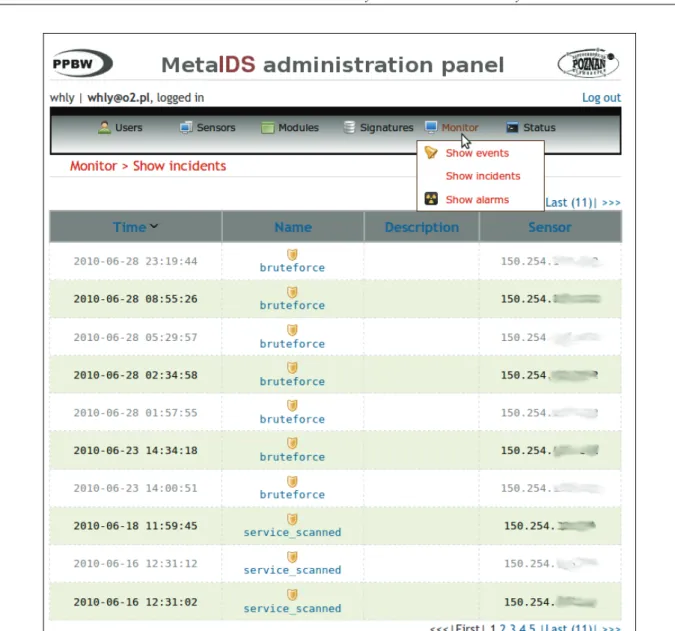
III.5. Administration panel
The administration panel is a Web-based application which plays the role of the MetaIDS graphical user interface (GUI). An administrator executes this application, using a Web browser on any computer having access to the MetaIDS server.
The administration panel consists of the reporting module, the configuration module and the sensors monitor.
The reporting module is the main page which is seen by a user after logging to the administration panel. It contains recently detected security incidents and the sensors list together with the status of each sensor.
In the reporting module the user may see very detailed information about each detected event. It is possible to see all attributes describing the event and the list of events (elementary steps of an attack), which caused the detection of that incident. The incident may be explored on different levels of details, descending (?) to an entry log describing a single event in the system log.
The configuration module, among others, allows to register a sensor in MetaIDS to assign modules to the sensor to modify filter rules and signatures.
The sensors monitor stores in its database all problems reported by sensors and the time of the latest connection of the particular sensor with the server. It helps to figure out the correctness of sensors work.
Fig. 5. MetaIDS administration panel
IV. EXAMPLE OF ATTACK ANALYSIS
In this paragraph a simple attack will be presented together with an analysis how it is detected by MetaIDS. An exemplary network contains a database server with two services available from the Internet: SSH and database engine. Both services are monitored by a MetaIDS sensor. The MetaIDS server is installed on a separate machine. Figure 6 shows the schema of the example network together with requests sent by the intruder's computer and events detected by MetaIDS components.
IV.1. Processing events on a sensor
The network described above was compromised by the intruder. It means that the attacker performed a lot of actions, finished with a successful login to the database and exporting sensitive data. The critical action which makes the system compromised is the correct login to the database system (“login ok” in Fig. 6).
After the execution of that action, the following entry was appended to the database system log file:
Mar 25 10:46:49 database_server postgres[2105]: [3-1] LOG: connection authorized: user=postgres database=Users_salaries host=10.0.0.32
That entry would not generate any interest of a system administrator reviewing that log file. It looks like any other standard login action to the system. However, MetaIDS classifies it as a successful attack and sends an SMS to the administrator. Let us analyze the way data are processed by MetaIDS and what decides that this login action is treated as compromitation of the monitored system.
The monitoring module on the sensor detects a new log entry and passes it to the parsing module which interprets it by creating following attributes:
time: 010-03-25 10:46:49 GMT+1 hostname: database_server
process: postgresql process_id: 2105
CONTEXT: Mar 25 10:46:49 database_server postgres[2105]: [3-1] LOG:
connection authorized: user=postgres database=Users_salaries host=10.0.0.32
In such a form the event is moved to the filtering module which contains a set of rules. One of these rules has the following definition:
<rule>
<name>postgres_auth_success</name>
<description>Successful login to PostgreSQL database</description>
<condition>
program = "postgres"
AND $CONTEXT match "connection authorized:" </condition>
<eventname>auth_success</eventname>
<attributes> <attribute>
<name>username</name> <type>string</type> <regexp>user=([^[:space:]]+)</regexp> </attribute>
<attribute>
<name>service</name> <type>string</type> <value>postgresql</value> </attribute>
<attribute>
<name>session</name> <type>string</type>
<regexp>\[([^\]]+)\]</regexp> </attribute>
<attribute>
<name>src_addr</name> <type>string</type>
<regexp>host=\[?([^[:space:]]+)\]?</regexp> </attribute>
</attributes> </rule>
The analyzed event was signaled for the “postgres” program. Additionally, the unparsed text describing the event (attribute $CONTEXT) contains the “connection authorized:” string. Thus this event matches to the follow-ing rule condition:
program = "postgres" AND $CONTEXT match "connection authorized:"
The filtering module assigns the “auth_success” name to the analyzed event and appends new attributes to it: user-name, service, session, src_addr.
Now the event is ready to be sent to the MetaIDS server:
name: auth_success
time: 2010-03-25 10:46:49 GMT+1 hostname: database_server
process: postgresql process_id: 2105
username: postgresql service: database session: 2105 src_addr: 10.0.0.32
CONTEXT: Mar 25 10:46:49 database_server postgres[2105]: [3-1] LOG: connection authorized: user=postgres database=Users_salaries host=10.0.0.32 The communication module sends the event during its next connection with the MetaIDS server.
IV.2. Processing events on the MetaIDS server
An event sent from a sensor is processed by the com-munication module in order to check if this event is a new one or if it has already been stored in the database. All events signaled by sensors are stored in the MetaIDS server database.
During the described example of an attack, an intruder performs the following actions:
IV.2.1. Services scanning
The attack begins with a network scan: the intruder wants to check version numbers and current configuration of installed services in order to find known vulnerabilities. S/he uses one of many available network scan tools. Such a tool sends a lot of requests to the attacked service. Figure 5 contains two of them: scan probes to ports 22 and 5432.
Both events are detected by the filtering module and as a result the sensor sends “scanned” events to the server. IV.2.2. Bruteforce attack
The intruder found an installed PostgreSQL database system, but s/he could not find a vulnerability which could be directly used to break-in the system. Therefore, the attacker decided to run a typical “bruteforce” attack. The attacker runs a program which attempts to login to the database many times, using a standard username “postgres” and passwords from a dictionary.
This action generates a lot of login request events (“login trial”). Every request is detected by the filter module and the sensor sends a lot of “auth_fail” events to the server.
IV.2.3. Login to the database system
When the password for the standard “postgres” user is found in a dictionary, the bruteforce tool successfully connects to the database system. This request is also recognized by the filter module and the sensor sends an “auth_succ” event to the server.
Events from sensors are stored in a database on the MetaIDS server and are analyzed periodically in the order of their occurrence. The intrusions detector tries to match events from the database to known attack signatures.
For example, events “auth_fail” from the described sce-nario will be matched to the following signature:
failures:auth_fail(src_addr=failures:src_addr AND service=failures:service)
{5 times 5 minutes}
The signature above arranges the sequence of five or more “auth_fail” events originating from the same IPcor-relation_algorytm.c# address and affecting the same service. The maximum time between two consecutive events has been defined as 5 minutes.
As a result, all “auth_fail” events generated during the attack are aggregated to one “bruteforce” event:
eventname: bruteforce
description: Bruteforce attack from one IP address to one service
start_time: 2010-03-25 10:05:49 GMT+1 end_time: 2010-03-25 10:40:49 GMT+1 src_addr: 10.0.0.32
service: ssh
Afterward, the incident detector analyzes events: “brute-force” and “auth_succ” and matches them to the following signature:
brute:bruteforce() 5 minutes
success:auth_succ(src_addr = brute:src_addr) That signature checks if the bruteforce attack originat-ing from one IP address has finished with success.
As a result, a new event is created and stored in the database:
eventname: compromised
start_time: 2010-03-25 10:05:49 GMT+1 end_time: 2010-03-25 10:40:51 GMT+1 src_addr: 10.0.0.32
service: ssh
username: postgres
description: successful bruteforce attack from the same IP. 99% server is compromised!
In that moment a text message containing information about the detected incident is sent to an administrator's cell phone. A successful attack is detected!
The MetaIDS role does not finish here. The above event means that the monitored computer and username “postgres” were compromised. MetaIDS contains signa-tures which especially track actions performed from the compromised machine or using the compromised user-name. Those signatures report to administrator every use of a compromised resource in order to monitor if the com-promitation spreads in the monitored network.
V. COOPERATION WITH OTHER INTRUSION DETECTION SYSTEMS
MetaIDS is able to cooperate with other Intrusion De-tection Systems. Communication may occur in two directions: IDS → MetaIDS and MetaIDS → IDS.
In the first case MetaIDS reads events detected by another IDS, so the other IDS plays the role of a rich sensor.
Such a configuration is especially valuable when MetaIDS cooperates with a network-based IDS, for example Snort IDS [3]. MetaIDS sensors monitor events occurring in services running on servers, so it acts like a host-based IDS. Snort monitors events on a lower level – a network one – so it is able to detect another type of events which are not available for host-based systems. By combining information from host and network sensors, MetaIDS may detect many more attacks.
Communication IDS → MetaIDS is made by a special module monitoring another IDS. This module filters generated events and translates them to the form used in MetaIDS.
Currently MetaIDS may read events reported from:
• Snort IDS
• Ossec IDS [4],
• any other IDS supporting events in IDMEF [5] format – for example, Prelude IDS [6].
The Intrusion Detection Message Exchange Format (IDMEF) [5], described in RFC 4765, is a standard that defines the format in which Intrusion Detection Systems may exchange information about detected incidents. Many IDSs are able to report events in the IDMEF format, some of them are able to read events in that format. MetaIDS also uses the IDMEF format.
Communication in the opposite direction MetaIDS → foreign IDS is also possible. In such case MetaIDS stores detected incidents in a file using the IDMEF format. The foreign IDS may read that file and use it for further analysis. If there is a need to “push” events directly to the foreign IDS (without the intermediate IDMEF file), it is possible to configure a MetaIDS action which will automa-tically send an IDMEF message using an external program.
VI. MetalDS DEPLOYMENT
The first deployment of MetaIDS was made in Poznań Supercomputing and Networking Center.
Two servers hosting HTTP and SSH services were monitored by MetaIDS. Both services were available from the Internet.
During one month, 15 000 events were reported by two sensors. 59 incidents were detected. The majority of them were “bruteforce” attacks and scans of the HTTP server. Additionally, a few test attacks were performed by PSNC Security Team, some of them finished with success (our attacker has got a correct password from the administrator). All attacks were detected by MetaIDS.
A relatively short period of deployment of MetaIDS in a real working environment, resulted with several interesting conclusions. It may be confirmed that it is crucial to constantly improve the system signatures database, especially during the first months of deployment. Due to the heterogeneity of our network, as well as constantly changing system code (some of the applications are considered to be still a work in progress) the main problem were false positives. In order to keep their rate relatively low at the beginning of deployment, a person dedicated to manual resolving of some of the issues is essential. We have encountered several situations with an
application logging some errors to a logfile and causing multiple events to be considered malicious. In the majority of cases the problem was the application itself or an application misconfiguration, but it is actually impossible to predict those situations during the development phaze – therefore, it has to be adjusted during the deployment.
We also had an opportunity to test MetaIDS using log files from a real compromised system. Tests in this case were performed offline on a single log file. This type of analysis can provide additional forensics information about a system that did not have a MetaIDS sensor installed on it during the attack.
The attack scenario was very simple: an intruder injected an SQL query to an HTTP request and stole usernames from the database. Then, using gathered user-names, a lot of “bruteforce” attacks were performed, some of which finished with success. This is a very common way of attacking Web applications, that is mostly performed by automated scripts run from compromised machines.
MetaIDS in that case successfully detected an SQL Injection. Unfortunately, this event was classified by the MetaIDS correlation engine as an incident. We used this case to elevate the severity of this type of incident and to write a new signature, detecting a successfully executed SQL Injection, returning usernames or passwords. The described case shows that, when dealing with constantly changing software and attack techniques, a regular mainte-nance is crucial.
VII. CONCLUSION
Our current experience with MetaIDS working in pro-ductive environments has proved that it fulfills its require-ments: detects incidents, triggers alarms, allows to work temporarily in the offline mode, when a sensor cannot connect to the MetaIDS server. The reporting module helps an administrator to understand the given incident by allowing to go deep into detail on the level of a single log entry.
In a few months' time we expect to perform several consecutive deployments of MetaIDS in networks outside PSNC. Other productive environments will help us to extend modules and the filter rules set used by MetaIDS. Additionally, logs from post-attack investigations perfor-med by PCNS Security Team will be used to test MetaIDS efficiency in attacks detection and to allow to create new signatures.
Advantages of applying MetaIDS should be considered in terms of an additional protecting mechanism as well as
a seful forensics tool. When combined with the existing Intrusion Detection Systems, MetaIDS helps with better attack vector coverage, aggregation and filtration of data. Users may implement signatures dedicated for specific environments, which may help reduce the number of false positives. What is especially important when talking about future improvement of MetaIDS is the possibility of adding new elements included “by design” into almost every module within the system.
References
[1] Agency, National Security. Defense in Depth. A practical strategy for achieving Information Assurance in today’s
highly networked environments. [Online]
http://www.nsa.gov/ia/_files/support/defenseindepth.pdf. [2] Distributed Intrusion Detection System. [Online]
http://ppbw.pcss.pl/en/dids.html.
[3] Polish Platform for Homeland Security. [Online] http://ppbw.pcss.pl/en/.
[4] An open source network intrusion prevention and detection system (IDS/IPS). [Online] http://www.snort.org/.
[5] An Open Source Host-based Intrusion Detection System. [Online] http://www.ossec.net/.
[6] The Intrusion Detection Message Exchange Format. [Online] http://www.ietf.org/rfc/rfc4765.txt.
[7] Agentless, universal, security information management. [Online] http://www.prelude-technologies.com/.
[8] PSNC Securiy Team. [Online] http://security.psnc.pl/en.
MARCIN JERZAK works on several security-related R&D projects in PSNC (Poznań Supercomputing and
Networking Center) Security Team. Currently his leading project is MetaIDS – Distributed Intrusion Detection System. He also helps in protecting the infrastructure of the Polish NREN – PIONIER optical network, POZMAN network and securing PSNC servers and systems. He conducts software security research and penetration tests. Marcin got his M.Sc. degree from Poznan University of Technology in 2007.
MARIUSZ WOJTYSIAK graduaded Poznań University of Technology in 2002 with M.Sc. in Computer
Science. For 5 years were working as developer and project manager for IN-Software company producing software for building firms. Since 2007 he is working in Poznan Supercomputing and Networking Center as developer with projects g-Eclipse (grid technologies) and MetaIDS (security). He also cooperates with other companies as independent software developer and consultant. Mariusz is enthusiast of software engineering technologies allowing to produce high quality, stable and easy to maintenance software.