GeoMap.WA
Version 1.1 — March 2011
GeoMap.WA
user guide
GeoMap.WA user guide 2
Preface:
The information provided is interpretive. The information is made available in good faith and derived from sources believed to be reliable and accurate at the time of release. Every effort has been made to make the information a useful reference. However, you should not rely solely on this information when making a commercial decision.
Note:
Some parts of the document are linked to other sections within the document. These links are represented as underlined blue text. Press Ctrt+Click to follow the link.
Words that you can expect to see on the screen, or in a dialogue box or menu choice, are in square brackets. For example, [Project Properties] is available through the [Project] menu option.
Projects created and saved in GeoVIEWER.WA have a *.gvp file extension. These projects can be opened in GeoMap.WA, but will be saved as GeoMap.WA projects with a *.gmp file extension.
GeoMap.WA user guide 3
Table of Contents
1 INTRODUCTION 5
2 WELCOME TO GEOMAP.WA 6
3 QUICK OVERVIEW 7
4 MENU OPTIONS 8
4.1
[P
ROJECT]
OPTION8
4.2
[V
IEW]
OPTIONS8
4.3
[T
OOLS]
OPTIONS8
4.4
[GPS
T
RACKING]
OPTIONS9
4.5
[H
ELP]
OPTIONS9
4.6
T
OOLBAR BUTTONS10
5 SOFTWARE INSTALLATION 11
5.1
D
OTN
ETFX40.
EXE11
5.2
S
ETUP_
X86.
EXE11
6 GETTING STARTED 12
6.1
P
ROJECT FILE12
6.2
O
PEN AND CLOSEG
EOM
AP.WA
12
6.3
S
TART A NEW PROJECT12
6.4
O
PEN AN EXISTING PROJECT13
6.5
S
AVE A PROJECT15
6.6
A
DDING MAP DATA OR LAYERS15
6.7
G
ETTINGGIS
DATA16
7 LEGEND 17
7.1
A
CTIVE LAYER17
7.2
D
ISPLAY OR HIDE SYMBOLS17
7.3
C
HANGING LAYER PROPERTIES18
7.4
C
HANGE THE DRAWING ORDER27
7.5
R
EMOVING A LAYER FROM THE[L
EGEND]
27
7.6
Z
OOM TO LAYER EXTENTS27
7.7
V
IEW METADATA28
8 [OVERVIEW MAP] 29
8.1
U
PDATEU
SINGC
URRENTV
IEW29
8.2
A
DDA
CTIVEL
AYER30
8.3
S
MOOTH30
8.4
C
LEAR31
8.5
Z
OOMING31
9 MENU AND TOOLBAR OPTIONS 32
9.1
[P
ROJECT]
OPTIONS32
9.2
[V
IEW]
OPTIONS33
9.3
[T
OOLS]
OPTIONS33
9.4
[GPS
T
RACKING]
OPTIONS34
9.5
T
OOLBAR BUTTONS34
GeoMap.WA user guide 4
10 GPS TRACKING 46
10.1
G
ARMINUSB
CONNECTION46
10.2
NMEA
CONNECTION47
10.3
C
ONNECT TOGPS
47
10.4
GPS
TRACKING SETTINGS48
10.5
S
TART/S
TOPS
AVINGT
RACKS48
10.6
T
URN AUTO PAN ON/
OFF49
10.7
D
ISPLAYGPS
I
NFORMATION50
Appendix 1:
C
OORDINATES
YSTEMS51
Appendix 2:
E
XAMPLE OF ADDING DATASETS TO A PROJECT55
Appendix 3:
C
ONTROL OF[L
EGEND]
AND[O
VERVIEW MAP]
63
GeoMap.WA user guide 5
1 Introduction
This user guide describes basic operations of the GeoMap.WA application. A familiarity with the Windows operating system is presumed. No GIS or database experience is required.
GeoMap.WA user guide 6
2 Welcome to GeoMap.WA
GeoMap.WA application is a free, Geographical Information Systems (GIS) viewer for Windows to
view, query and integrate geology and resource information.
GeoMap.WAis supplied with the Geological Survey of Western Australia’s (GSWA) digital data
packages and can also be downloaded from the Department of Mines and Petroleum (DMP) Data and Software Centre website <www.dmp.wa.gov.au/datacentre>.
As opposed to providing data displayed on maps, the user can turn on and off datasets, select a geographical region and view spatial and text data through one easy to use tool.
GeoMap.WAtool provides support for ESRI Shapefile (*.shp) and MapInfo TAB (*.tab) vector data files and *.geotiff, *.ecw and *.jp2 raster image files, on-the-fly map reprojection and GPS connectivity. GeoMap.WA also provides the ability to join user defined database tables related to the GIS layers to perform spatial analysis using users’ linked data.
GeoMap.WA user guide 7
3 Quick overview
See various Sections in the User Manual for detail descriptions.
Figure 1. The parts of the GeoMap.WA screen
Toolbar Menu options
Map panel — your current map is displayed in this area The [Legend] controls the way
the layers of your map are displayed. See Legend for more information
Representative Fraction (RF) scale of the current view The [Overview Map] lets you
select areas of your main map quickly. Overview Map for more information
Coordinates of the cursor’s current position
Scale bar Coordinate system type and name
GeoMap.WA user guide 8 Open a recent project
Start a new project
Set project properties
Exit GeoMap.WA.
4 Menu options
Use the links to various Sections in the User Manual for detail descriptions.
4.1 [Project] option
Figure 2. [Project] menu options
4.2 [View] options
Figure 3. [View] options
4.3 [Tools] options
The options listed in the [Tools] menu are also available as Toolbar buttons, and work in exactly the same way. For more information on the way the [Tools] options work, see the equivalent icons in the quick reference Toolbar buttons or in the more detailed Toolbar buttons.
Figure 4. [Tools] options
Save your project Open a saved project
GeoMap.WA user guide 9
4.4 [GPS Tracking] options
See GPS Tracking for more information.
Figure 5. [GPS Tracking] options
4.5 [Help] options
Figure 6. [Help] options
Figure 7. Dialogue box with version and copyright information, and button to open the [Licence Agreement].
Open GeoMap.WA User guide
Open the information window (Fig. 7), from which you can open the [Licence Agreement]
GeoMap.WA user guide
4.6 Toolbar buttons
Figure 8. The GeoMap.WA toolbar
Start a new project
Open a saved project Save changes
Add data layer(s) to the current project
Use Pan to reposition the map in the map panel by holding down the left mouse button and dragging the map into position
Use Pan to coordinates to a dialogue box
Zoom in, you can also zoom in by using the scroll wheel on your mouse
Zoom out, you can also zoom out by using the scroll wheel on your mouse
Zoom to previous extents returns to last view
Use Zoom to visible layers that are ticked in the Use Zoom to full extents
those that are turned off
Use Identify to display
feature will be on the active layer of the map, but other layers can also be selected Set up a Data Query
specify
Measure distance or area and perimeter between selected points
Search for GSWA products that are relevant to a PRODUCT layer is in the
Print the map as it is currently displayed in the map panel See Toolbar buttons
toolbar
saved project
to the current project
Pan to reposition the map in the map panel by holding down the left mouse button and dragging the map into position
Pan to coordinates to reposition the map in the map panel by typing coordinates into
ou can also zoom in by using the scroll wheel on your mouse
ou can also zoom out by using the scroll wheel on your mouse
to previous extents returns to last view
Zoom to visible layers to display the full extent of all currently visible that are ticked in the [Legend])
Zoom to full extents to display the full extent of all layers in the [Legend]
those that are turned off (not ticked)
to display information about a selected feature. By default the selected feature will be on the active layer of the map, but other layers can also be selected
uery to find and display information about features that meet criteria you
distance or area and perimeter between selected points
products that are relevant to an area selected. Only enabled when a PRODUCT layer is in the [Legend]
the map as it is currently displayed in the map panel Toolbar buttons for more detailed information.
10 Pan to reposition the map in the map panel by holding down the left mouse button
the map in the map panel by typing coordinates into
ou can also zoom in by using the scroll wheel on your mouse
ou can also zoom out by using the scroll wheel on your mouse
currently visible layers (those
[Legend], including
about a selected feature. By default the selected feature will be on the active layer of the map, but other layers can also be selected
to find and display information about features that meet criteria you
GeoMap.WA user guide 11
5 Software installation
Note: GeoMap.WA installation package is provided as either a 32 or 64 bit version. You will need to know how your PC operating system is configured (32 or 64 bit).
The easiest way to install the software is via a GSWA digital data package. To start the install, click on [GeoMap.WA] in the left hand navigation frame, under [Install software] (Fig. 9).
Alternatively, download the install package from Data and Download Centre
<www.dmp.wa.gov.au/datacentre>. The software installation package must be extracted from the ZIP file before commencing installation. Extract the contents to a location on your local hard drive.
Browse to that location and read the README.TXT file. Then run (double-click) the setup executable file (setup_x86.exe).
Figure 9. Install GeoMap.WA from a GSWA digital data package
5.1 DotNetFX40.exe
The Microsoft .NET Framework is a software framework for Microsoft Windows operating systems. The Microsoft .NET Framework 4 installer package installs the .NET Framework components required to run on the PC.
The software install will detect if this needs to be installed, and, if necessary, automatically install the framework. This is a standard Microsoft install and may take several minutes.
5.2 Setup_x86.exe
This will install GeoMap.WA.GeoMap.WA user guide
6 Getting started
6.1 Project file
Project specific information is stored in a project file (*.
The purpose of the project file is to allow a user to save a specif different layers, images, labels, colours
keep a record of these and other settings have a name in the format projectname.gmp shapefiles (*.shp).
6.2 Open and close
GeoMap.WA
To open GeoMap.WA select the program from your
Figure 10. GeoMap.WA location via Start and Programs menu
To open a specific project file, use Windows Explorer to navigate to a .gmp file, and then double on the file name. This will open the last saved view of the selected .gmp project file.
To close GeoMap.WA use either:
• the [Exit] button, located under the • click in the upper-right corner of the Using any other method to close your
If changes have been made to the project file, save any changes or [No] if you do not wish to save
6.3 Start a New Project
To create a New Project, which you can add data.
Select [Project Properties] from the [Project] menu. In the [Project Properties] dialogue box (Fig. 11), replace [New Project] with a name for your project.
roject specific information is stored in a project file (*.gmp).
The purpose of the project file is to allow a user to save a specific view of the data including the different layers, images, labels, colours, and styles that have been set for viewing. This
keep a record of these and other settings for the next time you open this project. A
projectname.gmp, and should be stored separately from the data files
GeoMap.WA
elect the program from your computer’s [Start] > [Programs list
location via Start and Programs menu
use Windows Explorer to navigate to a .gmp file, and then double on the file name. This will open the last saved view of the selected .gmp project file.
ither:
located under the [File] menu
right corner of the GeoMap.WA window.
Using any other method to close your GeoMap.WA session could result in loss of information. If changes have been made to the project file, GeoMap.WA will prompt you to Save.
if you do not wish to save these changes.
roject, start up GeoMap.WA. This will start with a new, empty
Select [Project Properties] from the [Project] menu. In the [Project Properties] dialogue box (Fig. 11), replace [New Project] with a name for your project.
12 ic view of the data including the and styles that have been set for viewing. This project will
A project file will from the data files e.g.
rograms list] (Fig 10).
use Windows Explorer to navigate to a .gmp file, and then double-click on the file name. This will open the last saved view of the selected .gmp project file.
session could result in loss of information. will prompt you to Save. Click [Yes] to
w, empty project to
GeoMap.WA user guide
Choose a [Coordinate System Type] for your project. I
choose a coordinate system that is compatible with the images, because otherwise they cannot be added to the project.
Click the cursor in the [Coordinate System Type] line and then click the down arrow
options. Choose the [Coordinate System Type] and then click the [Coordinate System Name] line to display the down arrow ▼. Click the arrow to display the options and select
appropriate for your project.
NOTE: If you do not set the coordinate
coordinate system of the first dataset you add will be adopted as the coordinate system for the entire project.
For more information about coordinate systems and projectio
Figure 11. Use [Project Properties] to name your new project and choose a [
6.4 Open an existing project
Click the [Open Project] toolbar button to open or *.gvp extension to the file name
Alternatively, select [Project] from the menu bar, and then choose either [Open Project] to open an existing GeoMap.WA project (*.gmp)
of one of the four most recently opened your directory and then [Open] it (Fig.
Type] for your project. If you are going to add images (raster data), choose a coordinate system that is compatible with the images, because otherwise they cannot be
Click the cursor in the [Coordinate System Type] line and then click the down arrow
options. Choose the [Coordinate System Type] and then click the [Coordinate System Name] line to . Click the arrow to display the options and select a coordinate system most
oordinate system before adding datasets to your new project, the coordinate system of the first dataset you add will be adopted as the coordinate system for the entire
For more information about coordinate systems and projections, see Appendix 1 Coordinate Systems
Figure 11. Use [Project Properties] to name your new project and choose a [Coordinate System
Open an existing project
toolbar button to open a saved project, which will have either a .gvp extension to the file name.
Alternatively, select [Project] from the menu bar, and then choose either [Open Project] to open an .gmp) or the older GeoVIEWER.WA project (*.gvp), or s
ly opened projects (Fig. 12). You will need to browse to the project file in it (Fig. 13).
13 f you are going to add images (raster data), choose a coordinate system that is compatible with the images, because otherwise they cannot be
Click the cursor in the [Coordinate System Type] line and then click the down arrow ▼to display the options. Choose the [Coordinate System Type] and then click the [Coordinate System Name] line to a coordinate system most
before adding datasets to your new project, the coordinate system of the first dataset you add will be adopted as the coordinate system for the entire
Appendix 1 Coordinate Systems.
Coordinate System]
, which will have either a *.gmp
Alternatively, select [Project] from the menu bar, and then choose either [Open Project] to open an .gvp), or select the name You will need to browse to the project file in
GeoMap.WA user guide 14 Figure 12. Open an existing project
Figure 13. Browse to and open an existing project (*.gvp or *.gmp file)
A GSWA project file (GSWA.gmp) is provided on all data packages (Fig. 14). To open this project file, start GeoMap.WA, then:
• Click on [Project] • Click on [Open Project]
• Browse to the folder RESOURCES • Select GSWA.gmp and click [OPEN]
Alternatively, use Windows Explorer to navigate to the folder containing GSWA.gmp and double-click on the file name.
Figure 14. GSWA.gmp located in [RESOURCES] folder Select a recent project
GeoMap.WA user guide
6.5 Save a project
While working on a project, it is advisable to save regularly to guard against
project file. When saving a project for the first time, it is necessary to provide a name and location for the project file.
NOTE: A saved project file (*.gmp) does not contain any map data. The project file contains references to map data, as well as other information such as layer symbology.
Click the [Save Project] toolbar button or alternatively, select [Project] from the menu bar, and then choose either [Save Project] or [Save Project As.
prompted to provide a path and filename. Click the [SAVE] button
6.6 Adding map data or layers
There are two main types of data
Raster data are generally imagery, such as aerial or satellite images. as points, lines and polygons (areas). Common data fi
You can add the following supported formats into • ESRI Shapefile (*.shp)
• MapInfo TAB (*.tab) • TIFF/*.geotiff (*.tif) • ECW (*.ecw) • JPEG 2000 (*.jp2) • JPEG (*.jpg)
Click the [Add Data] toolbar button or alternatively, select [Tools] from the menu bar, and then choose [Add Data] to add a dataset. Browse to a spatial dataset, and click
Layers are added in the following order: points, lines, polygons
Figure 15. Selecting a shapefile to load If a vector dataset does not include
will be prompted with a message like the one in Figure 16. The available choices will be dropdown lists and tick boxes.
project, it is advisable to save regularly to guard against corrupting or losing the When saving a project for the first time, it is necessary to provide a name and location for
.gmp) does not contain any map data. The project file contains references to map data, as well as other information such as layer symbology.
toolbar button or alternatively, select [Project] from the menu bar, and then choose either [Save Project] or [Save Project As...] to saved a project
prompted to provide a path and filename. Click the [SAVE] button.
ayers
There are two main types of data which can be displayed in GeoMap.WA — Raster and Vector generally imagery, such as aerial or satellite images. Vector data
as points, lines and polygons (areas). Common data files types include *.shp or *.tab You can add the following supported formats into GeoMap.WA project.
Click the [Add Data] toolbar button or alternatively, select [Tools] from the menu bar, and then choose [Add Data] to add a dataset. Browse to a spatial dataset, and click
Layers are added in the following order: points, lines, polygons, and raster images.
Figure 15. Selecting a shapefile to load
include coordinate system information that GeoMap.WA will be prompted with a message like the one in Figure 16. The available choices will be
15 corrupting or losing the When saving a project for the first time, it is necessary to provide a name and location for
.gmp) does not contain any map data. The project file contains references to map data, as well as other information such as layer symbology.
toolbar button or alternatively, select [Project] from the menu bar, and project file. You will be
Raster and Vector data. Vector data represent features
*.tab file formats.
Click the [Add Data] toolbar button or alternatively, select [Tools] from the menu bar, and then choose [Add Data] to add a dataset. Browse to a spatial dataset, and click [Open] (Fig. 15).
, and raster images.
GeoMap.WA can interpret, you will be prompted with a message like the one in Figure 16. The available choices will be provided in
GeoMap.WA user guide 16 Figure 16. Specify the coordinate system for a dataset that has none
In addition to choosing a [Coordinate Type] and [Name], you can choose one of the following three options to deal with datasets with missing coordinate information:
1. Tick [Apply above settings to all layers with missing coordinate information]. If you choose this option all datasets will be added without further prompting.
2. Tick [Ignore all layers with missing coordinate information]. If you choose this option, datasets with missing coordinate information will not be added to the map.
3. Tick neither, in which case you will be prompted to specify the [Coordinate Type] and [Name] for every dataset in the project that doesn’t have coordinate system information. This could be very time consuming.
If you try to add a dataset with a coordinate system that is different from that of the project, you will be informed and prompted.
NOTE: Raster datasets cannot be reprojected.
See Appendix 1 Coordinate Systems for more information on coordinate systems and projections. See Appendix 2 Example of adding datasets to a project for an example with detailed instructions for adding datasets.
6.7 Getting GIS data
DMP provide a range of geology and resource-based datasets that can be freely downloaded from the Data and Software Centre <www.dmp.wa.gov.au/datacentre>, including:
• 1:500 000 geology
• Mines and mineral occurrence (MINEDEX) • Tenements
• Index to exploration activity (EXACT) • 1:250 000 geological mosaic
• 1:250 000 topographic mosaic
You can also use GeoVIEW.WA (also on the DMP website) to extract and download datasets that can be added to GeoMap.WA projects.
Data and Software Centre and GeoView.WA downloads are compressed (*.ZIP file) and need to be
extracted and saved before you can add any of the data to your project.
Datasets from sources other than DMP or GSWA can be added to your project, provided they are in one of the supported formats.
SeeAppendix 2 Example of adding datasets to a projectfor details on how to download data from the Data and Software Centre.
Ticking one of these options will speed up the open-project process
Click arrows to display coordinate type and name options
GeoMap.WA user guide
7 [Legend]
The [Legend] lists the layers in the project, and the order in which they are listed reflects their order which they are drawn on the map
lines, then points.
You can modify the default order of layers by dragging a layer name to a different place in the [Legend] hierarchy.
The [Legend] is your main way of controllin Display or hide layers.
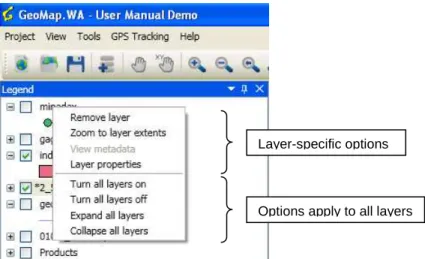
Figure 17. Use the [Legend] to display or hide layers and symbols
Tick the box beside a layer name (Fig. 1 to stop the layer from displaying in [Legend] at once by right clicking and
7.1 Active layer
Only one layer can be the active layer ay any given time.
sure it is visible (ticked), and then click on the layer name. An asterisk layer name (Fig. 17).
The active layer is significant when using active by selecting its name in the
a different layer active, hide the layer in the map panel by removing the tick beside the lay the [Legend].
7.2 Display or hide symbols
Click the beside a layer name in the beside the layer name in the [Legend]You can also display or hide the symbols for all layers at once by selecting [Expand all layers] or [Collapse all layers] (Fig. 18).
Tick shows visible layers. Toggle the tick to display or hide a layer
The active layer is indicated with an *. Select the layer name to make it active.
Click the + or – sign beside a layer name to display or hide the symbols
lists the layers in the project, and the order in which they are listed reflects their order he map — from the bottom up. Firstly raster images, polygons,
the default order of layers by dragging a layer name to a different place in the
is your main way of controlling the appearance of the map in the map panel (Fig. 1
to display or hide layers and symbols
Tick the box beside a layer name (Fig. 17) to make that layer visible in the map panel.
displaying in the map panel. You can also display or hide all the layers in the right clicking and selecting [Turn all layers on] or [Turn all layers off]
e active layer ay any given time. To make a layer the active layer, first make sure it is visible (ticked), and then click on the layer name. An asterisk (*) will appear to the left of the
The active layer is significant when using the identify toolbar button. Make a different visible layer active by selecting its name in the [Legend]. To remove the active status from a layer without making a different layer active, hide the layer in the map panel by removing the tick beside the lay
Display or hide symbols
beside a layer name in the [Legend] to display the symbols for that layer. Click the [Legend] to hide its symbols (Fig. 17).
You can also display or hide the symbols for all layers at once by selecting [Expand all layers] or
17 lists the layers in the project, and the order in which they are listed reflects their order in
polygons, followed by
the default order of layers by dragging a layer name to a different place in the
g the appearance of the map in the map panel (Fig. 17).
) to make that layer visible in the map panel. Untick the box the map panel. You can also display or hide all the layers in the
selecting [Turn all layers on] or [Turn all layers off] (Fig. 18).
To make a layer the active layer, first make will appear to the left of the
toolbar button. Make a different visible layer . To remove the active status from a layer without making a different layer active, hide the layer in the map panel by removing the tick beside the layer name in
to display the symbols for that layer. Click the
GeoMap.WA user guide 18 Figure 18. Right click on a layer name to view options
7.3 Changing layer properties
Double-click or right click a layer name and select [Layer Properties] to open the [Layer Properties] dialogue box.
Layer property settings are different between vector and raster datasets (much more limited for raster datasets)
Figure 19. Change layer name, metadata, and scale range, and view the coordinate system
General tab
The General tab (Fig. 19) in the dialogue box lets you change the:
• [Layer name:] To change the name of a layer, type in a new name.
• [Layer metadata:] Click Browse to find and select the appropriate metadata file. • [Coordinate system:] This information is provided for reference only.
Layer-specific options
GeoMap.WA user guide 19 • [Use scale range] Some layers are not suitable for display at all scales. Select the [Use scale
range] option in the [Scale Range] section.
[Do not show layer when zoomed in beyond scale 1:] Type a value in place of [None], or click to the right of the scale box. The layer will not be displayed in the map panel when the map is zoomed above that scale, and will be greyed-out in the [Legend].
[Do not show layer when zoomed out beyond scale 1:] Type a value in place of [None], or click to the right of the scale box. The layer will not be displayed in the map panel when the map is zoomed below that scale, and will be greyed-out in the [Legend].
Click to replace [None] with the scale at which the map is currently displayed. The current scale is shown in the bottom right-hand corner of the screen (Fig. 1).
[Show layer at all scales] Select this option to display the layer at every scale.
By default the [Use scale range] option is active for all layers until changed, although the scale choices are initially set to [None], which is effectively the same as selecting the [Show layer at all scales] option.
If you have saved a scale for [Do not show layer when zoomed in beyond scale 1:] or for [Do not show layer when zoomed out beyond scale 1:], you cannot change the scale range back to [None]. Remove [Scale Range] restrictions by selecting [Show layer at all scales].
Click either [OK] or [Apply] to save changes to the [Layer name:], [Layer metadata:], or [Scale Range]. ‘Cancel’ Click to restore [Layer name:], [Layer metadata:], or [Scale Range] settings to what they were before the last [OK] or [Apply].
[Symbology tab]
The [Symbology tab] (Fig. 20) in the dialogue box lets you change the layers symbology.
Figure 20. Changing the symbols for a layer
The default setting is [Single symbol]. To display distinct values or features as different symbols, select the [Unique values] option (Fig. 20). If there are too many values for the available colour and symbol variations, you will receive a message like the one below (Fig. 21).
GeoMap.WA user guide 20 Figure 21. Message displayed when there are too many values to be symbolized
Layers with too many values can greatly increase the drawing time for each view that displays that layer, so you might like to save time by turning the layer off for most views of your project.
Figure 22. Select single symbol or unique values, the attribute to symbolize, and the colour palette, and transparency for all symbols
[Single symbol] is the default setting for newly added datasets. To display different symbols for features in a layer, select [Unique values], and then select [Field:], [Colour palette:], and [Transparency] (Fig. 22). Transparency applies to the entire dataset, not to individual features. Settings apply to the whole layer and all the symbols in the layer, and if there are a lot of [Unique Values], the layer might take a long time to display in the map panel. Click [Apply] or [OK] to save the new settings, or [Cancel] to return to the original settings.
To alter the appearance of individual symbols, double-click that symbol in either the [Legend] or in the [Layer Properties] [Symbology] tab to open the [Fill Symbol Properties] dialogue (Figs 23–27).
GeoMap.WA user guide 21 Figure 23. [Fill Symbol Properties] dialogue box: Alter the appearance of symbols
Figure 24. [Fill Symbol Properties] dialogue box: [Style:] choices change the transparency and pattern for the individual symbol
Figure 25. Use the [Colour Selector] to choose a different colour for a symbol
Click to view style choices (Fig. 24)
Click to open colour selector (Fig. 25)
GeoMap.WA user guide 22 Figure 26. Use the [Line Symbol Properties] dialogue box to change line [Style:], [Width:], and [Colour:]
Figure 27. The [Point Symbol Properties] dialogue box
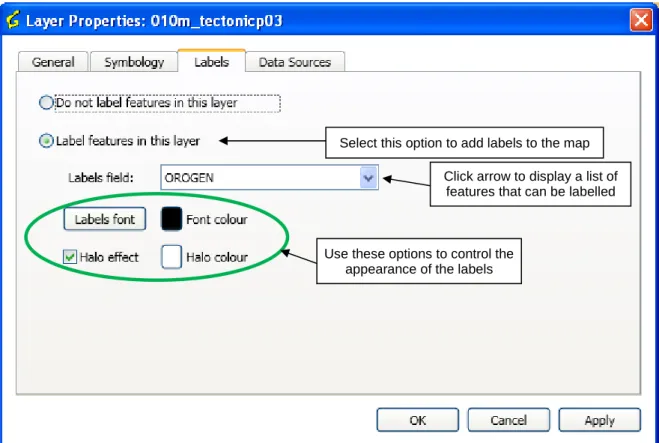
[Labels]
The [Labels] tab (Fig. 28) in the dialogue box lets you change the [Label features in this layer] and use the [Labels field:] to choose the field to be labelled. The values in this field will be used to label features. This dialogue box also allows you to modify the [Labels font] and [Font colour], and choose whether to apply a [Halo effect] and [Halo colour] to labels.
GeoMap.WA user guide 23 Figure 28. Choose which features to label as well as the appearance of the labels on the map
[Data Sources]
The [Data Sources] tab (Fig. 29) in the dialogue box enables you to link your project to external data sources..
Figure 29. Link a layer to other sources of information
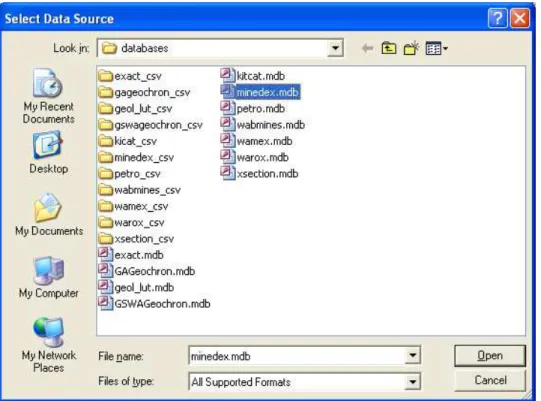
Click [Add] to open the [Select Data Source] window (Fig. 30) and browse to the data source that has the information you want to link to the layer. Double-click on the data source or click [Open].
Select this option to add labels to the map
Click arrow to display a list of features that can be labelled
Use these options to control the appearance of the labels
GeoMap.WA user guide 24 Figure 30. Browse to the data source
In this example, the data source is a Microsoft Access database, but other data sources can be chosen, including spreadsheets and folders.
Figure 31. Choose a table or query in the data source to link to the map layer
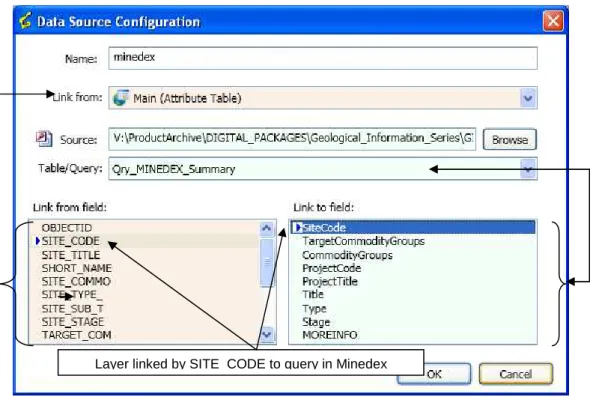
In the [Data Source Configuration] dialogue box, map layer fields, or [Link from:] fields, are coloured pale pink, and fields associated with the linked data [Source:] are pale green (Fig. 31). Choose a table or query from the data source to link to the map layer, and then select matching fields to link the map layer and the data source (Fig. 32).
Data source location
GeoMap.WA user guide 25 Figure 32. Select matching fields in the map layer and the table/query from the data source
When you click [OK] and return to the [Layer Properties] [Data Sources] dialogue boxes, there will be information about the data source and its link to the layer (Fig. 33).
Figure 33. Information about linked data source
You can link a layer to more than one external data source. The example in Figure 34 shows three [Data Sources], all linked to the Products layer in the [Legend]. The first data source is a folder containing PDF documents (*.pdf), the second is a Microsoft Access database, and the third is a Microsoft Excel spreadsheet. The icon to the left of the data source name indicates the type of data source.
Layer linked by SITE_CODE to query in Minedex
Icon indicates the name of the data source and the icon indicates the type of data source
[Qry_MINEDEX_Summary] is a query in MINEDEX. It is linked to the field SITE_CODE in the [Main (Attribute *.table)] of the layer by the field SiteCode
GeoMap.WA user guide
Figure 34. Multiple data sources linked to a single layer The [Edit] function in the [Data Sources] dialogue
layer’s main attribute table and an external data source, or to link two external data sources (Fig. 35).
Figure 35. Two external data sources for one layer, linked on a common field
You can name or rename a data source in the [Data Source Configuration] dialogue simply typing in a different name. However, naming a data source
way results are displayed when using the
Note: SUMMARY is a reserve name used by GSWA and should be avoided.
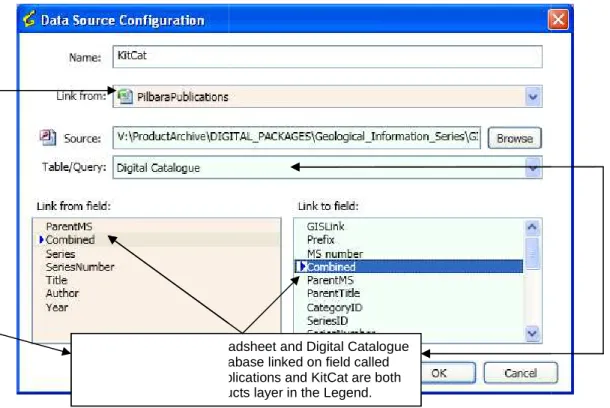
PilbaraPublications spreadsheet and Digital *.table in KitCat da*.tabase linked on field called ‘Combined’. PilbaraPublications and KitCat are both
linked to the Products layer in the Legend. Folder
MS Access MS Excel
Figure 34. Multiple data sources linked to a single layer
] function in the [Data Sources] dialogue box can be used to change the links between the le and an external data source, or to link two external data sources (Fig. 35).
Figure 35. Two external data sources for one layer, linked on a common field
me or rename a data source in the [Data Source Configuration] dialogue
a different name. However, naming a data source SUMMARY has implications for the way results are displayed when using the Identify tool (explained further in Toolbar buttons
is a reserve name used by GSWA and should be avoided.
PilbaraPublications spreadsheet and Digital Catalogue *.table in KitCat da*.tabase linked on field called ‘Combined’. PilbaraPublications and KitCat are both
linked to the Products layer in the Legend. Folder
MS Access MS Excel
26 can be used to change the links between the le and an external data source, or to link two external data sources (Fig. 35).
me or rename a data source in the [Data Source Configuration] dialogue box (Fig. 35) by has implications for the
GeoMap.WA user guide 27 To remove an attached data source from a layer, highlight it in the [Data Sources] tab of the [Layer Properties] dialogue box (Fig. 34), and then use [Delete] to break the link between layer and data source.
7.4 Change the drawing order
The order of layers in the [Legend] also indicates the order that layers are drawn. As the layers are drawn from bottom up, the bottom layer is drawn first, followed by the second last layer, and so on. As a result, is it important to carefully order the map layers so that data is not obscured by layers drawn last, e.g. solid fill polygons and image layers are best placed at the bottom of the [Legend] so that it forms a background for all other overlying layers (i.e. points and lines).
To change the layer order, click and drag the layer to its desired location in the [Legend].
7.5 Removing a layer from the [Legend]
Removing a layer in GeoMap.WA does not remove or delete the underlying data. It merely removes reference to the layer from the current project file.
To remove a layer from a project Right-click on the layer name in the [Legend]. Click on [Remove Layer] from the menu that pops up (Fig. 36)
Figure 36 Remove a layer from the [Legend] using a right click
7.6 [Zoom to layer extents]
Right click the layer and select [Zoom to layer extents] (Fig. 37). [Zoom to layer extents] adjusts the display to show the entire selected layer within the area of the map panel. The three parts of Figure 38 compare the results of selecting [Zoom to layer extents] for different layers with using the button for all visible layers.
Clicking the [Show Extents] tool button adjusts the display to show all the visible layers within the area of the map panel.
GeoMap.WA user guide 28 Figure 37. Fit the whole of the selected layer into the map panel
A. b. c.
Figure 38. Zoom results:
a. Result of [Zoom to layer extents] for Publications layer b. Result of [Zoom to layer extents] for index100 layer
c. Result of using icon to display extent of all currently visible layers of the project map
7.7 View metadata
For layers with previously loaded metadata files, right-click the layer in question and select [View metadata] (Fig. 39) to open the metadata document.
GeoMap.WA user guide 29
8 [Overview map]
The [Overview map] is linked to the main map and shows the extent of the area currently visible in the main map (indicated by a red box). The [Overview map] can be used to control the extent of the main map.
If the [Overview map] panel is not visible, select [Show [Overview map] from the [View] menu (Fig. 3). Place the cursor in the [Overview map] panel (not in the blue title bar) and click the right mouse button to display the [Overview map] context menu (Fig. 40).
Figure 40. Display options for the [Overview map] panel
8.1 [Update Using Current View]
The proportions of the [Overview map] panel are usually different from those of the main map panel, so when you select [Update Using Current View] the [Overview map] will show the extent of the current view within thick red lines (Fig. 41).The area within the red lines will be as large as the proportions of the [Overview map] panel allow.
Figure 41. Result of selecting [Update Using Current View] in the [Overview map] panel.
Area within the red lines is the area of the [Overview Map] currently displayed in the main map panel
GeoMap.WA user guide 30
8.2 [Add active layer]
If you select [Add active layer] the current active layer (marked with an * in the [Legend]) will be superimposed over whatever is already in the [Overview map] panel. In Figure 42, the active layer [*projarea] has been superimposed on the [Overview map] shown in Figure 44. In Figure 44, in the [Overview map] only the active layer is showing.
Figure 42. Active layer superimposed on current view in [Overview map] panel.
8.3 Smooth
Lines in the [Overview map] and main map can be smooth for a better visual appearance. For the [Overview map], select the [Smooth] option by right clicking in the [Overview map] (Fig. 40). The difference can be seen in Figure 43, where part a. is unsmoothed, and part b. is smoothed.
a b.
Figure 43. Comparison of smoothed and unsmoothed [Overview map]s
For smooth lines in the main map, right click in the main map and select [Smooth] from the context menu.
GeoMap.WA user guide 31
8.4 [Clear]
The [Clear] option empties the [Overview map] panel.
Figure 44. [Overview map] shows only the active layer [*projarea]. Red lines on the [Overview map] show the extent of the current view in the main map panel
8.5 Zooming
The [Overview map] provides another way to zoom in and out of the main map. To zoom in, drag the cursor to form a rectangle over the small area of the [Overview map] that you want to display in the main map panel. To zoom out, drag the cursor over a large area of the [Overview map] panel (Fig. 45).
Figure 45. Use the [Overview map] to select and zoom to part of the current map view
Area selected is within the fine red lines. Area covered by the current view is within the thick
red lines. Area within the red lines is
the extent of current view in main map panel
GeoMap.WA user guide
9 Menu and toolbar options
Many of the options in the [Tools] menu (Fig. 49) are also available as buttons on the 52), and work in exactly the same way.
9.1 [Project] options
Figure 46. [Project] menu options
[New Project] (Ctrl+N or ) opens
See Start a new project.
[Open Project] (Ctrl+O or )
project (*.gmp file). See Open an existing project
[Save Project] (Ctrl+S or ) saves the current version of the project without prompting for a project
name or destination.
[Save Project As] ( ) prompts
saving.
[Project Properties] opens the dialogue box shown in Figure 4
change the name of the project, the coordinate
To change the [Project Name], type over the existing name.
To change the [Coordinate System Type], click the row to display an arrow display the list of choices.
To change the [Coordinate System Name], click the row to display an arrow display the list of choices.
Menu and toolbar options
Many of the options in the [Tools] menu (Fig. 49) are also available as buttons on the 52), and work in exactly the same way.
(Ctrl+N or ) opens GeoMap.WA with a blank map, [Legend], and
) brings up a dialogue box that will help you browse to an existing
Open an existing project.
(Ctrl+S or ) saves the current version of the project without prompting for a project
prompts for a different project file name and for a destination folder before
opens the dialogue box shown in Figure 47. In this dialogue box you can change the name of the project, the coordinate system type, and the coordinate system name.
To change the [Project Name], type over the existing name.
To change the [Coordinate System Type], click the row to display an arrow ▼, then click the arrow to
dinate System Name], click the row to display an arrow ▼, then click the arrow to
32 Many of the options in the [Tools] menu (Fig. 49) are also available as buttons on the Toolbar (Fig.
, and [Overview map].
will help you browse to an existing
(Ctrl+S or ) saves the current version of the project without prompting for a project
for a different project file name and for a destination folder before
In this dialogue box you can system type, and the coordinate system name.
, then click the arrow to
GeoMap.WA user guide 33 Figure 47. Change the [Project Name], [Coordinate System Type], and [Coordinate System Name] in the [Project Properties] dialogue box
Recently opened projects: The four most recently opened projects are listed in the [Project] menu
options. Left click one to open it.
[Exit] closes the project and GeoMap.WA. If you have made changes, you will be prompted to save the project before exiting.
9.2 [View] options
Figure 48. [View] options
A
➼
beside the [View] option indicates that the [Legend] or [Overview map] is open (Fig. 48). The [Legend] and [Overview map] will be visible and docked when a project is first opened in GeoMap.WA. If the [Legend] or [Overview map] is closed and then reopened, it will reappear as a floating panel. For more details see Appendix 3 Control of [Legend] and [Overview map].9.3 [Tools] options
Many of the options in the [Tools] menu (Fig. 49) are also available as buttons on the Toolbar, and work in exactly the same way. For more information on the way the [Tools] menu options work, see
Toolbar buttons.
GeoMap.WA user guide
9.4 [GPS Tracking] options
Use the [GPS Tracking] options to setup and use a GPS (Fig. 50
Figure 50. [GPS Tracking] menu
Figure 51. [GPS Connection Setup] dialogue box For details see GPS tracking
9.5 Toolbar buttons
Figure 52. All the toolbar buttons
[New Project] opens GeoMap.WA
start a new project.
[Open Project] brings up a dialogue box that will help you browse to an existing project
(*.gmp file). See ‘Open an existing project
[Save Project] saves the current version of the project without prompting for a project name
or destination. See ‘Save a project
[Save Project As] prompts
saving. See ‘Save a project as
Add Data opens the dialogue box shown in Figure 53, which allows you to locate and add
layers in the formats shown below.
ptions
Use the [GPS Tracking] options to setup and use a GPS (Fig. 50 and Fig. 51).
Figure 51. [GPS Connection Setup] dialogue box
Figure 52. All the toolbar buttons
GeoMap.WA with a blank map, [Legend], and [Overview map]
brings up a dialogue box that will help you browse to an existing project
Open an existing project’
saves the current version of the project without prompting for a project name
Save a project’
prompts for a different project file name and destination folder before
Save a project as’
opens the dialogue box shown in Figure 53, which allows you to locate and add layers in the formats shown below.
Click to open the [GPS Connection Settings] dialogue box (Fig [Connect to a GPS Unit]
34 [Overview map]. See
brings up a dialogue box that will help you browse to an existing project
saves the current version of the project without prompting for a project name
for a different project file name and destination folder before
opens the dialogue box shown in Figure 53, which allows you to locate and add [GPS Connection
GeoMap.WA user guide
Figure 53. Add a layer to a project
[Pan] allows you to reposition the map in the map panel without changing the scale. Hold
down the left mouse button, and when the hand image becomes a closed hand map to a new position.
Figure 54. Using the [Pan To Coordinates] dialogue box
[Pan to coordinates] opens the [Pan To Coordinates] dialogue box (Fig. 54) and displays a
large blue cross at the centre of the current map and on the of the blue cross are displayed in the [Pan
Figure 53. Add a layer to a project
allows you to reposition the map in the map panel without changing the scale. Hold down the left mouse button, and when the hand image becomes a closed hand
Figure 54. Using the [Pan To Coordinates] dialogue box
opens the [Pan To Coordinates] dialogue box (Fig. 54) and displays a large blue cross at the centre of the current map and on the [Overview map]
of the blue cross are displayed in the [Pan to coordinates] dialogue box. Type new coordinates
Supported formats
Coordinates ofthe blue cross
Coordinates of the cursor’s current position within the main map panel.
35 allows you to reposition the map in the map panel without changing the scale. Hold down the left mouse button, and when the hand image becomes a closed hand , drag the
opens the [Pan To Coordinates] dialogue box (Fig. 54) and displays a [Overview map]. The coordinates oordinates] dialogue box. Type new coordinates
GeoMap.WA user guide
in the [X:] and [Y:] fields and then click [Pan]. The new coordinates, marked by the blue cross, will be centred in the map panel. Close the dialogue box by clicking the cross (top right).
[Zoom in] enlarges a selected area of your map. Click the button then draw the magnifier
icon over the area of the map you want to enlarge.
[Zoom out] allows you to display more of your map in the main map panel. Click the zoom
out button, then click the current view at a smaller scale.
[Zoom to previous extents
previous view.
[Zoom to visible layers
that are turned on (ticked in the
[Zoom to full extents] uses the full extent of the map panel to display all layers in the
[Legend], including those that are turned off
[Identify] displays information about a selected
cursor over the specific map feature will be about features from
identified (Fig. 56).
In Figure 55 the active layer is
000 sheets. ‘PARDOO’ has been selected from the four, and the information in the the right is about ‘PARDOO’
Figure 55. Four features from the [Active Layer (*)] are in the selected area. Information about is in the table on the right
Figure 56 shows that all the layers that can be chosen. In this example, [All Layers] has be
chosen, and the ‘MINEDEX’ layer is at the top, even though it is not currently turned on. There are many MINEDEX sites in the selected area
S0017221]. The information includes a hyperlink to the Deposits (MINEDEX) web database
in the [X:] and [Y:] fields and then click [Pan]. The new coordinates, marked by the blue cross, will be centred in the map panel. Close the dialogue box by clicking the cross (top right).
enlarges a selected area of your map. Click the button then draw the magnifier over the area of the map you want to enlarge.
allows you to display more of your map in the main map panel. Click the zoom out button, then click the within the map panel. Each click in the map panel displays the current view at a smaller scale.
Zoom to previous extents] is like an undo option. Click the icon to return
Zoom to visible layers] uses the whole map panel to display the full extent
(ticked in the [Legend]).
uses the full extent of the map panel to display all layers in the
including those that are turned off (not currently visible).
displays information about a selected map features. Click the button then draw the specific map feature you want identified. By default the information displayed
from the active layer (Fig. 55), but other layers feature s
In Figure 55 the active layer is ‘Index100’ and the area selected has intersected four 1:100 has been selected from the four, and the information in the
DOO’.
Figure 55. Four features from the [Active Layer (*)] are in the selected area. Information about
the layers that can be chosen. In this example, [All Layers] has be
layer is at the top, even though it is not currently turned on. There are sites in the selected area — the information in the table is for [Site_Code
S0017221]. The information includes a hyperlink to the matching record in DMP’s Mines and Mineral database application.
36 in the [X:] and [Y:] fields and then click [Pan]. The new coordinates, marked by the blue cross, will be
enlarges a selected area of your map. Click the button then draw the magnifier
allows you to display more of your map in the main map panel. Click the zoom n the map panel. Each click in the map panel displays the
is like an undo option. Click the icon to return the display to the
full extent of the all layers
uses the full extent of the map panel to display all layers in the
. Click the button then draw the you want identified. By default the information displayed
feature scan also be
and the area selected has intersected four 1:100 has been selected from the four, and the information in the table on
Figure 55. Four features from the [Active Layer (*)] are in the selected area. Information about PARDOO
the layers that can be chosen. In this example, [All Layers] has been layer is at the top, even though it is not currently turned on. There are
le is for [Site_Code
GeoMap.WA user guide
Figure 56. The [Feature Info] dialogue box shows that there are 284 sites from all layers are in the selected area. Information for MINEDEX
If a data source is named SUMMARY source will be displayed in place of
57 and 58 show the difference between the way information is displayed when a data source is named Minedex and when the same data source is named
Figure 57. Result of Identify action when linked data source is named from the linked MINEDEX data source is available through the
in Figure 58
Figure 56. The [Feature Info] dialogue box shows that there are 284 sites from all layers are in the MINEDEX site S0017221 is displayed in the table on the right
SUMMARY (generally a default setup by GSWA) the information from that
source will be displayed in place of the information retrieved from the dataset’ attribute
show the difference between the way information is displayed when a data source is named Minedex and when the same data source is named SUMMARY.
action when linked data source is named [MINEDEX]
data source is available through the [View] link and is the same as displayed
Click [View] to open information from the linked data source called Minedex
37 Figure 56. The [Feature Info] dialogue box shows that there are 284 sites from all layers are in the
le on the right
(generally a default setup by GSWA) the information from that the information retrieved from the dataset’ attribute table. Figures show the difference between the way information is displayed when a data source is
[MINEDEX]. The information link and is the same as displayed
Click [View] to open information from the linked data source called Minedex
GeoMap.WA user guide
Figure 58. Result of Identify action
same information that was available through the [View] link in Figure 5 attribute table is not displayed at all.
Use the [Export to CSV] to save the results of the search to a file.
Data query button opens a dialogue that helps you create a query to find and display
information about features that meet criteria you choose. In the example presented in Figure 59, [MINEDEX] is the chosen layer, and the query is set to find all Minedex
target commodity is MANGANESE ORE
Figure 59. Set up a query to find sites that meet specific criteria Double click a category
Single click a
function icon
Selected criteria
. Result of Identify action when the MINEDEX data source is renamed Summary. This is the same information that was available through the [View] link in Figure 57. The information from the main
le is not displayed at all.
to save the results of the search to a file.
opens a dialogue that helps you create a query to find and display information about features that meet criteria you choose. In the example presented in Figure
is the chosen layer, and the query is set to find all Minedex MANGANESE ORE.
. Set up a query to find sites that meet specific criteria
Click the arrow to display layers, then select a layer to query click a category
Selected criteria
Click the arrow to see the data sources associated
with the selected layer
Double click a value in the list
38 ta source is renamed Summary. This is the
. The information from the main
opens a dialogue that helps you create a query to find and display information about features that meet criteria you choose. In the example presented in Figure
is the chosen layer, and the query is set to find all Minedex sites where the
Click the arrow to display list of layers, then select a layer to query
Click the arrow to see the data sources associated
with the selected layer
GeoMap.WA user guide 39 To set up a query:
1. Select the data [Layer], click the arrow beside the [Layer:] field to display the available layers and then choose a layer to query.
2. [Select a data source], a list of available fields for the chosen layer will be displayed. If you have added other data sources to the selected layer you can select that data source by clicking the arrow in the [Select data source:] field.
3. Double-click on the field you want to query. The filed name will be added to the [Select * from Main (Attribute Table) Where]. The range of possible values for that field will be displayed beside the function icons.
4. Single-click the function icon to build the query e.g [= or >]. The function will be added to the [Select * from Main (Attribute Table) Where].
5. Next double-click the value you are querying against. In Figure 59 the value = Manganese Ore 6. The complete query is now built and displayed in the [Select * from Main (Attribute Table)
Where].
In the example in Figure 59, the layer is [minedex], the data source is the Main (Attribute table), the feature is [Target_Com] (target commodity), and the value is [Manganese Ore]. The whole query becomes ‘Select * from Main (Attribute table) Where TARGET_COM = “MANGANESE ORE’’. Click [OK] to display a list of sites that meet these criteria (Fig. 60). * = all information available in the main attribute table.
Figure 60. Results (136 sites) of the search for MINEDEX sites where the target commodity is manganese ore
Click on a site name to display details for that site in the table on the right. When you click on a new site in the left-hand panel, its location will be displayed briefly on the map as a pale blue dot in the centre of darker blue cross hairs (Fig. 61), but you will have to move the [Feature Info] panel away from the centre of the main map panel, or make it smaller if you want to see the location.
Selected site and site details
GeoMap.WA user guide
Figure 61. Location of selected site (
You can also create queries that meet multiple criteria (Fig. 6 search criteria instead of selecting them from the lists and
Figure 62. Query with multiple criteria Clicking [Export to CSV] (Fig.
criteria and clicking [Export all to CSV] saves details of all sites in the list choice.
[Measure Tool button
points, or the area and perimeter of a selected region on the current map. [Measure Tool] button to open the dialogue box shown in Figure 6
Location of selected site (MINEDEX site_code S0001407 in this example)
also create queries that meet multiple criteria (Fig. 62). If you prefer, you can type the search criteria instead of selecting them from the lists and function icons.
Query with multiple criteria
] (Fig. 58) saves details for the selected site that meet the specified and clicking [Export all to CSV] saves details of all sites in the list to a location of your
Measure Tool button] allows you to measure either the distance between two
points, or the area and perimeter of a selected region on the current map. button to open the dialogue box shown in Figure 6
Location of Minedex site S0001407
40 site_code S0001407 in this example)
If you prefer, you can type the
site that meet the specified to a location of your
allows you to measure either the distance between two points, or the area and perimeter of a selected region on the current map. Click the
button to open the dialogue box shown in Figure 63.
GeoMap.WA user guide
Figure 63. [Measure Tool] dialogue for distance Select the [Distance] or the [Area]
default is metres for both distance and area/perimeter.
For [Distance], click on the first and last points of the distance you want to measure. For the first two points, the [Measure Tool
segment:] and [Total distance
segment:] and the length of all lines combined will be displayed For area and perimeter, click the cursor at the corners
[Measure Tool] dialogue will display both perimeter length and area of
Figure 64. [Measure Tool] dialogue for area and perimeter
[Product Search
about publications that are relevant to a selected area of the current view. The Product layer does NOT need to be turned on in order for the
work.
IMPORTANT: The layer must be named
work. When you click the Product Search
, which you can use to outline the area of the current view for which you want a list of publications. The result will look like Figure 6
dialogue for distance
Select the [Distance] or the [Area] tab, and then choose the preferred unit of default is metres for both distance and area/perimeter.
, click on the first and last points of the distance you want to measure. For the Measure Tool] dialogue box will display the same distance
Total distance:]. The length of subsequent lines will be displayed and the length of all lines combined will be displayed next to [Total distance
erimeter, click the cursor at the corners of the polygon you wish to measure. The dialogue will display both perimeter length and area of the polygon (Fig. 6
dialogue for area and perimeter
Product Search] is typically setup by GSWA to display bibliographic information
about publications that are relevant to a selected area of the current view. The Product layer does NOT need to be turned on in order for the [Product Search
The layer must be named PRODUCTS (GSWA default name)
Product Search button, the cursor becomes a book and magnifier
, which you can use to outline the area of the current view for which you want a list of publications. The result will look like Figure 65.
41 , and then choose the preferred unit of measurement. The
, click on the first and last points of the distance you want to measure. For the will display the same distance next to [Last . The length of subsequent lines will be displayed next to [Last
Total distance:]. of the polygon you wish to measure. The
the polygon (Fig. 64).
display bibliographic information about publications that are relevant to a selected area of the current view. The
Product Search] to
fault name) for the search to
button, the cursor becomes a book and magnifier , which you can use to outline the area of the current view for which you want a list of
GeoMap.WA user guide 42 Figure 65. Results of a product search
Results are separated into [Regional] and [State]. Click the [State] tab to view publications that are about the whole of Western Australia. Click the [Regional] tab to display publications that relate to the area of the project that you selected.
Titles in blue are linked to *.PDF documents. Click on the title to open the *.PDF of that publication.
Click [Print] to print the [Product Search] results. Both [Regional] and [State] results will print regardless of which *.tab is currently selected.
Click [Export To CSV] to save the results as a CSV file in a location you choose.
If you have purchased a digital package, the Products layer will already be correctly set up. If you wish to link a Products layer to your own database and *.PDF documents, remember that the layer MUST be named Products, and the data source for the Products layer must be set up as shown in Figure 66.
In Figure 66, the Microsoft Access database called KitCat has already been linked to the main attribute table. The address in the [Source] field is the location of the *.PDF documents
associated with the database. ‘PDFDocumentName’ has been chosen as the ‘link from’ field to link to the *.PDF documents in the folder specified in the [Source] field. In this case, there is no need for a [link to field:].
GeoMap.WA user guide
Figure 66. [Data Source Configuration] for the Products layer
Print button prints the map as it is currently displayed in the main map
the [Print] button to open the dialogue shown in Figure 6
choose the [Paper Size:], [Orientation:], and [Header:] and [Footer:] text. Tick [Display date] to show the date on the printout.
Figure 67. Set up paper size, orientation, header and footer
Click [OK] to view a print preview with title, date, time, scale, and north arrow (Fig. 68). The preview has buttons for controlling the way the map is displayed (Fig. 6 . [Data Source Configuration] for the Products layer
prints the map as it is currently displayed in the main map n to open the dialogue shown in Figure 67, which allows you to choose the [Paper Size:], [Orientation:], and [Header:] and [Footer:] text. Tick [Display date] to show the date on the printout.
Set up paper size, orientation, header and footer, and date for the print
Click [OK] to view a print preview with title, date, time, scale, and north arrow (Fig. . The preview has buttons for controlling the way the map is displayed (Fig. 6
Address of folder containing *.PDF documents (can be copied and pasted into the Source field)
Previously added data source
PDFDocumentName (from Kitcat) selected as link to*.pdf Documents in the source folder. In this case
there is no need to specify a ‘Link to’ field.
43 prints the map as it is currently displayed in the main map panel. Click
, which allows you to choose the [Paper Size:], [Orientation:], and [Header:] and [Footer:] text. Tick [Display
, and date for the print
Click [OK] to view a print preview with title, date, time, scale, and north arrow (Fig. . The preview has buttons for controlling the way the map is displayed (Fig. 69).
folder containing *.PDF documents (can
Previously added data source
PDFDocumentName (from Kitcat) selected as link to*.pdf Documents in the source folder. In this case
GeoMap.WA user guide Figure 68. Print preview
Figure 69. Print controls
9.6 Context menu
Many of the toolbar options are also available by clicking the right mouse button within the map panel (Fig. 70), and two extra options are also available:
[Smooth Map] Turn smooth map on or off to smooth/unsmooth the line work on the map. [Copy Map to Clipboard
frame or floating panels. The copy can be pasted into another document.
Increase size of content Display 100%
Many of the toolbar options are also available by clicking the right mouse button within the map panel ), and two extra options are also available:
Turn smooth map on or off to smooth/unsmooth the line work on the map.
Clipboard] makes a copy of just the current map view, without the
frame or floating panels. The copy can be pasted into another document.
Increase size of content
Display 100% Whole page
Two pages
Decrease size of content Page width
44 Many of the toolbar options are also available by clicking the right mouse button within the map panel
Turn smooth map on or off to smooth/unsmooth the line work on the map.
makes a copy of just the current map view, without the frame or floating panels. The copy can be pasted into another document.
GeoMap.WA user guide 45 Figure 70. Some options can be accessed by clicking the right mouse button within the map panel
![Figure 17. Use the [Legend] to display or hide layers and symbols](https://thumb-us.123doks.com/thumbv2/123dok_us/8565271.2318011/17.892.108.765.295.671/figure-use-legend-display-hide-layers-symbols.webp)
![Figure 24. [Fill Symbol Properties] dialogue box: [Style:] choices change the transparency and pattern for the individual symbol](https://thumb-us.123doks.com/thumbv2/123dok_us/8565271.2318011/21.892.113.696.107.401/figure-symbol-properties-dialogue-choices-transparency-pattern-individual.webp)
![Figure 44. [Overview map] shows only the active layer [*projarea]. Red lines on the [Overview map] show the extent of the current view in the main map panel](https://thumb-us.123doks.com/thumbv2/123dok_us/8565271.2318011/31.892.115.628.170.543/figure-overview-shows-active-projarea-overview-extent-current.webp)
![Figure 55. Four features from the [Active Layer (*)] are in the selected area. Information about is in the table on the right](https://thumb-us.123doks.com/thumbv2/123dok_us/8565271.2318011/36.892.122.647.598.956/figure-features-active-layer-selected-information-table-right.webp)
![Figure 56. The [Feature Info] dialogue box shows that there are 284 sites from all layers are in the selected area](https://thumb-us.123doks.com/thumbv2/123dok_us/8565271.2318011/37.892.124.724.106.411/figure-feature-info-dialogue-shows-sites-layers-selected.webp)
