SHORT PALATE LUNG AND NASAL EPITHELIUM CLONE 1 DISSOCIATES AND ENDOCYTOSES THE EPITHELIAL SODIUM CHANNEL
Christine Seulki Kim
A dissertation submitted to the faculty at the University of North Carolina at Chapel Hill in partial fulfillment of the requirements for the degree of Doctor of Philosophy in Oral
Biology in the Oral Biology Program in the School of Dentistry.
Chapel Hill 2016
iii ABSTRACT
Christine Seulki Kim: Short Palate Lung and Nasal Epithelium Clone 1 Dissociates and Endocytoses the Epithelial Sodium Channel
(Under the direction of Robert Tarran)
The movement of Na+ through the epithelial Na+ channel (ENaC) is the rate-limiting step for Na+ absorption across the apical plasma membrane of airway epithelia. In cystic fibrosis (CF), increased ENaC activity reduces airway surface liquid (ASL), thickening mucus and increasing the risk of bacterial infection. Increasing the ASL may help restore proper mucociliary clearance in airways of patients with CF. Short Palate Lung and Nasal Epithelium Clone 1 (SPLUNC1) is a multi-functional protein that is secreted in the airways. SPLUNC1 binds to βENaC through its ENaC inhibitory domain and inhibits ENaC’s ability to conduct Na+. In this dissertation, we report our novel, automated method of measuring ASL height for a potential high-throughput approach to drug evaluation on ASL hydration, and we report our findings regarding SPLUNC1’s mechanism of ENaC inhibition.
iv
v
ACKNOWLEDGEMENTS
First and foremost, I thank God for His abundant grace and mercy that led me this far.
I thank my adviser, Dr. Robert Tarran, for the opportunity to be trained under his mentorship. I thank my committee members, Drs. Roland Arnold, Sompop Bencharit, Jack Stutts, and Douglas Cyr for their valuable insights. I particularly thank Dr. Arnold Roland for his support as a committee chair and I wish to become a scholar like him. All the current and previous Tarran Lab members as well as oral biology program students and staff are at a special place in my heart for their scientific and personal support. I’m grateful for my program director, Dr. Ceib Phillips, who inspires me with her leadership.
I thank all my friends (too many to list everyone but you know who you are) who were/are always by my side through the highs and lows. I show my deepest gratitude to Cheryl Hunter, Esther Lee, Jaehee Park, Jiyeon Lee, Michael Pham, Minah Kim, Susan Park, Tim & Jieun Kim, and Yooni Lee for the friendships and prayers. I thank all of the Summit and Riverlife church friends for becoming my spiritual family, encouraging & challenging my spirit for maturity, and helping my spirit to be connected with the Holy Spirit.
vi
“I have learned in whatever situation I am to be content. I know how to be brought low, and I know how to abound. In any and every circumstances, I have learned the secret of facing
vii
TABLE OF CONTENTS
LIST OF TABLES ...x
LIST OF FIGURES ... xi
Chapter 1: Introduction ...1
1.1 The epithelial Na+ channel ...1
1.1.1 Molecular structure and composition of ENaC ...2
1.1.2 ENaC regulation...4
1.1.3 ENaC trafficking ...8
1.1.4 Clinical correlations between ENaCs and human diseases...11
1.2 Short palate lung and nasal epithelium clone 1 ...16
1.2.1 SPLUNC1 expression ...17
1.2.2 Functions of SPLUNC1 ...18
Chapter 2: Automated Acquisition and Analysis of Airway Surface Liquid Height by Confocal Microscopy ...27
2.1 Introduction ...27
2.2 Methods...30
2.2.1 Primary human bronchial epithelial culture ...30
2.2.2 Confocal microscopy measurements of ASL ...30
2.2.3 ATP or dexamethasone stimulation and SPLUNC1 time-course and dose-response ...31
2.2.4 Statistical analyses ...32
viii
2.3.1 Automatic binarizing of images and finding boundaries of
image subsections ...32
2.3.2 Finding the optimal number of subsections ...36
2.3.3 Finding valid subsections ...36
2.3.4 Finding the optimal Mark-and-Find design ...38
2.3.5 Applications of the proposed automated method...39
2.4 Discussion ...40
2.4.1 Summary of the algorithm ...41
2.4.2 Parameter settings ...42
2.4.3 Mark-and-Find analysis ...42
2.4.4 Application analysis ...43
2.4.5 Concluding remarks ...44
Chapter 3: SPLUNC1 Dissociates and Endocytoses ENaC ...54
3.1 Introduction ...54
3.2 Methods...56
3.2.1 Cell culture ...56
3.2.2 Constructs ...57
3.2.3 Expression and purification of human SPLUNC1 ...58
3.2.4 Surface biotinylation ...58
3.2.5 Immunoprecipitation ...59
3.2.6 Binding assay ...60
3.2.7 Immunostaining ...60
3.2.8 Acquiring and analyzing confocal images ...61
ix
3.2.10 Statistical Analysis ...62
3.3 Results ...63
3.3.1 Characteristics of ENaC subunit internalization by SPLUNC1 ...63
3.3.2 ENaC internalization by SPLUNC1 requires βENaC ...67
3.3.3 Binding of SPLUNC1 to βENaC ...67
3.3.4 The fate of internalized αγENaC following SPLUNC1 exposure ...68
3.3.5 Endocytosis of αENaC via ubiquitination ...71
3.3.6 SPLUNC1 is an allosteric modulator of ENaC...74
3.4 Discussion ...76
3.4.1 SPLUNC1’s Order of Action on ENaC ...76
3.4.2 Non-coordinated Subunit Regulation ...77
3.4.3 Ubiquitination and Protein Control ...77
3.4.4 SPLUNC1-induced ENaC’s conformational change ...79
3.4.5 Concluding remarks ...80
Chapter 4: Overall Conclusions and Future Directions ...100
x
LIST OF TABLES
Table 2.1 The average of elapsed times to measure ASL height of an image in the test image set according to the subsection configuration ...45
Table 2.2 The result of height measurements with 32 subsections and the
xi
LIST OF FIGURES
Figure 1.1 Schematics of ENaC Structure...22
Figure 1.2 Schematics of trafficking and regulation of ENaC ...23
Figure 1.3 A Schematic of ENaC trafficking by ubiquitination and de-ubiquitination ...24
Figure 1.4 Schematics of non-CF and CF airways demonstrating that absence of CFTR leads to ASL dehydration...25
Figure 1.5 Crystallographic structure of human SPLUNC1 ...26
Figure 2.1 Initial processing of confocal micrographs using Otsu’s threshold ...47
Figure 2.2 Analysis of histogram profiles using a 7-Step filter ...48
Figure 2.3 ASL height measurments according to different subsection configurations ...49
Figure 2.4 The distribution of inlier and outlier subsections in a 2-dimensional plane ...50
Figure 2.5 Examples of the detected boundaries of different ASL regions obtained from the test image set ...51
Figure 2.6 A comparison of sample size versus mean ASL height ...52
Figure 2.7 Validation of Our Approach: Inhibition or activation of ENaC and stimulation of CFTR/Cacc on ASL height...53
Figure 3.1 Native gel electrophoretic mobility shifts of SPLUNC1 and Δ44SPLUNC1 ...81
Figure 3.2 rSPLUNC1 internalizes α and γENaC, leaving βENaC at the plasma membrane in HEK293T cells ...82
xii
Figure 3.4 rSPLUNC1 internalizes αENaC in a time-dependent manner in HEK293T
cells ...84
Figure 3.5 rSPLUNC1 does not internalize Ano1 in HEK293T cells...85
Figure 3.6 rSPLUNC1 reduces endogenous αENaC but not βENaC in HBECs ...86
Figure 3.7 rSPLUNC1 internalizes αENaC through the interaction with βENaC in
HEK293T cells...87
Figure 3.8 rSPLUNC1 remains at the plasma membrane on HEK293T cells ...88
Figure 3.9 Inhibition of Lysosomes but not proteasomes prevents αENaC degradation in HEK293T cells ...89
Figure 3.10 αENaC colocalizes with LAMP1 in HEK293T cells...90
Figure 3.11 α- and γENaC colocalize in HEK293T cells ...91
Figure 3.12 Detection of increased overexpressed ubiquitin on αENaC by rSPLUNC1 in HEK293T cells ...92
Figure 3.13 Detection of increased endogenous ubiquitin on αENaC by rSPLUNC1 in HEK293T cells ...93
Figure 3.14 Deletion of αENaC’s C-terminus or co-expression of a Nedd4-2 dominant negative construct abolishes the internalization of αγENaC by rSPLUNC1 in HEK293T cells ...94
Figure 3.15 rSPLUNC1 ubiquitinates αENaC after ~1 h of incubation in HEK293T cells ...95
Figure 3.16 The change in the FRET efficiency between the γENaC-mCherry and free GFP FRET pair is due to the crowding effect while that of the αENaC-GFP and γENaC-mCherry FRET pair is not ...96
xiii
Figure 3.18 SPLUNC1 induces ENaC conformational change in time-dependent manner in HEK293T cells ...98
Figure 3.19 SPLUNC1’s Order of Action ...99
Figure 4.1 SPLUNC1 reduces overall B. cenocepacia GFP signals in HEK293T cells when ENaC is co-expressed in HEK293T cells ...104
xiv
LIST OF ABBREVIATIONS ALI Air-liquid interface
Ano1 Anoctamin-1
ASIC Acid-sensing Ion Channel
ASL Airway surface liquid BCA Bicinchoninic acid
Bcc Burkholderia cepacia complex
BPI Bacterial permeability-increasing protein
BPIFA1 Bacterial permeability-increasing protein family member A1
CaCC Calcium-activated chloride channel cAMP Cyclic adenosine monophosphate CAP1 Channel-activating protease
CF Cystic fibrosis
CFTR Cystic fibrosis transmembrane conductance regulator
CFU Colony-formaing unit
COPD Chronic obstructive pulmonary disease COPII Coat complex II
xv
DUB Deubiquitinating enzymes E1 Ubiquitin-activating enzyme
E2 Ubiquitin-conjugating enzyme E3 Ubiquitin-protein ligase
EGTA Thylene glycol-bis(2-aminoethylether)-N,N,N′,N′-tetraacetic acid ENaC Epithelial Na+ Channel
ER Endoplasmic reticulum
ERAD Endoplasmic reticulum associated degradation ERp29 Endoplasmic reticulum protein 29
FBS Fetal bovine serum
FRET Fӧrster Resonance Energy Transfer gNa Channel conductance for Na+
HBEC Human bronchial epithelial culture
HECT Homologous to the E6AP carboxyl terminus domain
HG His-Gly motif
Hsp70 70 kDa heat shock protein INa Na+ current
xvi
LPLUNC1 Long palate, lung and nasal epithelium clone 1 LUNX Lung specific protein-X
MOI Multiplicity of infection
N Number of plasma membrane ENaC
NA Numerical aperture
NASG Nasopharyngeal carcinoma-related protein
Nedd4 Neutral precursor cell expressed developmentally down-regulated protein 4
N-linked Asparagine-linked
NSCLC Non-small cell lung carcinoma
NT Non-transfected
OCT Optical coherence tomography PBS Phasphate buffered saline
PBS++ Phosphate buffered saline with MgCl2 and CaCl PCL Periciliary Layer
PFA Paraformaldehyde
PHA-I Type I pseudohypoaldosteronism PI3K Phosphoinositide 3-OH kinase
xvii
PIP3 Phosphatidylinositol 3,4,5-trisphosphate PKA Protein kinase A
Po Open probability or open state of ENaC PY Proline rich motif
RANSAC Random Sample Consensus
RING Really interesting new gene domain
RT-qPCR Real time qualitative polymerase chain reaction
S18 SPLUNC1's ENaC inhibitory domain SD Standard deviation
SDS-PAGE Sodium dodecyl sulfate polyacrylamide gel electrophoresis SEM Standard error of the mean
SGK Serine/threonine-protein kinase
SLRM Surface laser reflectance microscopy
SNARE Soluble N-ethylmaleimide-sensitive factor activating protein receptor
SPLUNC1 Short palate, lung and nasal epitheliaum clone 1 Δ19SPLUNC1 SPLUNC1 without its secretory signal peptide ∆44SPLUNC1 SPLUNC1 without its ENaC inhibitory domain
xviii
STIM1 Stromal interaction molecule 1 TBS TRIS buffered saline
TGN Trans-Golgi network
TM Transmembrane
TNF-α Tumor necrosis factor-alpha
1
Chapter 1: Introduction
1.1. The epithelial Na+ channel
According to sequence homology, the epithelial Na+ channel (ENaC) is a member of the ENaC/degenerin (DEG) family. The crystal structure of ENaC has not yet been solved and it has been predicted that ENaC shares a structure similar to the acid-sensing ion channel (ASIC), a closely related member of the DEG family that shares ~15–20% amino acid sequences with ENaC (de la Rosa et al., 2004; Kashlan and Kleyman, 2011; Kellenberger and Schild, 2002). Though in the same family, members of the DEG superfamily differ in their distribution. For example, the ASIC is widely expressed in neurons, while ENaC is expressed at the apical membrane of epithelia in kidneys, sweat glands, intestine, salivary glands, tongue, skin, and lungs.
2
On the other hand, the function of ENaCs in the lung is regulated by the glucocorticoid cortisol (Rossier and Stutts, 2009). ENaC is classically characterized by its high selectivity for Na+ over K+, a low unitary conductance of 4–5 pS, and its role in Na+ transport across epithelia. It is well studied that ENaC-mediated transcellular Na+ transport plays a crucial role in maintaining the entire body’s Na+ homeostasis and hence plays a role in the regulation of luminal fluid composition and volume, and ultimately blood pressure (Bhalla and Hallows, 2008; Garty and Palmer, 1997). However, researchers have also demonstrated that ENaC has additional functions. For example, ENaCs can function as Na+ taste receptors in the tongue (Chandrashekar et al., 2010), regulate keratinocyte differentiation (Brouard et al., 1999), modulate neuronal activity and vasomotor sympathetic drive (Miller et al., 2013), and contribute to epithelial wound healing (Justet et al., 2013).
To date, five different ENaC subunits—α, β, γ, δ, and ε—have been identified (Rossier and Stutts, 2009). Of these, the ε subunit is only found in Xenopus renal cells (Babini et al., 2003). Furthermore, δENaCs are mostly found in the brain, testis, ovaries, and pancreas, with little to none in airways (Schwagerus et al., 2015). By contrast, α, β, and γ subunits are found in the human lung (Canessa et al., 1994; Eaton et al., 2010) and are responsible for conducting Na+ in the airways (Eaton et al., 2010). The α, β, and γ subunits share a 30% homology at the protein level with similar primary structures and membrane topologies (Canessa et al., 1994; Kashlan and Kleyman, 2011). 1.1.1. Molecular structure and composition of ENaC
3
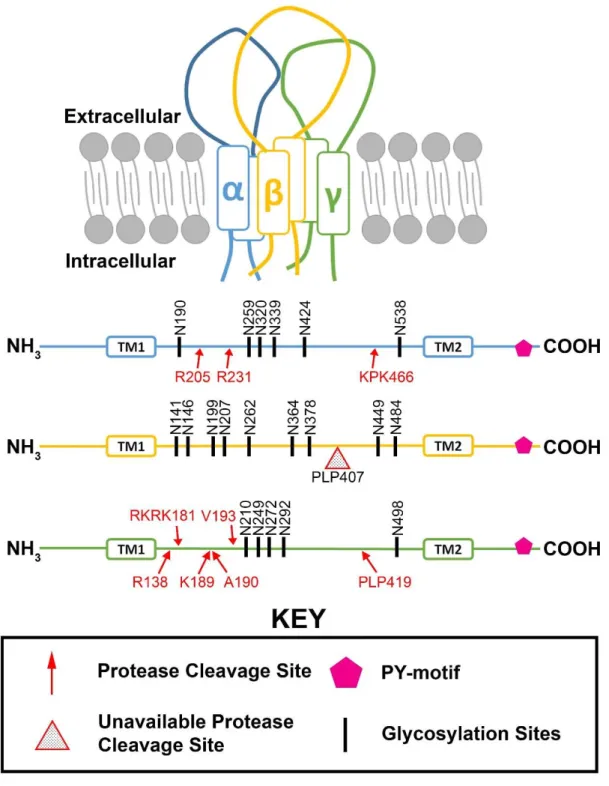
transmembrane domain (Kellenberger and Schild, 2002). This HG motif functions as a link between the hydrophobic transmembrane and the intracellular N-terminus. Another conserved motif shared by α, β, and γ subunits is the proline rich (PY) motif (Figure 1). All three subunits possess the PY motif in their C-termini which serves as a binding site for the cytosolic ubiquitin ligase, neutral precursor cell expressed developmentally down-regulated protein 4 (Nedd4), and its close relative Nedd4-2 (Figure 1) (Snyder, 2002; Staub, 1997). The ENaC subunits also have cysteine-rich domains in their extracellular loops, responsible for forming disulfide bridges to maintain the tertiary structure (Firsov et al., 1999). Additionally, all three subunits possess glycosylation sites in their extracellular loops where they undergo glycosylation during maturation in the endoplasmic reticulum (ER) and trans-Golgi network (TGN) (Figure 1) (Hanwell et al., 2002; Rotin et al., 2001). Moreover, multiple protease cleavage sites have been identified in the extracellular loops of all three subunits (Figure 1). However, due to heavy glycosylation that covers the cleavage sites, the protease cleavage sites of the β subunit are inaccessible (Figure 1) (Rossier and Stutts, 2009). Therefore, only α and γ subunits undergo proteolytic cleavage, which is known to play a role in the channel’s activation (Figure 1-2) (Rossier and Stutts, 2009). A variety of serine proteases and other enzyme classes evolutionally related to serine proteases are known to affect the function of the plasma membrane ENaC through extracellular proteolysis (Rossier and Stutts, 2009). However, previous studies have demonstrated that proteolytic cleavage in the extracellular loops of α and γ subunits can also take place intracellularly with the proprotein convertase family member Furin, as the subunits of ENaC undergo processing in the ER and TGN (Hughey et al., 2004, 2003).
4
and γ subunits are required for maximal expression of ENaCs on a cell’s surface (Firsov et al., 1996). Additionally, while the αENaC can function alone as a channel, the current is drastically reduced, amounting to ~2% of the maximum current (Bonny et al., 1999). Similarly, the γENaC alone can only generate a small current, ~0.5% of the maximum current. While α-β, α-γ, and β-γ co-expression is able to generate a higher current than that of a single subunit, the level of current still remains low, reaching only ~5% of the maximum current (Canessa et al., 1993; Firsov et al., 1996; McNicholas and Canessa, 1997). Research indicates that maximum ENaC expression and function occur when the ENaC is a heteromultimeric channel comprised of α, β, and γ subunits. While it is well established that the maximum current is produced when ENaC is composed of the three subunits discussed, the exact stoichiometry of ENaC is still controversial, with some studies suggesting that ENaC is a tetramer composed of 2 α, 1 β, and 1 γ subunits (Firsov, 1998; Kosari et al., 1998) and others proposing that ENaC is composed of an equal number of each subunit (Staruschenko et al., 2005, 2004).
1.1.2. ENaC regulation
1.1.2.1 Subunit regulation by genes and proteins
5
However, in the colon, the reverse can be observed, as aldosterone dramatically affects the transcription of β and γ subunits but not α (Farman et al., 1997). Additionally, the hormone estrogen has been shown to increase the transcription of α and γ subunits but not β in the kidney (Gambling et al., 2004). In the airways, dexamethasone has been shown to have different effects depending on incubation time. Incubation with dexamethasone for 24 h increases the transcription of the α subunit, while incubation for 24–48 h increases the transcription of β and γ subunits (Itani et al., 2002; Lazrak et al., 2000).
Similarly, ENaC subunits are individually regulated at protein levels. Treatment with dexamethasone on airway cells has been shown to result in different protein levels for ENaCs’ subunits, depending on the cell culturing system and length of incubation (Weisz and Johnson, 2003). For example, long term dexamethasone treatment of A549 cells has been shown to increase the protein levels of β and γENaCs but not αENaCs (Lazrak et al., 2000). On the other hand, on H441 cells, 24 h dexamethasone treatment has been shown to increase the protein level of αENaCs but not β and γENaCs (Itani et al., 2002). Furthermore, mRNA levels of ENaC subunits often do not correlate to their respective protein levels. For example, tumor necrosis factor-alpha (TNF-α) decreases the mRNA levels of α, β, and γ subunits, but only decreases the protein level of αENaCs (Dagenais et al., 2004).
1.1.2.2 ENaC regulation at the plasma membrane
6
equation 𝑰𝑵𝒂= 𝐍 ∙ 𝑷𝑶∙ 𝒈𝑵𝒂, where N is the number of channels available at the plasma
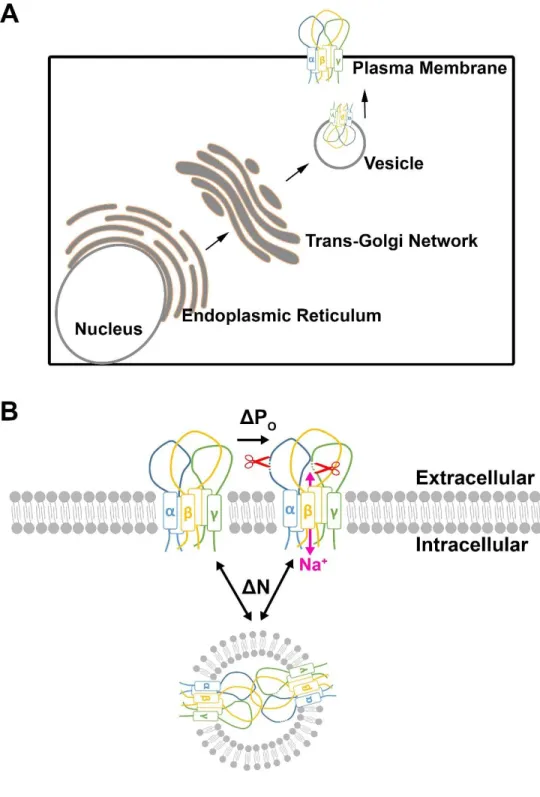
membrane, PO is the open probability or open state of the channel, and g is the channel conductance for Na+ (Gründer et al., 1997). While the conductance of ENaC can vary depending on the location of expression, reports have shown that wild type ENaCs exhibit a consistent, averaged single-channel conductance of ~5 pS (Canessa et al., 1994; Gründer et al., 1997). Therefore, ENaC can rapidly modulate the Na+ current at the plasma membrane via two major pathways, changing either N or PO (Figure 1.2). The number of channels available at the apical membrane is primarily regulated by ENaC trafficking to and from the plasma membrane. In this chapter, ENaC trafficking is detailed in section 1.1.3.
Similar to other members of the DEG family, ENaC subunits arrange themselves around a central channel pore (Snyder et al., 1999). The pores of DEG family members can either be closed or open, denoted with POvalues ranging from 0 (completely closed) to 1 (completely open). The control of the pore is referred as the gating mechanism. While DEG family members have many different gating mechanisms, unique to each member, they share a basic gating mechanism. Degenerin family members all possess either serine or glycine residue in the extracellular loop, preceding the second transmembrane domain, also known as the DEG site (Kellenberger et al., 2002). The DEG site of ENaC is located close to the outer pore entrance at αS576, βS518, and γS530 (Firsov et al., 1999; Rotin and Staub, 2011). Mutation of βS518 to cysteine allows hydrophilic sulfhydryl reagents to form a covalent bond, altering the channel conformation such that the open state of the channel is prolonged (Firsov et al., 1999; Kellenberger et al., 2002).
7
βG525, and γG537. Mutating these amiloride binding sites significantly reduces the ability of amiloride to inhibit ENaC (Schild et al., 1997). ENaC is known to be highly sensitive to amiloride with an inhibitory constant of 10-7 M (Schild et al., 1997). This discovery led to the identification of ENaC current as amiloride sensitive. However, amiloride can also block other ion channels, including ASICs (Ugawa et al., 2002).
While many studies have suggested that proteases may regulate transepithelial Na+ transport (Lewis and Clausen, 1991; Orce et al., 1980), Vallet et al. were the first to directly demonstrate that a protein from the serine protease family, the channel-activating protease (CAP1), increases ENaC activity (Vallet et al., 1997). Identified as prostasin, CAP1 is a unique serine protease as it is attached to the plasma membrane via a glycosylphosphatidylinositol anchor (Chen et al., 2001; Vallet et al., 1997). While CAP1 only cleaves the extracellular loops of α and/or γENaCs at the plasma membrane, other serine proteases and evolutionary related families of proteases such as furin or trypsin act both intracellularly and extracellularly on different proteolytic cleavage sites located in the extracellular loops of α and γENaCs (Figure 1.2) (Bruns et al., 2007; Caldwell et al., 2004; Chraïbi et al., 1998; Hughey et al., 2003; Vallet et al., 1997).
8
in the hydrolysis of PIP2. Activated P2Y receptors can also activate PI3K, thereby increasing levels of PIP2 and PIP3. As such, P2Y receptors participate in the regulation of ENaCs at the plasma membrane (Ma et al., 2002; Palmer et al., 2012).
1.1.3. ENaC trafficking
1.1.3.1 Trafficking to and from the plasma membrane
As discussed, ENaC subunits move from the ER to the TGN where they are glycosylated, assembled, and delivered to the apical plasma membrane (Butterworth, 2010; Ergonul et al., 2006; Hughey et al., 2003). It is well characterized that ENaC obtains core glycans and is trimmed to a high mannose glycosylated (immature glycans) in the ER and then processed to complex Asn-linked (N-Asn-linked) glycosylation (mature glycosylation) in the TGN (Rotin et al., 2001). However, it should be noted that ENaC subunits can reach the plasma membrane with both immature and matured glycans (Rotin et al., 2001). While the details of the ENaC’s delivery route are not fully understood, a number of accessory proteins involved in its trafficking have been identified. For example, disruption of actin or tubulin generates improper ENaC trafficking (Ilatovskaya et al., 2011; Wang et al., 2013). Furthermore, soluble N-ethylmaleimide-sensitive factor activating protein receptor (SNARE) proteins are known to play a role in the final vesicle fusion process (Gormley et al., 2003; Hill et al., 2007). Specifically, syntaxin, a SNARE protein, and the cytoplasmic C-termini of ENaC subunits have been shown to be directly associated (Condliffe et al., 2003; Hill et al., 2007).
9
binding to ENaCs, thus increasing the time spent by ENaCs at the plasma membrane. Additionally, serine/threonine-protein kinase (SGK) has been found to inhibit Nedd4-2 and thus increase ENaC activity. The details of how ubiquitin ligase regulates ENaC are detailed in the following section. Similar to vasopressin, epinephrine functions in the lungs to increase ENaC activity (Baines, 2013; Olver and Strang, 1974). Epinephrine is one of the ligands that activates β-adrenergic receptors, a class of G protein-coupled receptors (Olver and Strang, 1974). Activated β-adrenergic receptors increase the intracellular cAMP concentration, resulting in the activation of downstream effectors such as PKA (Olver and Strang, 1974).
1.1.3.2 Endocytosis via ubiquitination
10
facilitates the direct transfer of ubiquitin to the target protein (Ciechanover, 2005; Rotin and Staub, 2011).
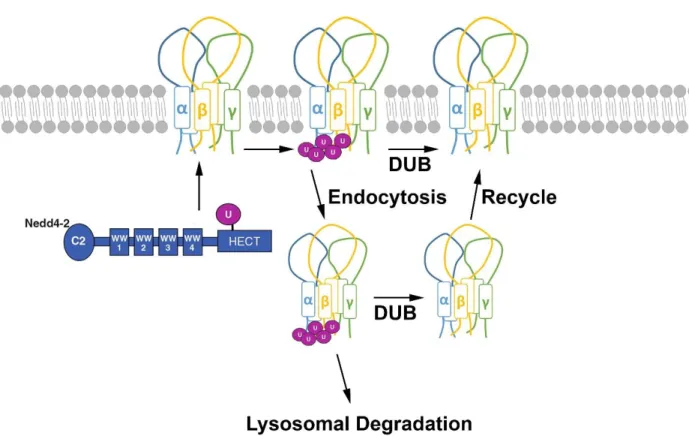
Ubiquitin-protein ligases Nedd4 and Nedd4-2, a Nedd4 paralogue, are key players in the ubiquitin-mediated endocytosis of ENaC (Snyder et al., 2004b; Soundararajan et al., 2012; Wiemuth et al., 2007). Both Nedd4 and Nedd4-2 contain a HECT domain. At the N-termini of Nedd4 and Nedd4-2 are four WW domains, named after the presence of two conserved tryptophans located 20–22 amino acids apart (Figure 1.3) (Bork and Sudol, 1994). The WW domains mediate the interaction with several substrates, including ENaC (Figure 1.3) (Ingham et al., 2004). While both Nedd4 and Nedd4-2 can ubiquitinate ENaC, it is known that Nedd4-2 ubiquitinates ENaC with a higher efficiency than Nedd4 (Rotin and Staub, 2011). Furthermore, it has been demonstrated that ubiquitination of ENaC takes place through the binding of Nedd4-2’s WW domain to the ENaC’s C-terminal PY-motif. Blocking the function of Nedd4-2 by inhibiting its enzymatic activity or binding to ENaC reduces ENaC ubiquitination and thus increases the level of plasma membrane ENaCs (Yang and Kumar, 2010; Zhou et al., 2007). Moreover, Nedd4-2 knock out mice exhibit salt-sensitive hypertension due to increased levels of plasma membrane ENaCs which are substantially reduced in the presence of amiloride (Yang and Kumar, 2010).
1.1.3.3 Degradation and recycling of ENaC
11
to the apical plasma membrane (Figure 1.3). Nonetheless, the full extent of DUB’s actions on ENaC recycling and the recycling pathway of ENaC is not understood. For degradation, ENaCs take either a proteasome- or lysosome-dependent pathway (Ciechanover, 2005). While it is classically believed that ubiquitinated proteins are degraded via proteasomes (Ciechanover, 2005), it has been demonstrated that ubiquitinated plasma membrane ENaCs are likely to be degraded via lyososmes (Staub, 1997; Wiemuth et al., 2007). It is understood that ENaCs faced with both degradation and recycling are present in the early endosome (Butterworth et al., 2012). However, it is unclear how and where ENaCs are differentiated for different endocytic fates.
1.1.4. Clinical correlations between ENaCs and human diseases
1.1.4.1 Lung
ENaC plays an important role in lung fluid homeostasis. At birth, the fetal lung is filled with fluid which must be reabsorbed for it to mature and develop into a post-fetal lung (Barker et al., 1998; Hummler et al., 1996; Olver and Strang, 1974). Fetal lung epithelium depends on active Cl- secretion for lung expansion (Barker and Olver, 2002; Jain and Eaton, 2006). At birth, the lung epithelium switches from secretory to absorption modes where ENaCs increase Na+ absorption and thereby clear the lung fluid (Barker and Olver, 2002; Jain and Eaton, 2006). A failure to actively absorb fluid and clear neonatal fluid results in transient tachypnea in newborns and neonatal respiratory distress syndrome (Elias and O’Brodovich, 2006; Gibson et al., 2003). This pivotal role for ENaC in the process of fluid absorption has been demonstrated by the creation of αENaC-deficient mice which experienced early death due to defective neonatal lung liquid clearance (Hummler et al., 1996).
12
exchange to fill the lungs with air (Figure 1.4) (Matsui et al., 1998b; Tarran and Boucher, 2002; Widdicombe and Widdicombe, 1995). The ASL is comprised of two layers: a lower periciliary layer (PCL) and an upper mucus layer (Figure 1.4) (Wanner et al., 1996). The mucus layer is a combination of mucus produced by the airway epithelium and fluid, providing a thin, watery layer that is more viscoelastic than the lower PCL (Kilburn, 1968; Wanner et al., 1996). Such characteristics of the mucus layer protect the lung from inhaled pathogens (Kilburn, 1968; Matsui et al., 1998b). The lower PCL is important in facilitating the movement of mucus by providing enough fluid for cilia to beat, a process called mucociliary clearance (Boucher, 1999; Matsui et al., 1998b). Well-balanced ASL hydration is important to conserve energy, the rate of cilia beating, and mucus clearance. In vitro studies have indicated that normal ASL height is approximately 7 µm (Boucher, 1994; Kilburn, 1968; Matsui et al., 1998a; Tarran and Boucher, 2002).
13
1994; Chambers et al., 2007). Likewise, during Cl- secretion via the cystic fibrosis transmembrane conductance regulator (CFTR), the vectorial transport of Cl- causes Na+ and water to passively follow the direction of Cl- movement through the paracellular pathway in the opposite direction (Figure 1.4) (Boucher, 1994; Chambers et al., 2007).
14 1.1.4.2 Kidney
In the kidney, ENaCs are expressed throughout distal convoluted tubules, connecting tubules, and collecting ducts where it functions as the rate-limiting step for Na+ reabsorption (Garty and Palmer, 1997). The importance of ENaC function in the kidney can be seen in patients with Liddle’s syndrome. These patients show blood volume expansion, hypertension, hypokalemina, low aldosterone levels, and metabolic alkalosis (Bhalla and Hallows, 2008; Shimkets et al., 1994). These clinical manifestations are due to the gain-of-function mutation introduced into the PY-motifs of β and/or γENaCs (Lu et al., 2007; Schild et al., 1995; Snyder et al., 1995). Different types of ENaC mutations have been identified in Liddle’s syndrome patients. For example, there is a premature stop codon that truncates the last 45–76 amino acids in the cytoplasmic carboxyl terminus of β and γ subunits and a frameshift mutation in the same C-terminal domain that prevents translation of the PY-motif (Melander et al., 1998). These mutations result in increased ENaC activity and consequently increase renal Na+ absorption (Shimkets et al., 1994). Interestingly, Liddle’s syndrome patients do not develop lung disease despite the expression of mutated ENaC in the lung (Mall et al., 2010). In the lung, expression of CFTR is sufficient to inhibit ENaC, demonstrating the importance of the microenvironment in the regulation of ENaC (Mall et al., 2010).
15
been identified, namely NR3C2, SCNN1A, SCNN1B, and SCNN1G, which code for the nuclear receptor subfamily 3 group C member 2, α-, β-, and γ-ENaCs, respectively (Chang et al., 1996; Pujo et al., 2007; Riepe et al., 2006; Strautnieks et al., 1996).
1.1.4.3 Colon
In the distal colon, ENaCs are expressed and function as the rate-limiting step for Na+ absorption. The channel’s importance can be seen in Crohn’s disease, a chronic inflammatory bowel disease (Palmer et al., 2012; Zeissig et al., 2008). Patients with Crohn’s disease have reduced levels of γENaC transcripts and therefore display decreased ENaC activity and impaired Na+ transport (Zeissig et al., 2008). Similarly, ulcerative colitis patients display decreased levels of β and γENaCs which also leads to impair Na+ transport (Dagenais et al., 2006; Picher, 2011). Reducing colonic sodium absorption contributes to increased fluid retention and hence diarrhea, one of the major symptoms of both Crohn’s disease and ulcerative colitis (Bhalla and Hallows, 2008). Conversely, CF patients display intestinal obstruction characterized by distension and constipation due to disruption in normal ENaC regulation in the colon (FitzSimmons, 1993; van der Doef et al., 2011).
1.1.4.4 Salivary glands
16
ion transport that leads to fluid secretion (Catalán et al., 2009). In the second stage, fluid flows through the ductal epithelium where the majority of NaCl is reabsorbed (Catalán et al., 2009). The salivary ducts are a tight, water impermeable epithelium, which absorb ions but not water, leading to hypotonic saliva (Martinez et al., 1966). Here, ENaCs play a role in the reabsorption of Na+ to produce the final form of saliva (Mangos et al., 1966; Martinez et al., 1966; Young and Schögel, 1966). Xerostomia, also known as dry mouth, is common in patients with autoimmune disorders such as Sjogren’s syndrome and during aging (predominantly in women after menopause) (Li et al., 2013; Thelin et al., 2008). It has been demonstrated that xerostomia is caused by the altered composition and secretion of saliva. While the specific mechanism has not been fully determined, it has been shown that the hyperactivity of ENaCs is one factor in aberrant saliva composition and secretion in xerostomia (Li et al., 2013; Thelin et al., 2008).
1.2. Short palate lung and nasal epithelium clone 1
17
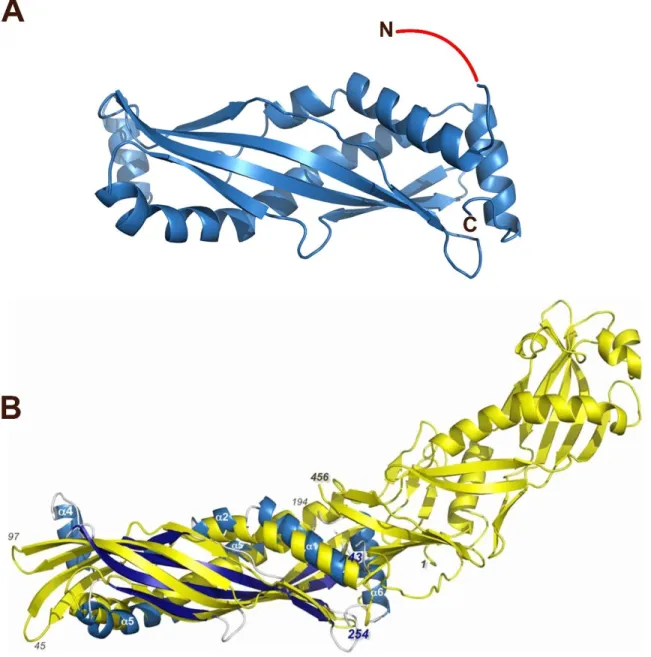
into secreted proteins (LeClair, 2003). A secreted, minimally glycosylated protein, SPLUNC1 has a molecular weight of approximately 25 kDa and is most abundantly found on the surface of the airway at an estimated concentration range of 10–250 μg/mL (Gakhar et al., 2010). The crystal structure of SPLUNC1 has been revealed to show that while the N-terminal half of BPI and SPLUNC1 shared structural similarity at the core, SPLUNC1 is different from BPI with two additional α helices flanking the core structure (Figure 1.5) (Garland et al., 2013).
1.2.1. SPLUNC1 expression
In the proximal trachea, kidney, colon, SPLUNC1 expression is high (Garcia-Caballero et al., 2009; Musa et al., 2012; Zhang et al., 2003). Particularly in the lung, SPLUNC1 expression has been observed in mucus cells of submucosal glands and their ducts, non-ciliated epithelial cells, and airway luminal secretions (Bingle et al., 2005; Campos et al., 2004). It is speculated that SPLUNC1 is produced by mucus cells based on the detection of SPLUNC1 in the mucous cells of the majority of glands, including submandibular and sublingual glands, but not in the serous cells of parotid glands (Campos et al., 2004; Vargas et al., 2008). Additionally, SPLUNC1 has been found in nasal lavage fluid and middle-ear effusion (McGillivary and Bakaletz, 2010), as well as in minor glands of the nose, sinus, posterior tongue, tonsil, and saliva (Musa et al., 2012; Vargas et al., 2008). However, SPLUNC1 is not expressed in the heart, liver, brain, placenta, skeletal muscle, pancreas, spleen, lymph nodes, peripheral lymphocytes, prostate, testis, or ovaries (Britto and Cohn, 2014; Di et al., 2003).
18
An increased level of SPLUNC1 has also been seen observed in salivary gland tumors (Yang Liu et al., 2013). Furthermore, SPLUNC1 mRNA levels have been shown to increase in patients with progressive idiopathic pulmonary fibrosis compared to patients with stable idiopathic pulmonary fibrosis (Chu et al., 2010). Also, the expression of SPLUNC1 mRNA was found to increase in non-small cell lung carcinoma (NSCLC), suggesting it is a positive marker for circulating NSCLC tumor cells (Barnes et al., 2008; Kim et al., 2007). Furthermore, in the stomach, increased levels of SPLUNC1 have been correlated to hepatoid adenocarcinoma (Sentani et al., 2008). Conversely, SPLUNC1 expression levels have been shown to be significantly decreased by inflammatory cytokines, particularly IL-13 (Chu et al., 2007). Likewise, decreased levels of SPLUNC1 have been detected in the nasal lavage fluid of cigarette smokers and allergic subjects (Britto and Cohn, 2015; Chu et al., 2007). Together, these studies suggest SPLUNC1 can be a useful diagnostic tool.
1.2.2 Functions of SPLUNC1
1.2.2.1 Antimicrobial
19
Haemophilus influenzae, Klebsiella pneumonia, and Burkholderia cenocepacia (Yang Liu et al., 2013; McGillivary and Bakaletz, 2010; Walton et al., 2016). These bacteria are Gram-negative, differentiated from Gram positive bacteria by the presence of an outer membrane that contains a high level of lipopolysaccharide (LPS). This suggests that SPLUNC1’s antimicrobial effects may be selective against Gram-negative bacteria (Di, 2011). Furthermore, SPLUNC1’s mechanism of antimicrobial action against P. aeruginosa and B. cepacia is bacteriostatic as it inhibits bacterial growth (Sayeed et al., 2013; Walton et al., 2016). This is different from BPI, which is bactericidal wherein it kills bacteria. While it is known that BPI binds to the LPS of Gram-negative bacteria, it is unclear whether SPLUNC1 exerts its bacteriostatic function on Gram-negative bacteria through the binding of LPS.
1.2.2.2 Surfactant
20
surfactant-like abilities play an important role in the middle ear, as shown by McGillivary and Bakaletz with chinchillas (McGillivary and Bakaletz, 2010). Reduced SPLUNC1 expression led to defective middle ear pressure, marked by retraction of the tympanic membrane (McGillivary and Bakaletz, 2010). Additionally, SPLUNC1 knock down in chinchillas resulted in a greater accumulation of mucus, suggesting that SPLUNC1 plays a role in mucociliary clearance.
1.2.2.3 ENaC Inhibition
21
22
23
24
25
26
Figure 1.5. Crystallographic structure of human SPLUNC1. (A) S18 of SPLUNC1 was not
27
Chapter 2: Automated Acquisition and Analysis of Airway Surface Liquid Height by Confocal Microscopy1
2.1. Introduction
The airway surface liquid (ASL) is a thin layer of salt, water and protein that lines the respiratory tract and facilitates innate immunity in the lung. ASL is comprised of two layers, one that is directly adjacent to the epithelial cells, which is called the periciliary liquid layer (PCL) and the other, called the mucus layer, which lies on top of the PCL (Kunzelmann and Schreiber, 2012; Schmid et al., 2011; Verkman et al., 2003). Maintaining hydrated ASL is important to provide a low viscosity environment for cilia to beat effectively and to propel mucus, pathogens and particles toward the mouth (Boucher, 1999; Kunzelmann and Schreiber, 2012; Verkman et al., 2003; Widdicombe, 2002). Furthermore, dehydrated ASL accelerates the development of mucus plugs, which can obstruct air flow and serve as focal points for bacterial colonization (Boucher, 2007; Cohen-Cymberknoh et al., 2013; Kunzelmann and Schreiber, 2012; Verkman et al., 2003; Zhou et al., 2011). ASL hydration is controlled by the transepithelial movement of ions and water (Boucher, 1999; Chambers et al., 2007; Kunzelmann and Schreiber, 2012; Verkman et al., 2003). At the apical membrane of airway epithelia, anions are mostly secreted by the cystic fibrosis transmembrane conductance regulator (CFTR) and Na+ is absorbed by the epithelial sodium channel (ENaC) (Boucher, 1999; Kunzelmann and Schreiber, 2012; Pilewski and Frizzell, 1999; Thibodeau and Butterworth, 2013; Verkman et al., 2003). In the case of cystic fibrosis (CF), where
28
CFTR is mutated and has disrupted or diminished function, the balance between anion secretion and Na+ absorption is altered (Boucher, 1999; Chambers et al., 2007; Kunzelmann and Schreiber, 2012; Pilewski and Frizzell, 1999; Verkman et al., 2003; Widdicombe, 2002). An absence of functioning CFTR leads to reduced anion secretion and triggers hyperactive ENaC that excessively absorbs Na+, which together leads to dehydrated ASL (Althaus, 2013; Boucher, 1999; Kunzelmann and Schreiber, 2012; Verkman et al., 2003). While calcium-activated chloride channels (CaCCs) are functional in CF airways, CaCC activity is short-lived and therefore cannot compensate fully for the loss of CFTR function in CF airways (Tarran et al., 2006b, 2001a). Consequently, ASL dehydration impairs mucociliary clearance and results in chronic bacterial infection of the lung (Boucher, 2007; Cohen-Cymberknoh et al., 2013; Kunzelmann and Schreiber, 2012; Pilewski and Frizzell, 1999; Verkman et al., 2003; Zhou et al., 2011).
29
measurements were also used to evaluate the efficacy of pharmacological agents such as drugs from Vertex including Ivacaftor and Lumacaftor for CF lung disease (Van-Goor et al., 2011, 2009).
A variety of methodologies have been proposed and used to measure ASL height. Light and electron microscopy techniques have been used to measure ASL in airways fixed in situ (Wu et al., 1998). A potential drawback of this method is that adding of fixatives during the sample preparation process may alter the ASL. For an alternative model, an in vitro well-differentiated cell culture system has been adopted to measure native ASL in live cells (Fulcher and Randell, 2013; Matsui et al., 1998a). Using this system, several methods have been proposed to measure ASL height: The surface laser reflectance microscopy (SLRM) method takes reflections of laser light to reconstruct an image of the mucosal surface (Thiagarajah et al., 2010). Light refraction microscopy measures refraction of light created by fluid meniscus to determine the volume of the meniscus at the interface between the culture and the wall of the culture insert (Harvey et al., 2011). Optical coherence tomography (OCT) measures the thickness of the ASL based on the reflectance of sample. This method requires micro-OCT instrument that produces cross-sectional images with 1 μm resolution (L. Liu et al., 2013). For another direct and non-invasive method of measuring ASL height, confocal microscopy method is used. This method is previously described in details (Tarran and Boucher, 2002; Worthington and Tarran, 2011). In brief, ASL is labeled with an ASL permeable but epithelium impermeable 10-kDa dextran conjugated with a fluorophore. Images of fluorescent labeled ASL are obtained using XZ scanning with a confocal microscope. Acquired images are analyzed to determine ASL height, which reflects the hydration state of ASL.
30
interest around the ASL by eye to obtain ASL height values in microns. However, this method is labor-intensive and time consuming, which together limit the throughput. Here, we propose and outline an automatic ASL measurement method that uses an automated stage on a confocal microscope to acquire images and automatic image analysis technique to make consistent and accurate ASL height measurements in a high-speed manner.
2.2. Methods
2.2.1. Primary human bronchial epithelial culture (HBEC)
HBECs were obtained from freshly excised bronchial specimens from normal and CF subjects (n = 4 donors for each type) and were harvested by enzymatic digestion as previously described under a protocol approved by the University of North Carolina Institutional Review Board (Fulcher and Randell, 2013). HBECs were cultured at an air-liquid interface in a modified bronchial epithelial growth medium with 5% CO2 at 37°C and were used 3-4 weeks after the seeding on 12-mm T-clear inserts (Corning-Costar, Corning, NY, USA). During image acquisition, HBECs were maintained in a modified Ringer Solution as described previously (Tarran et al., 2001a).
2.2.2. Confocal microscopy measurements of ASL
31
an automatic stage with the “Mark-and-Find” function, which is available for use in the Leica LAS AF Application Suite. With this function, one can preset multiple XY locations and the automatic stage then moves the culture to each stored location to acquire images. We then used our proposed automatic image acquisition and analysis methods. ASL height values from all the acquired images per culture were averaged to yield an n = 1. In some cases, a Zeiss LSM 510 confocal microscope and a 40x/1.2 NA water immersion lens was used (e.g. for the ATP stimulation experiments and the comparison between normal and CF HBECs). The Zeiss 510 was not equipped with an automatic stage, and in this case, 5 images per culture were obtained manually, as previously described (Tarran et al., 2006b).
2.2.3. ATP or dexamethasone stimulation and SPLUNC1 time-course and dose-response
32
For dexamethasone stimulation, 100 nM dexamethasone were incubated basolaterally 12-16 h prior to the apical delivery of dextran-tetramethylrhodamine. ASL measurement was made 4 h after the loading of dextran-tetramethylrhodamine.
2.2.4. Statistical analyses
All ASL height measurements were first subjected to the D’Agostino and Pearson omnibus normality test. Since not all ASL height data sets were normally distributed, we performed the nonparametric Kruskal-Wallis test followed by Dunns test for multiple comparisons among the time points or the dose treatments. SPLUNC1 time-course and dose-response experiments and ATP/dexamethasone stimulation experiments are reported as mean ± Standard Error of the Mean (SEM). Figure for ASL height distribution among different Mark-and-Find designs analyzes the overall performance of the technique and therefore is reported as mean ± Standard Deviation (SD). P < 0.05 was considered statistically significant.
2.3. Results
2.3.1. Automatic binarizing of images and finding boundaries of image subsections
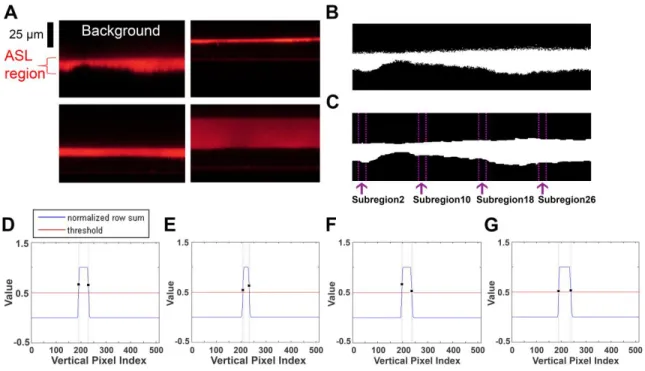
To test the proposed measuring technique, we gathered 212 fluorescent images of ASL. The image size was 5122 pixels, which corresponded to an actual area of 145 μm2. This image set included ASL heights that widely varied from very narrow to very wide (Figure 2.1A). Our measurement algorithm consisted of two main image processing techniques. The first one was Otsu’s threshold (Otsu, 1975), which uses an adaptive threshold to binarize an image and obtain a region of interest called the ‘foreground’ with the other region being called the ‘background.’ Here, adaptive means optimal to differentiate foreground from background under various conditions of
33
background and foreground. In an XZ scanned fluorescent ASL image, the foreground was the red-colored ASL region and the background was in black (Figure 2.1A). So, the red ASL region was selected and applied with Otsu’s threshold. Figure 2.1A shows a binarized image after applying Otsu’s threshold. Since the obtained ASL images are in 8 bit images, the minimum pixel value of 0 and the maximum pixel value of 255 are used to distinctively select the background and the foreground. A binarized image with noisy edges may result in an inaccurate detection of boundaries in the additional processing steps (Figure 2.1B). Therefore, in order to smooth out the ASL boundaries, we selected a series of morphological operations, which consisted of 2 iterations of dilation and 3 iterations of erosion, with dilation and erosion being two basic operations that are commonly used for image processing to detect edges, remove noise and enhance images (Choi and Oh, 2005). In this case, they were used to describe the turning on and off of the pixels along the boundaries of the ASL. By doing so, detected ASL boundaries were smoothed out (Openings et al., 1994; Whittaker and Robinson, 1924). The application of this series of algorithms resulted in the image shown in Figure 2.1C, which has no noisy pixels on its boundaries.
34
subsection. To prevent processing failures due to noisy bounce, which is a phenomenon where the background is mistakenly read as the foreground and vice versa, we performed a preprocessing step using a 5-point moving average to eliminate the noisy bounce of the profile (Figure 2.2A, B) (Kenney and Keeping, 1954; Openings et al., 1994). The 5-point moving average is a calculation that analyzes each pixel by creating a series of averages of the neighboring 5 pixels (Arce, 2005). Using this calculation, anything less than 5 pixels was regarded as an artifact. Following the noise reduction, the same threshold of 0.5 was applied to obtain a bipolar profile (Figure 2.2C); bipolar profiles assign 1 to the parts above the threshold and -1 to the parts below the threshold.
Filtering is a type of processing used to detect the exact location of the signal. Here, we used a filtering technique to detect the exact location of the ASL boundaries, namely, 7-point filtering which is a type of image analysis methodology based on 7 pixels. 7-point filtering consists of A = [-1 -1 -1 -1 1 1 1] for the rising edge detection, a location where the ASL region begins, and B = [1 1 1 -1 -1 -1 -1] for the falling edge, a location where the ASL region ends (Figure 2.2D, E). Upon experimental analysis, we found that any filtering below 7 pixels was unable to deal with the noisy peaks produced on the edges of ASL. On the other hand, filtering above 7 pixels was unnecessary because (i) the results did not improve any further and (ii) the increased filtering slowed the analysis speed. Thus, to maximize the speed of our algorithm whilst maintaining accuracy, we decided to use 7-point filtering.
35
2.2C that returns a value of +1 is aligned with the Point Index #5 with a value of +1 in Figure 2.2D. The -7 peak from Figure 2.2F is returned when the fourth integer of filter A (-1), is aligned with the last location from the left where the bipolar profile value is+ 1 in the equation (-1·1)+(-1·1)+(-1·1)+(-1·1)+(1·-1)+(1·-1)+(1·-1) = -7. In other words, it is where the first value of +1 from the right in Figure 2.2C is aligned with the Point Index #4 which returns a value of -1 in Figure 2.2D. Conversely, the graph in Figure 2.2G represents a falling edge that is characterized by having its first peak with a value of -7, followed by a second peak with a value of +7. These values are produced using the same logic of finding the rising edge. The first peak with a value of -7 occurs when the fourth value of filter B (-1), is aligned with the first point from the left where the bipolar profile value is 1. This results in the equation (1·-1)+(1·-1)+(1·-1)+(-1·-1)+(-1·1)+(-1·1)+(-1·1) = -7. The second peak with a value of 7 occurs when the third value of the filter B (+1), is aligned with the first point from the right where the bipolar profile value is 1 in the equation (1·1)+(1·1)+(1·1)+(-1·-1)+(-1·-1)+(-1·-1)+(-1·-1) = 7. Therefore, Figure 2.2G represents the alignment between Figure 2.2C and Figure 2.2E.
36 2.3.2. Finding the optimal number of subsections
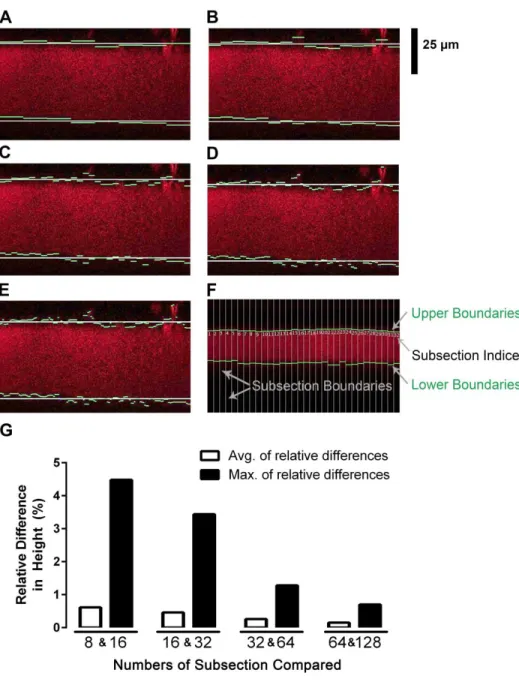
Figure 2.3A-E shows the analyzed ASL height images according to the specific number of subsections. The number of subsections directly affects the detected boundaries of the ASL region and hence the measured height. Although the number of subsections can be increased for more accurate boundary detection, the number should not be more than 128, because in such a case the width of a subsection decreases to ≤ 3 pixels, and the analysis of the histogram profiles becomes unreliable. Moreover, increasing the number of subsections decreases the speed of analysis (Table 2.1). The maximum difference of the measured heights between 8 and 16 subsections was 4.48% and that of 16 and 32 subsections was 3.44% (Figure 2.3G). However, the maximum difference of the measured heights between 32 and 64 subsections was 1.28 %, a value small enough to dismiss without any expectation to dramatically increase the accuracy of the result (Figure 2.3G). Since the purpose of the subsections is not to find exact boundaries of the ASL region but to calculate a representative ASL height, no more than 32 subsections is necessary. Therefore, for the optimal number of subsections, we decided to use 32 subsections of 16 pixels width (Figure 2.3F).
2.3.3. Finding valid subsections
37
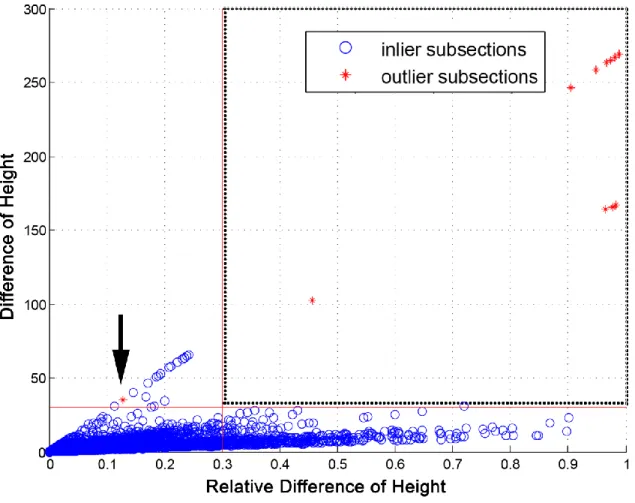
50% of the ASL regions were noisy, the ASL height analysis was unsuccessful and the data was mostly artifactual. However, when 40% or less of the ASL regions contained noise, then the ASL height analysis was consistently successful. Therefore, to maximize the selection of real ASL heights, while cautiously filtering out any artifacts, we used a median 60% threshold. The relative difference of height is calculated as the ratio of the absolute difference to the initial average height. Figure 2.4 shows the distribution of all subsections of the test image set in the feature space. Blue circles and red asterisks represent the ground truth inliers and outliers respectively. Although inliers and outliers are not completely separable in this feature space as seen in the graph, we can select sub-optimal threshold values for each dimension. The vertical and the horizontal red lines represent the relative difference threshold of 0.3 and the absolute difference threshold of 30 pixel respectively. We selected these values to tightly restrict the inlier boundary in order to minimize the loss of inliers while precisely excluding outliers. In the process of defining inliers and outliers, inaccurate selection of outlier rarely occurs. However, an example of a rare included outlier is shown at point ~(0.12, 40) in Figure 2.4 (see arrow). Moreover, the accuracy of the mean ASL height is not tempered as our algorithm is not dependent on individual data points and rather, is an aggregate of the data set.
38 2.3.4. Finding the optimal Mark-and-Find design
We next acquired XZ scanned images for each culture using the “Mark-and-Find” function on a Leica SP8 confocal microscope equipped with an automatic stage. The Mark-and-Find function allows the user to save multiple pre-determined locations and then to acquire images. Harvey and colleagues have previously shown that the edges of the cultures do not represent a thin film ASL due to meniscus that exists between the culture and the plastic sidewall of the culture insert (Harvey et al., 2011). Based on their work, anything outside ~0.6mm from the edge can be counted as “thin film” when using 12mm diameter Transwell culture inserts (Harvey et al., 2011). We designed 5 different Mark-and-Find protocols, ranging from 5 to 40 saved locations per protocol (Figure 2.6A) and all locations for our Mark-and-Find functions were designed to avoid the meniscus-containing edges of the cultures. An automatic stage positioned each culture to pre-saved locations to acquire one image per location at a rate of ~1 image/s. Immediately after the loading of the dye, there was an increase in the ASL volume due to the addition of the liquid vehicle (20 μL PBS). We found that ASL absorption to the steady state level of ~7 μm took approximately 4 h. Therefore, we acquired ASL images 4 h after the loading of the dye to look at the distribution of ASL heights. All the images acquired for each of the Mark-and-Find designs were analyzed using our proposed automatic analysis method to obtain ASL heights and the data set was plotted as histograms (Figure 2.6A). From the histograms, it was appeared that the recorded ASL heights were not normally distributed (Figure 2.6A). Further analysis using D’Agostine and Pearson’s omnibus normality test revealed that all of the data sets had P values <0.0001, indicating that they failed to pass the normality test and were skewed.
39
obtained when the marked locations densely covered the entire culture and the images acquired at those locations were analyzed. Therefore, within our Mark-and-Find designs, the most representative ASL height was obtained using the 40 images/culture design to give an averaged ASL height (Figure 2.6A). Figure 2.6B shows distribution of the averaged ASL heights obtained for each of the Mark-and-Find design. Each data point in Figure 2.6B represents a mean ASL height from each culture. The same cultures were reimaged using each of the 5 different Mark and Find algorithms. The distribution of the average ASL heights was wider when fewer images were taken per culture (Figure 2.6B). The mean values of the averaged ASL heights were 8.32 ± 1.15 μm, 8.17 ± 1.11 μm, 8.13 ± 0.79 μm, 8.09 ± 0.80 μm, and 7.88 ± 0.86 μm for 5, 10, 20, 30, and 40 images/culture design respectively (Figure 2.6B).
2.3.5. Applications of the proposed automated method
40
point to see the significant difference in the hydration state of ASL was at 4 h. Therefore, we selected this time in order to perform a dose-response of the effect of SPLUNC1 on ASL height. The ASL height with 1 μM SPLUNC1 after 4 h was 9.00 ± 0.48 μm and at this concentration, ASL height was significantly different from all the lower dosages (P < 0.05; Figure 2.7B). The average ASL height continued to increase significantly with 10 μM and 25 μM with the measured ASL height of 9.95 ± 0.21 μm and 11.94 ± 0.50 μm respectively (Figure 2.7B). Treatment with 100 μM SPLUNC1 resulted in the measured ASL height of 11.75 ± 0.54 μm (Figure 2.7B). The IC50 of SPLUNC1 was 6.53 μM. As a second validation, we also used dexamethasone to increase the activity of ENaC (Tchepichev et al., 1995). To test whether our automated analysis approach could be applied to other confocal systems, we then obtained images from normal and CF HBECs using a Zeiss 510 confocal microscope that was equipped with a manual stage. Analysis of data acquired in this fashion revealed a significant difference in ASL height between normal and CF HBECs (Figure 2.7C). We then activated Cl-/ASL secretion by exposing these HBECs to ATP, which was added as a dry powder in perfluorocarbon (Tarran et al., 2001b). For normal HBECs, addition of 300 μM ATP significantly increased the ASL height from 8.85 ± 0.49 μm to 15.66 ± 1.06 μm. For CF cultures, the same ATP stimulation significantly increased ASL height from 4.82 ± 0.72 μm to 9.09 ± 1.16 μm (Figure 2.7C).
2.4. Discussion
41
efficient mucus transport (Matsui et al., 1998a; Song et al., 2009; Tarran et al., 2001b). Moreover, this technique has been used to investigate the efficacy of therapeutic agents for CF and COPD (Astrand et al., 2014; Tarran et al., 2001b; Van-Goor et al., 2009). To reduce the time-burden of manually acquiring and analyzing ASL images, we have designed a novel automatic image acquisition and analysis method. Using this technique, image acquisition and analysis were relatively easy, quick and unbiased.
2.4.1. Summary of the algorithm
Our algorithm requires 60 % of the ASL region to be detected in order to set inlier and outlier boundaries. In our cell culture system, it is not difficult to meet this requirement. For a more robust elimination of outlier subsections, the RANSAC (Random Sample Consensus) technique can be applied instead of using median 60 % of subsections (Fischler and Bolles, 1981). RANSAC randomly selects subsections to create a pool of inliers and therefore does not require a large amount of inliers to eliminate outliers. However, this process needs a very long time to search all of the inliers and outliers, especially when inliers are small. So, the computational cost of RANSAC is higher than the median technique of the proposed measuring algorithm. This is a trade-off between computational cost and robustness.
42
optimal characteristics. This super-fast speed may be advantageous when dealing with even larger quantities of fluorescence images.
2.4.2. Parameter settings
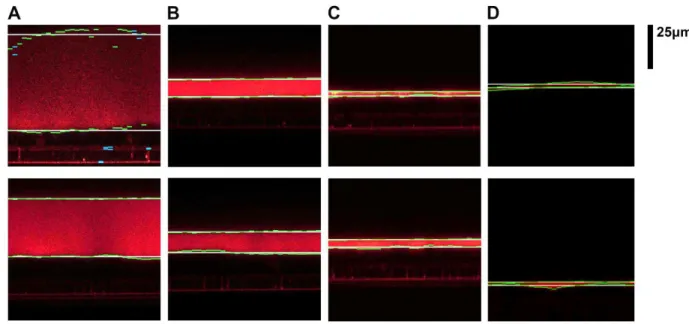
When our proposed automated image analysis with 32 subsections as a parameter was used to measure ASL height, the values repeatedly remained the same and there was no error in computation or no exceptional failure in running the algorithm of the proposed measuring techniques (Table 2.2). Our measurement method accurately found the real boundaries (green lines), average of boundaries (white), and the outlier subsections (blue) in all conditions where the height of ASL, brightness of the image, and the clarity of the boundaries varied from image to image (Figure 2.5). Moreover, our method can read ASL images from different types of microscope, and with different lenses, so long as ASL region is shown using a standard 8 or 16 bit grayscale look-up table. While the threshold parameters are experimentally determined, in the case of ASL images with dimmer fluorescent labeling, those parameters can easily be modified, e.g. by multiplying each image by a suitable integer (e.g. 2) using a program such as Image J (NIH Freeware), which only has a small effect on the background, can enhance the foreground/ASL image.
2.4.3. Mark-and-Find analysis
43
we concluded that while using the design of 5 images per culture produced a sufficiently reliable data set, the most precise data set for ASL height measurement was obtained when acquiring 20 images/culture. Additionally, since HBECs can vary in cell layer thickness, even within 1 culture, it sometimes happens that 1-2 images per culture are out of the field of view and/or unreadable. However, even with this error rate, this still leaves enough ASL images to perform a thorough analysis, and in the interest of throughput, we have found that it is better to discard unusable images, rather than to try to reimage them.
2.4.4. Application analysis
Using our method, we were able to rapidly generate a time-course to show that SPLUNC1’s ability to inhibit ENaC lasted for 8 h and a dose-response curve to show that the maximum efficacy of SPLUNC1 for inhibiting ENaC was at 25 μM and with an IC50 of 6.53 μM (Figure 2.7A, B). Moreover, our method is suitable to study the physiological function of ion channels such as ENaC. We were also able to demonstrate that our program can detect differences in ASL height between normal and CF HBECs. As previously described (Matsui et al., 1998a), basal ASL height was significantly different in normal and CF HBECs (Figure 2.7C). We next tested whether our method could detect changes in ASL height following the activation of Cl- secretion with mucosal ATP. Both normal and CF HBECs elicited a significant response to ATP (Figure 2.7C). However, the magnitude of the response was significantly greater in normal and CF HBECs (Figure 2.7C). ATP is rapidly metabolized to adenosine by ecto-enzymes in the ASL (Lazarowski and Boucher, 2009). As such, ATP (and its breakdown product adenosine) are predicted to activate CaCC and CFTR respectively in normal airway epithelia. In contrast, ATP can activate CaCC in CF HBECs, and while adenosine is likely still formed, adenosine’s effector (CFTR) is absent from CF HBECs.
44 2.4.5. Concluding remarks
For this paper, we automatically acquired ASL images from one 12 mm diameter culture at a time, which was placed in a chamber on the inverted confocal microscope prior to imaging. While our method can be theoretically applied to cultures placed in 12 well dishes or in other multi-well systems, the cultures would need to be sufficiently close to the bottom of the chamber to stay within the working distance of the objective lens (our 63 x glycerol objective lens has a working distance of 300 µm). When cultures are placed in commercially available 12-well plates, the distance between the objective lens and the ASL exceeds this range and the ASL cannot be imaged. However, should new 12, 24 or 96-well plates become available which were redesigned to place the cultures closer to the lens, then our technique could be modified appropriately, which would be predicted to significantly increase the throughput of the imaging.
45 Subsection
configuration
8 subsections
16 subsections
32 subsections
64 subsections
128 subsections
Elapsed time 22.8 ms 27.4 ms 36.3 ms 56.1 ms 91.5 ms
47
48
49
50
51
52
53
54
Chapter 3: SPLUNC1 Dissociates and Endocytoses ENaC
3.1. Introduction
Cystic fibrosis (CF) is the most common fatal genetic disease in Caucasians and affects epithelia of multiple organs, including the pancreas, lungs, sweat glands, gastrointestinal tract, liver, and reproductive tract. The CF gene product, the cystic fibrosis transmembrane conductance regulator (CFTR), is an ATP-binding cassette (ABC) transporter that acts as an anion channel. The lack of a functional CFTR not only diminishes anion secretion but also causes excessive Na+ absorption through ENaCs (Knowles and Boucher, 2002). Consequently, ASL is dehydrated, contributing to mucus stasis and an increased chance of bacterial infection (Boucher, 2007). The airways of patients with CF are mildly acidic due to the lack of bicarbonate transport through the CFTR (Coakley et al., 2003; Poulsen et al., 1994). CFTR directly inhibits ENaC and therefore, lacking or reduced function of CFTR also contributes to ENaC dysregulation and ASL dehydration (Garland et al., 2013; Gentzsch et al., 2010). Acidic ASL, together with ASL dehydration, impairs the innate defense system of lungs in patients with CF and leads to chronic colonization with opportunistic bacteria (Delhaes et al., 2012; Govan and Deretic, 1996).
55
heterotrimeric sodium channel comprised of α, β, and γ subunits (Butterworth, 2010; Rossier and Stutts, 2009). Each subunit has two transmembrane domains, a large extracellular loop, and intracellular N- and C-termini (Butterworth, 2010; Rossier and Stutts, 2009). Alone, αENaCs can conduct Na+, but at a reduced level compared to αβγENaCs, while βENaCs alone is nonfunctional (Canessa et al., 1994; Firsov et al., 1996). To optimally conduct Na+, the expression of α, β and γ subunits is required (Firsov, 1998; Kellenberger and Schild, 2002). At the plasma membrane of airway epithelia, ENaCs are finely regulated by changing the channel open probability (Po) and/or the number of plasma membrane ENaCs (N). While Po is mostly determined by proteolytic cleavages at αγENaC extracellular loops, N is mostly determined by ubiquitination-dependent endocytosis (Butterworth, 2010; Eaton et al., 2010; Palmer et al., 2012; Staub et al., 2000). Ubiquitination of ENaCs is mediated by the ubiquitin ligase Nedd4-2, known to interact with the PY motif located at each subunit’s C-terminus (Snyder et al., 2004b). A failure to appropriately ubiquitinate an ENaC due to mutations in the β and/or γENaC leads to Liddle’s syndrome: overactive ENaCs in the kidney. This leads to Na+-dependent hypertension (Knight et al., 2006; Lu et al., 2007; Staub et al., 2000). Furthermore, it has also been demonstrated that Nedd4-2 knockout mice exhibit salt-induced hypertension and elevated ENaC activity, leading to lung dehydration (Boase et al., 2011; Kimura et al., 2011; Shi et al., 2008).