Viewing America’s Energy Future
in Three Dimensions
EDITED BY
L. Louis Hegedus and Dorota S. Temple
CONTRIBUTING AUTHORS
Viewing
America’s Energy Future
in Three Dimensions
EDITED BY
L. Louis Hegedus and Dorota S. Temple
CONTRIBUTING AUTHORS
Robert H. Beach, Philip C. Cooley, Allen P. Duffer,
Michael P. Gallaher, L. Louis Hegedus, Markus Lesemann, Toby H. Moore,
Edo D. Pellizzari, and Dorota S. Temple
©2011 Research Triangle Institute. RTI International is a registered trademark and a trade name of Research Triangle Institute. The RTI logo is a registered trademark of Research Triangle Institute
This work is distributed under the terms of a Creative Commons Attribution-NonCommercial-NoDerivatives 4.0 license (CC BY-NC-ND), a copy of which is available at https://creativecommons.org/licenses/by-nc-nd/4.0 /legalcode.
Library of Congress Control Number: 2011934380 ISBN 978-1-934831-05-2
RTI Press publication No. BK-0006-1106
https://doi.org/10.3768/rtipress.2011.bk.0006.1106 www.rti.org/rtipress
This publication is part of the RTI Press Book series. RTI International
3040 Cornwallis Road, PO Box 12194, Research Triangle Park, NC 27709-2194 USA [email protected]
www.rti.org
The RTI Press mission is to disseminate information about RTI research, analytic tools, and technical expertise to a national and international audience. RTI Press publications are peer-reviewed by at least two independent substantive experts and one or more Press editors.
Contents
Preface v
Acknowledgments vi
Chapter 1. Introduction
1
Chapter 2. Energy Technologies
5
Chapter 3. Energy Economics
25
Chapter 4. Societal Dimension of America’s Energy
Challenge
47
Chapter 5. Future Research Needs
79
References
91
Appendix. America’s Energy Future: Technology and
Transformation —Excerpts of Interest for
Societal Research
101
About the Authors
107
iv
Figures
Figure 2.1. US energy use in quads, 2008
6
Figure 2.2. US carbon dioxide emissions in
million metric tons, 2008
16
Figure 3.1. Coal prices (in 2005 dollars), 1949–2009
27
Figure 3.2. US proved oil reserves, 1900–2008
28
Figure 3.3. US oil consumption and oil prices, 1973–2010
29
Figure 3.4. US oil production and oil imports, 1920–2010
30
Figure 3.5. Natural gas wellhead prices, 1976–2010
31
Figure 3.6. Uranium (U
3O
8) prices, 1988–2010
32
Figure 3.7. ADAGE model structure
45
Tables
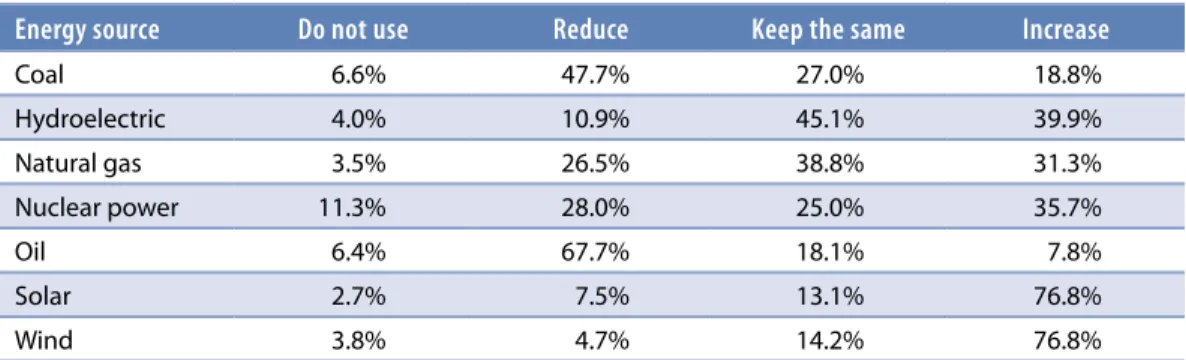
Table 4.1. Distribution of preferences about energy sources,
2007 (percent)
64
Table 4.2. Major oil exporters to the United States, 2008
69
v
Preface
This monograph resulted from research and discussions conducted by the RTI International Energy Grand Challenge Working Group, which formed in 2009 within the framework of the RTI Fellows Program’s Grand Challenge Initiatives. These initiatives confront major, urgent challenges facing the United States (and, indeed, humanity) that can benefit from the kind of integrated, multidisciplinary analysis that a diverse, independent research institute like RTI can provide.
The Energy Grand Challenge Working Group consisted of representatives of RTI’s technology, economics, and social science research functions who set out to explore the energy challenge as an intersection of three domains: technology, economics, and societal factors. Although, from the beginning, ours was an integrative approach, we have relied on the expertise of group members in their respective disciplines. In the energy technology domain, the group and the writing were led by L. Louis Hegedus; in the economics domain, by Robert H. Beach; and in the societal factors domain, by Toby H. Moore.
The objective of this work was to help frame the ongoing discussion of America’s energy future in the context of all three dimensions—technology, economics, and social sciences—and to draw attention to research needs pertaining to the intersection of the societal factors domain with technology and economics. We hope that the proposed research will identify tools and techniques for not merely overcoming, but in fact harnessing, societal forces for the creation of a better energy future for our nation.
L. Louis Hegedus and Dorota S. Temple, Editors
vi
We acknowledge many valuable discussions with RTI staff members. We thank David F. Myers for his role in initiating this project, James A. Trainham for valuable discussions, RTI Press former Editor-in-Chief Kathleen N. Lohr for her involvement and support during the preparation of the monograph, and Vikram Rao (of the Research Triangle Energy Consortium) for his interest in the study and insightful comments. Finally, we express our gratitude to the RTI Executive Leadership Team for initiating and supporting the Grand Challenge Initiatives of the RTI Fellows Program.
Introduction
Chapter 1
The late Richard Smalley, Nobel Prize–winning chemist and codiscoverer of a new allotropic form of the element carbon (buckminsterfullerene, C60), which prompted the
onset of the nanotechnology wave, delivered a much-quoted presentation in 2003 on humanity’s top ten problems for the next 50 years.1 He concluded that the most important
issue and, therefore, the greatest challenge facing humanity is energy. In order of declining significance, the other problems were water, food, the environment, poverty, terrorism and war, disease, education, democracy, and population. All the challenges that follow energy are influenced and often dominated by energy; conversely, many of these other challenges have important implications for how the energy challenge may best be addressed.
At least three major viewpoints define how the US energy challenge is considered. Some view it primarily through climate-change considerations, related to carbon dioxide (CO2) accumulation in the atmosphere and its actual or anticipated consequences. Others
view it through the issues of energy security, pertaining to imported oil and related security and defense challenges, while yet others view the energy challenge primarily through its economic contexts, such as oil prices and price instabilities, impact on the US economy, trade balance, and impact on US currency.
Associated with these viewpoints are many additional concerns, including
sustainability (how long the world’s oil, natural gas, uranium, and coal supplies will last); globalization (the impact of rapidly growing energy demand in developing countries and the related economic, political, and environmental issues); regulation and taxation (how the government should respond to the energy challenge); politics (local and national constituencies, party ideologies); public preferences (impact of energy considerations on the quality of life and standard of living, or perceived balance between convenience and environmental responsibility); and the status and potential of technological developments (the balance between technologies that are available now, those that will be available in the near future, and those that may become longer-term “game changers”).
2 Chapter 1
sustainability, support long-term economic prosperity, promote energy security, and reduce environmental impacts.”2(p1) A series of reports resulted from the work, including
America’s Energy Future: Summary of a Meeting;3America’s Energy Future: Technology
and Transformation;2 and Real Prospects for Energy Efficiency in the United States.4 Also of
significance to our analysis is a recent National Research Council report, Hidden Costs of Energy: Unpriced Consequences of Energy Production and Use.5
We can group the issues considered in these reports into three main categories:
technological, economic, and societal considerations. America’s Energy Future: Technology and Transformation2 concludes that of these three, the “weakest link” is an insufficient
understanding of the societal dimension. Accordingly, the report makes extensive calls for more data, analysis, and recommendations from the societal research disciplines. It concludes that “mobilization of the public and private sectors, supported by sustained long-term policies and investments, will be required for the decades-long effort to develop, demonstrate, and deploy these technologies.”2(p1)
The report emphasizes the need to consider “policy and societal factors that would enhance or impede technology development and deployment”2 (p10) and observes that a
“study on energy conservation would require, for example, an in-depth understanding of how societal, economic, and policy factors affect energy consumption.”2(p33) It refers to a
“behavioral gap” that hinders the introduction of energy-efficient technologies, despite their economic advantages, and calls for continuing research to understand this gap more fully so that strategies can be devised for closing it.2(p50) Other societal research needs
listed in the report include land use considerations in siting renewable technologies, opportunities for incentivizing businesses and the public, and opportunities for energy education. (For a collection of report excerpts pertaining to the societal dimension, see the appendix.)
The committee’s call for the societal analysis of the US energy equation has motivated us to address this important topic and thereby provide a societal research–focused complement to the National Academies’ technology-focused effort. Our approach
Introduction 3
Energy technology and energy economics are necessary, although not sufficient, conditions for solving the energy conundrum; the sufficient condition derives from the societal dimension. Before developing the arguments grounded in the societal dimension, we provide, in Chapters 2 and 3, an overview of energy technologies and energy
economics, respectively.
We discuss energy technologies in terms of their infrastructure, as the National Academies’ report did. In our description of energy infrastructure, we point to those aspects that couple strongly with economics and social science knowledge gaps that need to be filled by new research. Similarly, we discuss energy economics in its technological and social context, establishing the basis for next discussing the societal dimension.
Energy Technologies
Chapter 2
Technology is based on the application of the laws of nature, which are immutable. Superimposed on technology are the conditions of economics (nothing can be
implemented that cannot be funded) and societal driving forces and constraints. In the discussion of energy technologies, we highlight societal concerns as appropriate.
Energy Infrastructure
We discuss energy technologies according to the energy infrastructure they serve. A nation’s energy infrastructure is its collection of resources, facilities, equipment, and systems for the exploration, extraction, conversion, storage, distribution, and use of primary and secondary energy sources.
Energy technologies can be defined as the intellectual property (patents and know-how) that are required to operate the energy infrastructure. All energy technologies have some common characteristics; these have to be considered when comparing the technologies or when technology preferences and technology portfolios are discussed. These common characteristics include their thermodynamic, operating, and material efficiencies; capital and operating costs; scale and scalability (modularity); environmental, health, climate, political, security, defense, and market risks and impacts; technological and market maturity; economic, resource, and environmental sustainability; and the trajectory and slope of their evolution, including their potential for breakthrough developments.
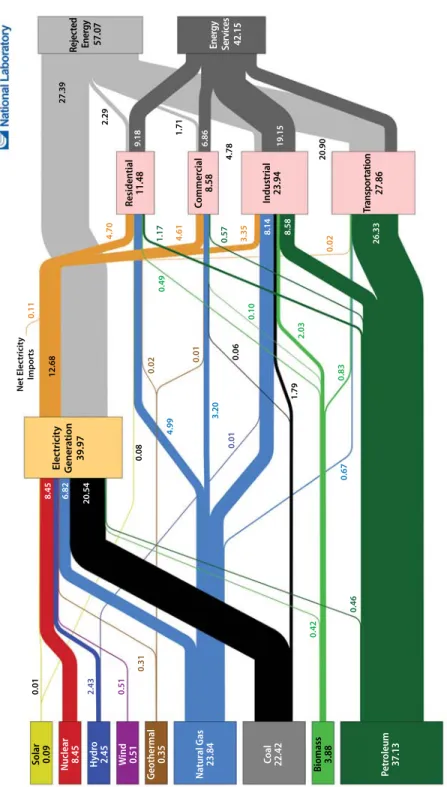
The US energy infrastructure is famously depicted in energy flow charts published yearly by the Lawrence Livermore Laboratory of the US Department of Energy.6
Figure 2.1 is the 2008 US energy flow chart on which our discussion throughout this chapter is based.
In 2008, the United States used 99.2 quads of energy from the primary energy sources shown in Figure 2.1. (One quad equals 1015 British thermal units, or BTUs). Of the
6 Chapter 2
Figure 2.1. US energy use in quads, 2008
Not
es: All ener
gy flo
w
s ar
e sho
wn in quads (
quadrillion), or 10
15 British thermal units (B
TU
s). F
or the c
on
versions of quads t
o other units of ener
gy and t
o quad-equiv alen t con ven tional quan tit y measur
es of elec
tricit
y, na
tur
al gas
, oil
, and c
oal
, see the e
xc ellen t documen t Americ an P hysic al S ociet y Ener gy Units . 7 Sour ce: A dapt
ed with permission fr
om the La
wr enc e Liv ermor e Na tional Labor at or y. 8
Solar 0.09 Hydr
o
2.45 Wind 0.51
G
eothermal 0.35 Natur
al G
as
23.84 Coal 22.42 Biomass 3.88
Petr oleum 37.13 Nuclear 8.45 Elec tricit y G ener ation 39.97
0.01 2.43 0.51
0.31 0.42 0.46 0.67 1.79 0.01 0.06 0.10 2.03 8.14 4.99 3.20 0.02 0.08 0.01 0.49 0.83
8.45 6.82 20.54
Energy Technologies 7
energy. Biomass, counted as a renewable source, contributed 3.88 quads (3.9 percent), 21 percent of which went for transportation. Approximately one-third of the total US energy consumption came from imported sources.
Some notable facts about the primary US energy sources:
• Despite all efforts to expand the use of renewable sources (solar, hydroelectric, wind, geothermal, and biomass in Figure 2.1), they remain a small proportion of sources overall (7.3 percent).
• All of nuclear power and 91.6 percent of coal are used to generate electricity. • Transportation consumes 70.9 percent of the petroleum used in the United States. • Almost all energy imports are petroleum; in 2009 about 62 percent of petroleum and
petroleum products consumed in the US came from imports. • Only 2.8 percent of natural gas is used for transportation.
Energy Sources
In this section we discuss the key US energy source technologies. They each have a large literature that is extensively cited in the National Academies reports.2-5 Unless stated
otherwise, the numerical data quoted in this chapter are from the US Department of Energy’s Energy Information Administration database.9
Sustainable energy Sources
A number of primary energy sources are sustainable (i.e., considered inexhaustible or renewable). Among these sustainables are hydroelectric, geothermal, thermal, solar-electric, wind-solar-electric, wave-solar-electric, and biomass energy sources.
Hydroelectric
Hydroelectric energy generation (2.45 quads in 2008, 2.4 percent of the total) depends on suitable geography; it is perceived to be almost fully developed in the United States.
Geothermal
8 Chapter 2
geothermal technologies include hot (steam) wells drilled to a depth of up to 10 kilometers; this technology, if realized, would mitigate the current geographic limitations.
Solar
Solar energy (0.09 quads in 2008, 0.09 percent of the total) has a high but declining levelized cost (combination of capital and operating expenses, expressed as the cost of a unit quantity of energy) due to high capital expenses; therefore, to be competitive today, it requires government subsidy or needs to find niche, less cost-sensitive applications.
Solar technologies are either solar-electric or solar-thermal; solar-electric technologies involve crystalline silicon (efficient but expensive), thin film (less efficient but also less expensive), and amorphous silicon (cheapest but inefficient). Solar-thermal technologies involve nonfocused sunlight for heating water or focused sunlight to generate high temperatures that can be used directly (steam turbines) or indirectly (via pyrolysis of agricultural waste into syngas, a mixture of hydrogen and carbon monoxide, followed by catalytic processing into solar biofuels).
Challenges of solar energy include intermittent operation (requiring energy storage) and the need to operate at sunny, often remote locations (requiring a “smart grid” that would compensate for the uneven spatial and temporal distribution of this form of electricity). The solar plant’s footprint is a function of solar irradiation intensity and of the areal efficiency of the solar cells or solar collectors.
Wind
Some of the challenges of wind energy (0.52 quads used in 2008, 0.5 percent of the total) are similar to those of solar energy. Both are capital intensive, intermittent, and often remote, and at present both require subsidies, energy storage, and a smart electric grid. Some issues with wind energy are associated with changing the landscape, as wind turbines tend to be huge installations, or that they interfere with birds and other wildlife, such as bats. Additional challenges include the need for addressing reliability and maintenance requirements, such as periodic cleaning to remove debris, life expectancy, and recyclability of the structures and components.
Energy Technologies 9
is highest in the winter, when wind speeds there are also at their peak. Because of this temporal and geographic variability, wind power is a complementary energy source to traditional sources and needs to be integrated into the power grid in coordination with other forms of electrical generation.
Tidal and Wave
In theory, tidal and wave energy offers an inexhaustible source of mechanical energy that can be converted into electricity by means of electric generators. The first tidal power plant was built in France in the early 1960s (La Rance, 240 MW). High capital costs and geographic site limitations constrain the development of this primary source of electric energy.
Biomass
Biomass (3.88 quads in 2008, 3.9 percent of the total) represents a significant but complex and, by its nature, somewhat limited opportunity to contribute to the US energy balance equation. Involved are biomass-based fuels and gasoline admixtures (ethanol), and biodiesels based on chemically processed vegetable oils. Some of the complexity comes from the present-day primary source of bioethanol (subsidized corn), which can compete with food needs, or from complex performance issues (e.g., biodiesels and vegetable oil–based aviation fuels have to conform to complex chemical, shelf-life, and physical property standards previously established for petroleum-based fuels). Biomass-based fuels are categorized as renewables in that they involve a short-term carbon cycle: plants incorporate CO2 taken from the atmosphere (with sunlight as the energy source) to form
plant material such as sugars and cellulose, which can serve as feedstocks for liquid fuels. Although biomass is renewable, the actual renewal of biomass-based primary energy sources is predicated upon human involvement to renew them via agricultural activities.
Intense research is underway to use agricultural waste for producing fuels. Agricultural wastes are mostly cellulosic and require complex (thermochemical, catalytic, enzymatic, or pyrolitic) processes to convert them into intermediates that can be processed into fuels. Some plans call for harnessing the sun’s focused thermal energy to provide the gasification temperatures. All plant-based processes are limited by land availability and by the economic collection radii (currently perceived to be about 40 miles around the fuel plant, depending on the particulars of fuel source, conversion process, and the resulting energy carrier). Some biomass-based energy conversion processes are viewed as being net energy producing (despite the needs of plowing, seeding, fertilizing, harvesting, and collecting), and they are also viewed as CO2-neutral in that they tend to recycle CO2 from
10 Chapter 2
Depletable energy Sources
Most of the United States’ conventional energy sources are depletable; they include the fossil fuels coal, oil, and natural gas, as well as nuclear energy.
Coal
The United States has hundreds of years’ worth of coal (22.42 quads in 2008, 22.6 percent of the total) at current rates of consumption. Coal is the most important commodity carried by rail, at about 44 percent of Class I rail tonnage; about two-thirds of US coal shipments are by rail. Ninety-two percent of coal is used for electricity generation; 51 percent of US electricity is generated by burning coal.
Coal is central to the current energy debate. The nation’s ability to address this primary energy source intelligently will significantly affect the US energy future. Although coal is abundant, cheap, and domestic, it is beset with some major externalities (we discuss these unaccounted-for costs further in Chapter 3). These externalities include pollution in the form of sulfur and nitrogen oxides, mercury emissions, and about 300,000 tons of ash per GW-sized power plant per year, assuming 10 percent ash content of the coal.10 In addition,
coal-fired power plants are the most prolific sources of CO2 emissions, both in absolute
terms and on the basis of tons per kilowatt-hour (kWh); therefore, these plants are implicated in the atmospheric accumulation of this greenhouse gas. Furthermore, open-face coal mining, a method widely employed in the United States today, has a significant environmental and ecological impact.
Given coal’s importance, it is no wonder that major efforts are underway (political, economic, scientific, engineering) to deal with its challenges. Among these efforts are increasingly complex and expensive methods to control flue gas emissions,
thermodynamically more efficient boiler and generator technologies (including so-called combined cycles with higher overall thermodynamic efficiency), and projects aimed at concentrating and storing (“sequestering”) CO2 emissions. Sequestering CO2 is associated
with increased capital and operating costs of electricity, a significantly derated power plant capacity, and as of yet unresolved storage technologies and storage site liabilities, so its viability has not yet been established.
Further complicating coal’s role is the fact that the two largest developing economies, China and India, are also heavily coal fueled. This fact poses unresolved political issues regarding the contribution of these countries to potential global CO2-reduction programs,
Energy Technologies 11
So far it has been economical to control pollutants (mostly sulfur and nitrogen oxides) in the flue gases of coal-fired power plants. However, the economics of CO2 sequestration
(separation, concentration, storage) will have to be compared with the economics of alternative ways of reducing CO2 emissions, such as increased reliance on other primary
energy sources (more nuclear, more natural gas, more solar, more wind) or energy-saving technologies in the energy-consuming sectors such as industrial, construction, and transportation. Given the recently discovered large potential US natural gas reserves (shale gas),11 it is likely that many of the newly constructed power plants will be fueled by
natural gas, followed in time by a mix of natural gas and nuclear.
Oil
In 2009 the United States used about 22 percent of the world’s oil output: of this, 72 percent of US oil consumption was for transportation and about 22 percent for industrial purposes, including the manufacture of chemicals. Only 1 percent was used in electricity generation. US domestic oil production peaked in 1970 (at 9.6 million barrels per day) and is now in decline. Oil imports grew to exceed domestic production beginning in 1993. In 2009 about 61 percent of US oil consumption was from imports, and a significant, although not dominant, portion of the imports came from countries with challenging economic, political, national security, or military issues (Middle East, Africa, South America). As of this writing, we are witnessing political upheavals in the Middle East, some in the major oil-producing countries. These events will surely impact oil supply security and oil prices and price stability, as well as the fate of alternative energy technologies.
Foreign oil reserves are increasingly owned by national corporations that are controlled by governments. Some of the main oil transportation routes from the Middle East (35 percent of the world’s oil passes through the Strait of Hormuz, and 34 percent passes through the Strait of Malacca) require military protection, a heavy cost burden to the US taxpayer.
Twelve percent of the known domestic US oil reserves exist under lands protected by environmental laws and, therefore, are not currently accessible for production.
12 Chapter 2
stimulating the reservoirs, or advanced drilling techniques such as deep-water offshore drilling and horizontal drilling. Finally, very large oil reserves are available from oil shale, but it is expensive to process with the use of conventional technologies and is beset with potential environmental liabilities. It is unlikely that all oil resources will be fully exhausted before more of our transportation infrastructure switches to other energy sources for propulsion.
Oil-fueled transportation has depended on the internal combustion engine, a device that is substantially limited by the inefficiency of the Carnot thermodynamic cycle (interestingly, the Carnot cycle would be quite efficient if internal combustion engines could operate at much higher temperatures, but such internal combustion engines are currently perceived to be beyond practicality). The ongoing large effort to replace the Carnot cycle with electric propulsion is aimed at mitigating our dependence on oil, freeing the use of more of that substance for alternative, more efficient, and higher-valued uses, such as the manufacture of chemicals, plastics, and pharmaceuticals.
Natural Gas
In contrast to oil, natural gas is not easily portable across oceans. Its cryogenic storage and transportation are commercially viable but expensive and therefore limited. However, natural gas can be safely and economically transported and distributed by continental pipelines. Relatively speaking, it is a cleaner source of thermal energy. For the same amount of electricity produced, a natural gas–fired power plant emits about half of the CO2 emissions that a coal-fired power plant emits, with no ash content, no mercury
emissions, and much lower emissions of sulfur oxides and nitrogen oxides. Natural gas is also an important raw material for the chemical industry. Although natural gas is a primary energy source, it is also suitable for conversion into secondary energy sources or energy carriers, such as hydrogen, methanol, gasoline, or dimethyl ether (proposed as a diesel fuel).
In a mid-2009 assessment,12 the Potential Gas Committee upgraded the 2008 potential
US natural gas resources from the 2006 levels by about 39 percent. This upgrade resulted, in part, from the development and demonstration of technologies that can economically recover natural gas from abundant shale gas deposits. The recently developed shale gas technology involves horizontal drilling into the shale and the multistage hydraulic fracturing of the shale to release the natural gas.
The US Department of Energy published a review of recent US shale gas
Energy Technologies 13
the states of West Virginia, Pennsylvania, and New York, and the Barnett Shale in Texas. With the revised US reserves, at current consumption rates the United States has about 100 years’ worth of natural gas left. This development is new and has not yet been fully analyzed by the energy planning community. Nevertheless, most recently constructed or currently planned new fossil-fueled power plants in the United States already rely on natural gas rather than coal. Some of the societal concerns surrounding shale gas involve groundwater pollution.
Nuclear
Nuclear energy (8.45 quads in 2008, 8.5 percent of the total) is carbon free and nonpolluting if properly managed. Current nuclear power plants employ uranium 235–fueled fission piles. The U-235 isotope makes up about 3 percent by weight of the uranium reserves, and the rest is the isotope U-238. As of early 2010, the United States had 104 operating nuclear reactors, with 1 under construction and 9 planned; in comparison, the worldwide figures, including the United States, are 438 operating, 54 under construction, and 148 planned.13 The 2011 Fukushima Daiichi nuclear reactor
crisis will undoubtedly affect reactor safety designs and operating practices, new reactor construction costs, and public attitudes about nuclear energy.
The United States uses the open fuel cycle: after about 4 percent of the energy content of the fuel rods is exhausted, neutron absorbers are formed that require the removal and replacement of the spent fuel. In the open fuel cycle mode, the spent fuel is then stored indefinitely, leaving about 23 tons of waste per GW-sized power plant per year, as compared with the 300,000 tons of ash from coal combustion as mentioned earlier.
Several countries employ a closed fuel cycle, which involves the reprocessing of the spent fuel (extracting and reusing the unspent U-235 and the fission product plutonium). This technology improves U-235 utilization by up to about 30 percent and leaves behind significantly less, although more radioactive, nuclear waste (about 3 tons per GW per year) than the open fuel cycle, but at current uranium prices, it is uneconomical.
14 Chapter 2
technologies to improve nuclear fuel utilization and to reduce nuclear waste, without the risk of nuclear proliferation. A National Academy of Sciences report reviewed the international options for addressing issues related to reprocessing.14 The report advised
against reprocessing, and the United States has subsequently canceled the GNEP’s domestic component.
From the beginnings of nuclear power to 2010, approximately one-third of the world’s spent light-water reactor fuel has been reprocessed commercially; the remaining spent fuel is stored on reactor sites, including onsite at US nuclear power plants.15 At current
rates of consumption and at current uranium prices, reserves have been estimated to last for about another 50 years.16
Breeder reactors use both U-235 and U-238 in their fission fuel cycle. They could extend uranium supplies by a factor of about 50, perhaps into the next millennium. Developmental issues surrounding the breeder reactor option include safety (require the development of materials that can reliably resist radiation damage) and cost.
As nuclear power generation became established after the 1950s, the size of reactor units grew from 60 MW to more than 1,600 MW. The high capital cost of large nuclear reactors is driving some interest in developing smaller units. (The International Atomic Energy Agency defines “small” as less than 300 MW of electric power, but in general, today 500 MW may be considered an upper limit for “small”.) These smaller reactors may be built independently or as modules in a larger complex, with capacity added incrementally as required. Many smaller nuclear reactors have been built for naval use; this engineering expertise may be applicable to commercial development.17,18 A 2009
assessment by the World Nuclear Association concluded that 43 to 96 small modular reactors may be operating by 2030, but none in the United States.19
Two major longer-term efforts are underway to use nuclear fusion, instead of fission, for energy generation; the fuel is a mixture of the hydrogen isotopes deuterium and tritium, which, as parts of water occurring in nature, promise an essentially inexhaustible supply. Because no structural material can survive the reaction temperatures, the practical implementation of nuclear fusion requires confining the reaction volume to isolate it from the reactor’s walls.
In France, an international, large-scale demonstration project aims to show the possibility of using fusion to produce commercial energy. The International
Energy Technologies 15
A fusion project is also underway at the US Department of Energy’s Lawrence Livermore Laboratory. This project employs laser-ignited inertial confinement of the reaction volume.
These efforts, although critical for humanity’s longer-term energy future, will likely take several decades to achieve commercial utility.
The social issues associated with nuclear energy include safety and security considerations (fuels processing or reprocessing, reactor operation, and spent-fuel transport and storage). These social concerns have abated somewhat in recent years given the increasing problems with coal (ecology, environment, and climate) and oil (supply security and sustainability, national security, trade balance, price instability, and more recently, environment and ecology). The 2011 Fukushima Daiichi nuclear reactor crisis is likely, however, to affect public attitudes regarding nuclear energy and increase the social concerns pertaining to reactor safety.
Carbon Dioxide Generation
A significant component of energy-related issues and decision-making processes is represented by concerns about the potential impact of CO2 emissions on the climate.
Based mainly on US government and National Academies sources, the following discussion below briefly examines the Earth’s carbon balance, followed by the related climate considerations.
The atmosphere contains about 750 gigatons (GT, billions of metric tons) of carbon, according to the diagram of the carbon cycle published on NASA’s Earth Observatory web page.20 We can translate this number into 2,750 GT of CO2 by multiplying 750 GT by the
CO2/C molecular weight ratio of 44/12. This 2,750 GT of CO2 in the atmosphere increases
each year by about 12.1 GT (0.4 percent). This increase arises from the difference between 796.0 GT CO2 emissions—26.1 GT, or 3.3 percent, of which are attributed to human
activities—and the 783.9 GT that are reabsorbed or consumed.20
The principal global anthropogenic CO2 contributors are fossil fuel combustion and
cement production (20.2 GT) and deforestation (5.9 GT).20 Their sum (26.1 GT) exceeds
the net CO2 accumulation in the atmosphere (12.1 GT), implicating human activity as a
primary causal factor of the CO2 accumulation. The various primary energy sources affect
CO2 generation from human activity in various degrees. The 2008 US CO2 flow chart is
shown in Figure 2.2.
The major source of anthropogenic CO2 is coal used to generate electricity (33 percent),
16 Chapter 2
Figure 2.2. US carbon dioxide emissions in million metric tons, 2008
Sour
ce: A
dapt
ed with permission fr
om the La
wr enc e Liv ermor e Na tional Labor at or y. 21
Solar Nuclear Hydr
o
W
ind
G
eothermal Natur
al G
as
1242 Coal 2125
Biomass Petroleum 2447
Elec tricit y G ener ation 362 1946 2359 Residen tial Commer cial Industrial Tr anspor ta tion 51 36 265 170 172 6 1 41 80 967 218 346 1925
Carbon Dio
xide
Emissions 5815
1889
385
Energy Technologies 17
directly related to energy, are increased agricultural activity and deforestation. Renewable primary energy sources and nuclear energy are CO2-free, and biofuels are perceived to be
CO2-neutral because they use solar energy to incorporate some of the CO2 content of the
atmosphere into plant material (e.g., cellulose, lignin, and sugars). As mentioned before, natural gas, on a unit electrical energy basis, has about half of coal’s CO2 burden.
The future of the US energy infrastructure may be closely tied to the outcome of a cluster of CO2-related climate change issues. (A concise summary of these, with key
data, explanations, and a list of reference reports, is available from the US National Academies.22) Considerations include the amount and rate of CO2 accumulation in the
atmosphere; its causes; its past, present, and anticipated future effects on climate; the evolution of climate itself; projected future climate change scenarios; the effects (positive and negative) of climate changes on humans and on nature; and human interventions to suppress adverse climate change effects, with their prospects, costs, and consequences.
The science of climate change is complex. Its predictive ability relies to a significant extent on a feedback mechanism and on scenario modeling.23 Although the model
predictions have been accepted by the majority of scientists and by the national academies of seven large industrial nations, such models carry uncertainties about the nature, size, and time scale of the effects predicted.24 They also carry uncertainties about the nature,
intensity, costs, and feasibility of proposed national and global efforts to mitigate these predicted effects.
Notwithstanding any uncertainties in the time scale and impact of CO2 accumulation
on climate, and the projected effects of those changes on humans and the rest of nature, there are strong reasons for reducing CO2 emissions in the short-term, supporting timely
and decisive action. Beyond producing CO2, using coal and imported oil is associated
18 Chapter 2
Energy Generation, Distribution, and Storage
Energy carriers are secondary energy sources, converted from the primary energy sources. They include electricity and petroleum- and natural gas-based fuels, which are discussed below, as well as biofuels, hydrogen, methanol, and dimethyl ether.
electricity
The technologies for mainstream electricity generation are mostly well established and are based on rotating generators driven by turbines (coal, natural gas, nuclear, hydro, tidal, geothermal, or wind). Photovoltaic electricity requires extensive conditioning if it is to be coupled with the electric grid. Both solar- and wind-based electricity generation depend on the development of smart electric grids, which would compensate for the uneven spatial and temporal distribution of these forms of electricity: plants may not be located close to the users of the electricity, and wind and sunshine are not continuous. The simultaneous deployment of wind and solar energy may provide symbiotic benefits at some locations with sustained nighttime winds. Besides requiring a smart electric grid, new wind and solar electricity may also challenge the capacity of existing electric grids. In the absence of the smart grid, or in complement to it, various storage technologies are being developed for solar and wind electricity. Beyond large conventional batteries, these include water reservoirs, pressurized air tanks, and chemically reacting energy storage systems (“flow batteries”).
Much discussion surrounds the US electric grid’s ability to absorb perturbations due to increasing demand, the grid’s failures and failure propagation, and the addition of smart grids or smart-grid components to accommodate solar and wind electricity. The US Department of Energy has published a helpful smart-grid primer.25
Energy Technologies 19
Fuels Based on petroleum and Natural Gas
As with generating electricity, refining petroleum to liquid fuels such as gasoline, diesel fuel, and aviation fuels is well established. These operations are running very close to their thermodynamic limits.
Natural gas can be chemically converted into liquid fuels by means of partial oxidation to syngas. The syngas can then be reacted by means of catalytic Fischer-Tropsch chemistry to form diesel fuel or gasoline via the methanol route. Because of the newly discovered US natural gas reserves and the resulting potential for low natural gas prices, the catalytic methanol-to-gasoline (MTG) technology, so far employed only in niche markets, may see a renaissance.
Natural gas can also be converted chemically to hydrogen, with CO2 as a by-product.
This conversion would be the basis of the first phase of the hydrogen economy, followed eventually by water electrolysis via nuclear or solar electricity. Hydrogen could then be used to power fuel-cell vehicles; currently, several hundred fuel-cell-driven vehicles are operating in California (General Motors, Honda), Europe, and Japan. Perceived problems with hydrogen as an energy carrier include distribution, storage, and safety. All three problems have been addressed. Hydrogen can be distributed using a natural gas distribution network with locally generated hydrogen; the US Department of Transportation has approved hydrogen tanks that can hold 10,000 pounds per square inch and carry enough fuel for about 300 miles in a typical vehicle. Hydrogen fueling and hydrogen-fueled automobile traffic safety have been deemed to meet commercial requirements.
Energy Utilization
Energy utilization can be divided into residential, commercial, industrial, and transportation categories.
residential
20 Chapter 2
technologies as compared with the resulting reductions in operating costs. The National Academies’ energy-efficiency report4 highlighted some important points that require
more societal research.
A number of significant energy-efficient residential construction and construction materials technologies have evolved in countries with historically high energy prices— typically in Europe and in Japan. Adaptation of these technologies involves many dimensions beyond technology and economics and includes esthetic, cultural, and habitual factors, requiring a better understanding of these factors. One significant energy-saving opportunity will come from the phase-out of incandescent lighting, to be replaced at first by fluorescent light bulbs and thereafter with solid-state light bulbs based on light-emitting diode (LED) technology. All will come with appropriate spectral colors for residential, industrial, or commercial use.
Commercial
The commercial use of energy is similar to residential uses (HVAC and lighting), but with more use for refrigeration. The energy efficiency of commercial buildings has greatly benefited from sophisticated window glass-coating technologies that filter and selectively control the transmittance of visible, infrared, and ultraviolet light. Commercial lighting has pioneered the use of low-energy light sources (fluorescent and solid-state) to replace incandescent light bulbs.
Industrial
Industrial energy use, in terms of primary energy sources, comprises 14 percent
electricity, 34 percent natural gas, 36 percent oil, and small quantities of biomass and coal. The largest industrial use of electricity is for sodium chloride electrolysis to manufacture chlorine and sodium hydroxide, two large-volume industrial chemicals.
Energy Technologies 21
transportation
Transportation use constitutes 28 percent of the energy consumption in the United States, and it is almost completely oil-based (95 percent oil, 2 percent natural gas, 0.1 percent electric). As we said before, about two-thirds of US oil is imported, and 32 percent of the US anthropogenic CO2 is produced from transportation. One of the great challenges
for transportation is to reduce its dependency on oil. This issue is being addressed by reducing fuel consumption (smaller and lighter cars, more efficient engines, gasoline-electric hybrids) and by breaking the so far almost impenetrable boundaries between automobile transportation and electricity or natural gas.
The electricity-transportation boundary is being pierced by the introduction of plug-in hybrids and all-electric vehicles. Plug-plug-in hybrids are electrically propelled, with a gasoline engine that can be automatically turned on to recharge the battery but that is not mechanically connected to the drive train. (This is different from gasoline-electric hybrids, where electric- and gasoline-powered drive trains coexist.) Plug-in hybrid vehicles have a limited all-electric range, intended to cover the round-trip commuting range of most drivers (about 40 miles). Its gasoline engine serves as a range extender to perhaps 300 miles, making these cars suitable for longer trips as well, despite their small batteries. The initial charge, covering the needs of about 80 percent of commuters, is supplied via plugging into the electric network, mostly overnight, eventually also providing a load-leveling capability to the electric grid.
Mass-produced all-electric vehicles will eventually follow, pending battery developments. Technological development for electric vehicles is attracting dramatic worldwide activity. Issues include range, power, cost, safety, and speed and the availability of recharging. Electric batteries cannot be recharged instantly the way refilling a tank with gasoline can be accomplished, because of the very large electric currents that instantaneous recharging would require. One of the technological ventures involves developing standardized exchange terminals for electric vehicle batteries, where fully charged batteries can be inserted into the vehicle to replace the discharged batteries.
22 Chapter 2
operation in cold climates), safety, and in many cases, durability. Cost is the major issue that is expected to become gradually more competitive because of the learning curves of large-volume production. Nevertheless, large-scale deployment of fuel cell–powered vehicles is probably more than a decade away.
In the shorter run, natural gas can be used directly to fuel internal combustion engines. Compressed or liquefied natural gas powers about 11 million vehicles in the world today. These vehicles are located mostly in countries where prices for natural gas prices are lower than for gasoline, primarily in Asia (e.g., Pakistan) and South America (e.g., Argentina), but also in some European countries (e.g., Italy). The number of natural gas–driven vehicles is growing rapidly. Challenges include building a fueling infrastructure and designing cars with sufficient trunk size to accommodate the natural gas tanks.
Energy Savings
Important to the US energy picture, rejected energy is the fraction of primary energy source content discarded during energy extraction, conversion, distribution, and use. Data from the US Energy Information Administration, graphically displayed by the Lawrence Livermore National Laboratory’s energy information group (see Figure 2.1),8 suggest that
rejected energy amounts to about 58 percent of the energy content of the primary energy sources.
Energy savings often prove to be the “low-hanging fruit” in reducing energy
consumption, pollution, and CO2 emissions while also saving money. Therefore, they tend
to be the highest priority of most short- and mid-term energy infrastructure restructuring proposals.
There are two distinct modes of energy savings: through energy efficiency and through energy conservation. The term energy efficiency refers to achieving the same objective while consuming less energy; this is typically a technology-dependent outcome (example from transportation: hybrid propulsion in contrast to conventional vehicle propulsion). The term energy conservation refers to achieving energy savings by compromising the objective itself while reducing energy usage; this is primarily driven by perceived or real need and related human behavior (example from transportation: less driving, smaller cars). These two modes of energy savings are of course overlapping in actual life, demonstrating yet again that energy technology, economics, and societal considerations are inseparable.
Energy Technologies 23
widely used (example from construction: fluorescent home lighting), and technologies under development (example from construction: LEDs for solid-state lighting). Again, implementation of a new technology is a complex function of technological, economic, and societal factors that, we argue, can best be understood in their integrated contexts, as the intersection of technology, economics, and societal factors.
The US National Academies Panel on Energy Efficiency Technologies, part of the America’s Energy Future project,2 recently examined the energy savings potential of the
United States. The study was restricted to energy efficiency, leaving energy conservation out of the analysis. This scope limitation opens possibilities for the analysis of energy conservation, especially by social scientists.
The National Academies’ energy-efficiency report divides energy uses into three categories: construction, transportation, and industrial. The largest energy savings potential is in construction (insulation, lighting, heating, ventilation, air conditioning, and their integrated design and control). The report sets forth the remarkable conclusion that “if all the potential energy savings identified for residential and commercial buildings could be achieved” by 2020, the United States would not need any added electricity generating capacity.4(p2) A factor limiting the rate of implementation of energy-saving
technologies is the long life cycle of buildings, demanding tough “replacement economics” from any new technologies.
In addition, the transportation category has significant technological potential
remaining, ranging from advanced materials (lighter, stronger) to hybrid, plug-in hybrid, all-electric, and fuel-cell vehicles.
The third large energy-consuming category, industrial, is heterogeneous and complex. The major industrial energy consumers (aluminum, steel, chemicals) still appear to have untapped energy efficiencies; the implementation of these energy efficiencies is handicapped by the fact that large-scale industrial processes tend to have long life cycles (presenting challenging replacement economics if their capital has fully depreciated) and that energy consumption alone may not necessarily be their limiting economic dimension.
Energy savings are the result of complex interactions within the
Energy Economics
Chapter 3
For any technology to become a viable component of the energy infrastructure, it must be economically sustainable. A wide range of alternative energy technologies exist, but fossil fuels are still the lowest-cost option based on current market prices. In addition, because energy in the United States is relatively inexpensive—with 2007 energy expenditures having accounted for less than 9 percent of the gross national product27—energy efficiency
initiatives have had difficulty gaining momentum.
One of the most important issues in considering the future of energy in the United States is determining how choices are made regarding the technologies that will be employed to meet growing energy demand. Market forces provide incentives for producing energy at the lowest cost while operating within the current public policy framework. However, in the presence of market distortions and impacts of energy production and consumption that are not reflected in the price to consumers, the market outcome will not necessarily lead to the most economically efficient mix of energy technologies. Consequently, at the heart of any discussion of our energy future are the following questions: What are the key factors influencing the cost of energy, specifically fossil fuels, in the United States, and to what extent do current prices deviate from the true social cost of these energy sources? For example, health and environmental externalities (unaccounted-for costs) and both implicit and explicit subsidies distort markets, leading to a suboptimal energy infrastructure from a societal perspective. It is vital to understand the magnitude of these effects and to consider the role of government policy in improving the economic efficiency of the United States’ energy future.
26 Chapter 3
Economics of Primary Energy Sources
To provide background on recent developments in primary energy sources markets, we briefly review the historical relationships among reserves, production, consumption, and prices for the depletable energy sources discussed in Chapter 2 (coal, oil, natural gas, and uranium). We then assess the externalities of fossil fuel production and use.
As is true with most natural resources, reserves are defined in terms of currently available technologies for economical recovery and use. On this basis, the world is unlikely to ever literally run out of fossil fuels or uranium; more likely, the recovery of these
energy sources will become expensive enough to stimulate the use of alternative energy sources. Prices provide important signals regarding scarcity and influence investment across alternative energy technologies. The introduction of policies that influence the net prices observed by producers and consumers (e.g., to account for externalities) will alter incentives and result in a shift toward those primary energy sources that have become relatively less expensive under the policy.
reserves, production, Consumption, and prices
Coal
The US Energy Information Administration (EIA) estimates that the United States had a demonstrated reserve base for coal resources of 488 billion tons at the beginning of 2009.28 However, access to some coal is limited because of property rights, land use
conflicts, and physical and environmental restrictions. In addition, the actual proportion of coal resources that can be recovered economically is affected by geologic features and the need to leave some coal as pillars to protect against mine collapse. In 2008, the average recovery rates for underground mines, surface mines, and overall were 57.9 percent, 90.1 percent, and 79.6 percent, respectively.29 Accounting for these accessibility and recovery
factors, the most recent EIA estimate is that the United States had total recoverable coal resources of 261 billion tons at the beginning of 2009. Global recoverable coal resources were estimated at about 911 billion tons in 2007. Based on these estimates, current rates of production, and the current technology for production and mining, the ratio of global coal reserves to global annual production (reserves-to-production ratio) is approximately 130 years.28 The location and accessibility of these coal reserves suggest further tough
Energy Economics 27
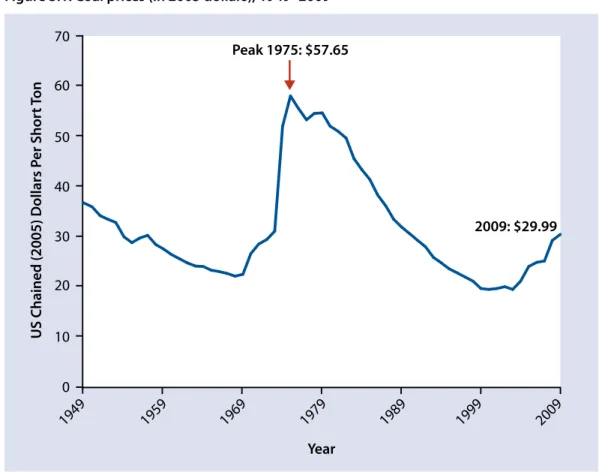
Figure 3.1. Coal prices (in 2005 dollars), 1949–2009
Source: Adapted with permission from the US Energy Information Administration.30
0
US Chained (2005) Dollars P
er Shor
t T
on
1949 1959 1969 1979 1989 1999 2009
10
Year
20 30 40 50 60
Peak 1975: $57.65
2009: $29.99
70
Coal production has been growing at a slower rate in recent years, partly because of more stringent environmental regulations, which have greatly reduced interest in building new coal-fired plants. In addition to existing air quality regulations, the potential for regulations limiting greenhouse gas emissions is contributing to a reduced rate of expansion of coal-fired power plants.
Coal prices peaked in 1975, bottomed in 2000, and have risen over the past few years (Figure 3.1). However, in its 2010 Annual Energy Outlook, EIA projects flat to slightly declining prices between 2010 and 2035.31 In the event that policies limiting greenhouse
28 Chapter 3
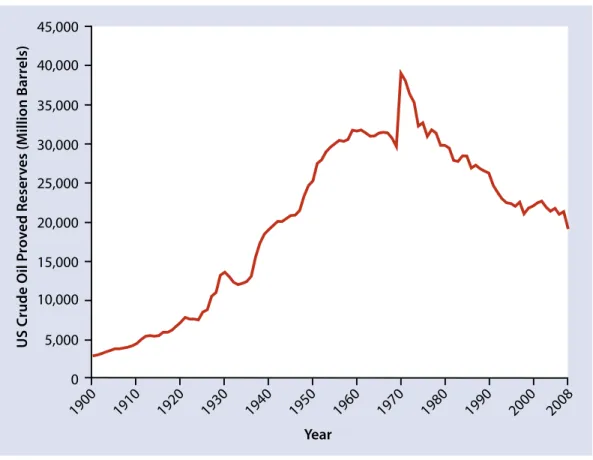
Figure 3.2. US proved oil reserves, 1900–2008
Source: Adapted with permission from the US Energy Information Administration.32
0
US Crude Oil P
ro
ved Reser
ves (M
illion Barr
els)
1900 1910 1920 1930 1940 1950 1960 1970 1980 1990 2000 2008 5,000
10,000
Year
15,000 20,000 25,000 30,000 35,000 40,000 45,000
Oil
Proved US oil reserves peaked in 1970 (Figure 3.2) and have decreased since then. Domestic US oil production peaked in the same year.
Energy Economics 29
Figure 3.3. US oil consumption and oil prices, 1973–2010
Source: Adapted with permission from Williams, c2006–2009, http://wtrg.com/prices.htm.33
14,000 0
Oil Price
(Dollars per Barrel at the Time)
20 40 60
US Dollars per Barr
el
Barr
els per Da
y (
Thousands)
1973 1977 1981 1985 1989 1993 1997 2001 2005 20092010
80 100 120 140
15,000 16,000
Year
17,000 18,000 19,000 20,000 21,000 22,000 23,000
Oil Price (2009 Dollars per Barrel) Petroleum Consumption
(Thousands of Barrels per Day)
decline will be temporary and when the new trends for electric vehicles will start to affect petroleum consumption remain to be seen.
30 Chapter 3
Figure 3.4. US oil production and oil imports, 1920–2010
Source: Adapted with permission from the US Energy Information Administration.34,35
0
1920 1930 1940 1950 1960 1970 1980 1990 2000 2010
50,000
Year
100,000 150,000 200,000 250,000 300,000 350,000
US Imports
Crude Oil (
Thousand Barr
els)
US Production
In March 2010, the US trade balance was about −$40.4 billion, composed of −$52.9 billion in goods and +$12.5 billion in services. Petroleum imports were
Energy Economics 31
Figure 3.5. Natural gas wellhead prices, 1976–2010
Source: Adapted with permission from the US Energy Information Administration.36
Natural Gas
As discussed in Chapter 2, natural gas will likely play an increasingly important role as a transitional hydrocarbon fuel.
US prices for natural gas have a history similar to that of oil prices: they varied by a factor of nearly 6 over the decade from 2000 to 2010, as shown in Figure 3.5. Some of the large price swings occurred in the wake of deregulation-induced speculation (e.g., the 2000–2001 California energy crisis). Recent major upgrades in potential US natural gas reserves may contribute to improved stability in natural gas prices.
US Dollars per
Thousand C
ubic F
eet
1976 1980 1984 1988 1992 1996 2000 2004 2008 2010
Year
32 Chapter 3
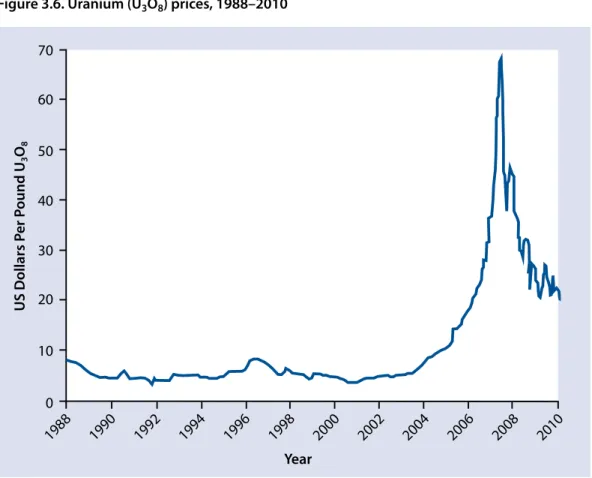
Figure 3.6. Uranium (U3O8) prices, 1988–2010
Source: Adapted with permission from the Ux Consulting Company.41
Nuclear Energy
Compared with fossil fuels, uranium is more readily available to more countries. The largest reserves are found in Australia, which has more than one-fifth of the world’s total reserves; other large amounts of uranium are found in Kazakhstan, Russia, the United States, Canada, and South Africa.37 Currently, the availability of nuclear fuel imposes no
limitation on nuclear power production, although such availability may later become a limiting factor.38,39 Moreover, the cost of nuclear fuel has not significantly affected the
economics of nuclear energy, which is dominated instead by its high capital costs.40
Uranium prices (Figure 3.6) increased more than tenfold from June 2003 to May 2007. They have since declined substantially after briefly reaching a peak of $136 per pound of U3O8 in 2007 (not captured in the graph). Nonetheless, 2010 prices remain about 3 times
0
US Dollars P
er P
ound U
3
O8
1988 1990 1992 1994 1996 1998 2000 2002 2004 2006 2008 2010
10
Year
Energy Economics 33
higher than the 1988–2003 average. There has been discussion of a potential “nuclear renaissance” in the United States and other parts of the Western world for the past decade. One way in which government support for greater nuclear development may manifest itself is through capital investment guarantees to protect against investment risks caused by potential fossil fuel and uranium price fluctuations.42,43
risks and Uncertainties
Many kinds of uncertainties can substantially affect energy supply, which may cause disruptions in the supply chain and have a negative impact on consumer welfare through reductions in the availability of energy services. Some of these disruptions include the following:
• supply disruptions related to production safety, such as the 2010 Massey Energy mine explosion in West Virginia, which killed 29 miners, and the 2010 Deepwater Horizon offshore oil drilling rig explosion in the Gulf of Mexico, which killed 11 oil rig workers and caused a massive oil spill;
• natural disasters, such as hurricanes Katrina and Rita in 2005; • price instabilities in commodity primary energy sources;
• oil crises in the form of coupled price and supply instabilities, such as the 1973 OPEC (Organization of the Petroleum Exporting Countries) oil embargo and the 1979 Iranian Revolution;
• international disputes, such as the 2006 Russia-Ukraine gas dispute and the 2007 Russia–Belarus oil dispute;
• sanctions, such as those currently in place against Iran and, earlier, against Iraq and Libya;
• terrorism, such as the terrorist attacks of September 11, 2001; and
• warfare in oil-producing regions, such as the 1990 Persian Gulf War and the 2003 Iraq War.
34 Chapter 3
DOE indicates that the volume in the SPR is equivalent to 75 days’ worth of imported oil. However, the United States fulfills its commitment to maintaining 90 days of import protection through a combination of the SPR and industry stocks.
Externalities
Externalities are the benefits or costs associated with market transactions that are not enjoyed or borne by market participants but affect the well-being of third parties outside the transaction. One of the most pervasive externalities is the environmental pollution created by energy extraction and consumption, where neither the energy producer nor the consumer bears the full social cost.
In the absence of externalities, market transaction costs and benefits to society equal the costs and benefits to the parties of the transaction. Thus, without externalities, the equilibrium price and quantity determined by the market maximizes both private and social net benefits. At quantities lower than the equilibrium, the value to consumers of an additional unit exceeds the cost of producing that unit, so there are gains to expanding production. Conversely, at quantities higher than the equilibrium level, the marginal cost of production exceeds the marginal value to consumers. In this case, without externalities any interventions in the market reduce total net benefits to society by moving the
market away from the free market equilibrium. However, in cases where externalities do accompany market transactions, the free market equilibrium results in levels of economic activity above or below the socially optimal level. Market participants, in these situations, have no incentive to take into account these effects on third parties or the society at large. This supports a rationale for government intervention to improve total welfare by instituting policies that cause the effects on third parties to be considered.
When a negative externality occurs, the costs to society of additional production and consumption, or the marginal social cost, exceed the private cost, or the price of the good or service. In other words, the privately optimal level of production and consumption exceeds the socially optimal level. Consequently, proponents of a carbon tax argue that taxing society for the pollution externality is a way to bring fossil fuel energy consumption closer to its socially optimal level.
Energy Economics 35
Government intervention can place a value on the externalities by, for example, taxing those activities with negative externalities and subsidizing those with positive externalities. Such intervention causes individuals and firms to “internalize” the externalities and consider them when making their private decisions. A policy that led to complete internalization of all externalities would result in privately optimal market outcomes that are also socially optimal.
Recognition of the importance of the environmental externalities of market production and consumption in socially optimal resource allocation constitutes one of the
foundations of environmental economics. Energy production from fossil fuels imposes major negative environmental and human health impacts through, for example, emissions of CO2, sulfur oxides, nitrogen oxides, fine particulate matter, and vapors of mercury, as
well as deposits of heavy metals in coal ash and of coal ash itself. Without intervention, fossil fuel–derived energy use will exceed the socially optimal level because energy users will not internalize the pollution externalities. Consequently, the need to address the production of multiple pollutants during the combustion of fossil fuels makes the study of climate and other environmental policies affecting energy markets a major focus of energy economics.
Numerous regulations require controls on emissions from electricity producers and from transportation use. However, these emission controls have not targeted CO2 reductions, at least not at the federal level. This situation may change as the US
government considers regulatory and legislative approaches to reduce greenhouse gas emissions over time. Because of their dominant role in US CO2 emissions (see Chapter 2),
energy production and consumption would be among the most affected sectors of the US economy, according to economic analyses of the impacts of US policy proposals that have been considered as of late 2010.45
Energy-related externalities were considered in the previously cited 2010 report of the National Research Council titled Hidden Cost of Energy: Unpriced Consequences of Energy Production and Use.5 The committee quantified the hidden (unpriced) effects of
36 Chapter 3
ecosystems, and national security, indicate that petroleum-dependent transportation incurs a significantly higher societal cost than the at-pump fuel prices reflect.
Oil-related hidden costs were addressed by a 2007 report of the National Defense Council Foundation.46 Elements of its analysis, in 2005 figures, included
• oil-related defense expenditures of $49 billion per year,
• loss of current economic activity, in terms of gross national product, due to capital outflow of $160 billion per year,
• losses in tax revenues of $13 billion per year, and • job losses numbering about 830,000.
Greene and Ahmad of Oak Ridge National Laboratory addressed hidden energy costs in a 2005 report.47 They calculated the costs of
• the transfer of wealth from the United States to oil-producing countries,
• the potential economic loss due to oil prices being elevated above competitive market levels, and
• disruption costs caused by sudden, large oil price movements.
According to their estimate, oil dependence cost the US economy $3.6 trillion (in 2000 dollars) from 1970 to 2005.
Behavioral Energy Economics
Market prices provide consumers of energy resources with incentives to choose privately optimal levels of energy efficiency and energy use. Maximizing economic efficiency of energy use, which would maximize net benefits to society, does not generally imply maximizing energy efficiency. Energy efficiency refers to the quantity of energy used per unit of output. Although changes in production and consumption that reduce energy use per unit output may reduce energy costs, they are likely to require increases in the use of other inputs per unit of output (e.g., capital, labor, and materials).
Changes to reduce energy use per unit of output come at a marginal cost that is expected to increase as energy efficiency improves and it becomes increasingly difficult and costly to further increase energy efficiency. A large literature reasons that private economic decisions related to energy production and consumption may not result in economically efficient outcomes.48 For example, consumers may not be fully informed of