ACCURACY AND PRECISION OF 3-DIMENSIONAL PRINTED DENTAL MODELS PRODUCED BY DIFFERENT ADDITIVE MANUFACTURING TECHNOLOGIES.
Greice Oliveira
A thesis submitted to the faculty at the University of North Carolina at Chapel Hill in partial fulfillment of the requirements for the degree of Master of Science in the Department of Orthodontics in the School
of Dentistry.
Chapel Hill 2019
ABSTRACT
Greice Oliveira: Accuracy and Precision of 3-Dimensional Printed Dental Models Produced by Different Additive Manufacturing Technologies
(Under the direction of Tung Nguyen)
The primary aim of this investigation was to evaluate the accuracy of dental models manufactured
by different additive manufacturing processes: Stereolithography Apparatus (SLA), Liquid Crystal Display with Unidirectional Peel (LCD-SLA/UDP), and Digital Light Processing (DLP). The secondary objective was to test the accuracy of the models printed at different Z-plane resolutions. To accomplish
these goals,twelve 3-D digital surface models were selected, exported as surface model stereolithography
files, and printed using the additive manufacturing processes mentioned. Models were printed at 50 and
100µm resolution. The printed models were rescanned to create digital STL models and superimposed to the original scan. No statistically significant difference between layer thicknesses was found for the SLA, and for the DLP. The LCD-SLA/ UDP technology showed statistical significant differences between different layer thicknesses. The SLA technology showed statistically significant difference from DLP and LCD-SLA/ UDP. No significant difference was observed between DLP and LCD-SLA/ UDP.
ACKNOWLEDGEMENTS
TABLE OF CONTENTS
LIST OF TABLES ……….…………vii
LIST OF FIGURES ……….……….viii
LIST OF ABBREVIATIONS ……….ix
LIST OF SYMBOLS ……….…………..x
REVIEW OF THE LITERATURE ……….……….…1
Plaster Versus Digital Models ……….….…1
3D Printing Technology ………..…….4
3D Manufacturing Technologies classification ………..…….4
Additive Manufacturing Technologies ……….….…..5
3D Printing Resolution ……….………..…..6
Influence of Layer Thickness on 3D Printing ………..…………7
Accuracy of 3D Printed Dental Models ……….….……….9
Clinical Applications of 3D Printed Dental Models ………..10
References ………..12
ACCURACY AND PRECISION OF 3-DIMENSIONAL PRINTED DENTAL MODELS PRODUCED BY DIFFERENT ADDITIVE MANUFACTURING TECHNOLOGIES………...15
Introduction ………..………..15
Methods ………..………17
Results ………...…….18
Discussion ………..……19
LIST OF TABLES
LIST OF FIGURES
Figure 1: Study methodology flowchart ………...27 Figure 2: Chart comparing the 3D printing technologies and printers investigated in this study.……...…28 Figure 3: Close up view of models printed at 50 micron and 100 micron resolution ………...29 Figure 4: 3M™ High-Resolution Scanning Spray applied on printed models. Close up view of the
LIST OF ABBREVIATIONS 3D Three Dimensional
AM Additive Manufacturing RP Rapid Prototyping CAD Computer-Aided Design SLA Stereolithography Apparatus DLP Digital Lighting Processing FDM Fused Deposition Modeling SLS Selective Laser Sintering
LCD-SLA/UDP Liquid Crystal Display with Unidirectional Peel UV Ultraviolet
STL Stereolithography ANOVA Analysis of Variance SD Standard Deviation
LIST OF SYMBOLS © Copyright symbol
A REVIEW OF THE LITERATURE Plaster versus digital models
Successful orthodontic treatment is dependent on comprehensive diagnosis and treatment planning, and an accurate model analysis is critical for correct diagnosis. Three-dimensional (3D) imaging has seen significant advances recently, allowing clinicians to develop the virtual orthodontic patient. Advancements in 3D facial imaging, cone-beam computed tomography (CBCT), scanning techniques, and dental model technology facilitate accurate reconstructions of teeth, soft tissue, and bone.1
Plaster models are certainly the historic gold standard in dental diagnosis and treatment
procedures. Is has been shown that they present precise and reliable information about the patient’s dental arches, teeth position and its dimensions. However, its use comes with a few important disadvantages. Plaster models require physical storage space, they are prone to breakage and degradation over the years, they lack in terms of efficiency when recovery is needed, and they represents a hurdle when sharing data with other professionals is needed for multidisciplinary treatment.2-5
The benefits of using digital models in orthodontic practices are numerous. Primarily, digital models are less labor intensive. Orthodontists can immediately send a digital scan of the teeth and surrounding oral structures to an outside laboratory or share it with another dentist in cases which multidisciplinary care is involved. Similarity, a digital diagnostic or treatment simulation can be
completed or models can be superimposed to evaluate treatment progress without risk of degradation or loss of the model. There is no demand for physical storage as the patient data can be digitally archived and only printed when needed.5-8
NJ, USA), and in 2001 by E-model™ (GeoDigm, Chanhassen, MN, USA). New technologies were introduced to the market later. 6 Currently, different technologies can be used to generate digital study models, which may render discrepancies in accuracy between plaster and digital models.9
In 2003, Santoro et al. conducted a study to compare OrthoCad™ digital models to plaster models. Two alginate impressions were taken from seventy-six subjects. One impression was
immediately poured to fabricate a standard plaster model, while the second impression was sent overnight to OrthoCad™ to be digitized. Measurements such as tooth size, overjet, and overbite were taken from the physical and digital models to the nearest 0.1mm. Physical models were measured with a Boley gauge, and OrthoCad™ models were measured with OrthoCad™ software. The results regarding tooth size and overbite showed significantly smaller measurements for digital models when compared to their plaster counterpart. There was no statistically significant difference for overjet measurements. The authors concluded that despite the differences reported, digital models produced by OrthoCad™ would be considered an acceptable option for the purpose of routine diagnosis.4
In a similar study by Stevens et al. conducted in 2006, conventional plaster models were compared to their digital models produced by E-Model™ software. Twenty-four subjects with eight malocclusion types were enrolled in the study. Mean differences were recorded for Peer Assessment Rating (PAR) and Bolton analysis. Measurements were recorded to the nearest 0.01mm. Conventional models were measured with a digital caliper, while digital models were measured with the use of E-Model™ software. Mean differences ranged from 0.04 - 0.83 for PAR index and from 0.04 - 0.38mm for Bolton analysis. Although statistically significant differences were found between the 2 methods, the authors concluded that no measurement associated with PAR index or Bolton analysis appeared to be clinically significant, and that digital models are not a compromised choice for treatment planning and clinical diagnosis.10
National Research Register and Pro-Quest Dissertation Abstracts and Thesis database were used to search studies that would compare linear and angular measurements from conventional plaster and digital models. Forty abstracts were initially selected. However, only 17 of them met the inclusion criteria. The mean difference between measurements on digital versus plaster models was low. In all studies, the differences were considered to be clinically insignificant. The authors concluded that digital models offer a high degree of validity when compared to direct measurement on plaster models, and can be considered clinically acceptable. However, the overall quality of the selected studies was variable, with generally inadequate descriptions of the sample populations and rare reports of confidence intervals and standard errors between different techniques.6
Another review by Luu et al., conducted in 2012, evaluated intrarater reliabilities in terms of mean differences, intraclass correlation coefficient (ICC), and Pearson correlation coefficients (PCCs) of measurements of digital models compared with plaster models. Agreement of measurements was
excellent. The authors were in agreement with Fleming et al., concluding that digital models are clinically acceptable compared with plaster models in respect to intrarater reliability and validity of the selected linear measurements.11
on digital models, and bias in the software used to calculate the ABO Objective Grading System.13-16 More recently, an improvement in this grading system was observed. Although the virtual setup model resulted in greater deductions in overjet, occlusal contact, and total score compared with the plaster setup model, the total reductions were not greater than 25, which represent the threshold for passing. This finding provides evidence that supports clinical acceptance.13 In view of the many advantages such as cost, time, and storage space required, digital models could be considered the new gold standard in current practice.
3D printing technology
The evolution of 3D imaging and modelling in dentistry is progressing towards a more efficient and cost-effective workflow using state-of-the-art technology. The practicability of this technique is expanding in several dental fields such as prosthodontics, oromaxillofacial surgery and prosthesis, and production of surgical guides or physical models in dental implant treatment. Three-dimensional printed models can also be used to fabricate orthodontic appliances. Over the last years, the traditional
orthodontic workflow is shifting to a digital format. The 3D printing technology is becoming more affordable, faster, and it is claimed to be able of producing dental models with a high resolution and accuracy.
3D manufacturing technology classification
The 3D manufacturing process can be classified as subtractive or additive manufacturing. Subtractive manufacturing is based on milling methodology while additive manufacturing is based on layering methodology, usually joining materials layer upon layer. In subtractive manufacturing, a
prefabricated block is removed to fabricate a dental restoration, for instance.18 Other limitations can be attributed to this method. Milling tools can only withstand short running cycles due to exposure to heavy abrasion and wear. Also, the precision depends on the size of the smallest milling tool for each
material.19,20
The additive manufacturing methodology has the potential to overcome these limitations. In additive manufacturing, the final physical part is fabricated by adding layer upon layer of material to form a 3D object. The 3D computer-aided design (CAD) model is sliced into many layers and the geometric data provided by the equipment software is used by the 3D printer to build each layer sequentially until the part is completed. The use of this technique allows the fabrication of complex parts that include undercuts and cavities, which is seen in dental anatomy. 21,22 Additionally, additive manufacturing is more cost-effective since less material is used, and more efficient since more than 1 print can be done
simultaneously. Nowadays, there are a vast number of 3D printers with the ability to print various 3D objects using different technologies. 23
Additive manufacturing technologies
A stereolithography apparatus (SLA) was one of the first additive manufacturing technologies to be theorized by in the early 1980s, when Japanese researcher Dr. Hideo Kodama invented the modern layered approach to stereolithography by using ultraviolet light to cure photosensitive polymers. 24,25 This technique was then patented by Chuck Hull in 1984. 26 The process was defined as a "system for
deflection due to gravity, and retain newly created sections during the peel process. The support is created by the 3D printer software during the preparation of the 3D models and should be removed manually once the printing process is concluded. Once printing is completed and the parts have reached their final shape, the photopolymerization reaction is not yet driven to completion. At this point, mechanical and thermal properties are not fully set. Approximately 80% of the total polymerization takes place while the part is built in the 3D printer. Post curing is necessary to complete the remaining 20% by means of a
conventional UV curing unit. This enables parts to reach the highest possible strength and become more stable. 27,28
Digital Light Processing (DLP) is a similar process to SLA. The major difference is the light source. DLP uses an arc lamp with a liquid crystal display projector, which is applied to the entire surface of the vat of photopolymer resin in a single pass, making the printing time significantly faster when compared to SLA technology. The similarities also include the use of support to attach the printed parts and the post-curing process to complete the solidification of the printed part.
usability in the dental field. 29 3D printing resolution
The 3D printer axis systems provide the object depth and design and are represented by the X, Y, and Z planes. The XY plane is also known as the horizontal plane, while the Z plane is known as the vertical plane. Normally, the X and Y-axes correspond to lateral movement while the Z axis corresponds to vertical motion during the printing process. In other words, X and Y-axes refer to those that are parallel to the 3D printer build platform. On the other hand, the Z-axis represents the direction in which the printed part is built, which is perpendicular to the build platform. The Z resolution was the first major numerical differentiation between early 3D printers. 30
The resolution that is measured microscopically in the XY dimension is described as the minimum feature size. This is represented by the diameter of the laser beam and radical polymerization kinetics in SLA technology and by the size of the pixel for technologies such as DLP and LCD-SLA, in which a screen projector is used to solidify the liquid polymer. The resolution recommended for
orthodontic purposes should be equivalent to a minimum of 100 µm. Most resolution reports are related to the Z dimension, represented by the layer thickness.
Influence of Layer Thickness on 3D printing
Generally, the layer thickness is based on the morphologic features and intended use of the object to be printed. This feature is controlled by how much the 3D printer build platform elevates after a layer is cured. Usually, if high accuracy is needed, the layer thickness is minimized. On the other hand, if cost and time are more relevant, thicker layers are used. Improved resolution can be manifested by a smoother surface finish and greater detail. Higher resolution in the z-direction corresponds to a reduced layer height on a printed part. It is often assumed that an improved resolution should also equate to improved
presenting increased layer height or lower resolution. Also, high resolution comes with a tradeoff. Thinner layers will require more repetitions, which in turn means more opportunities for artifacts and errors. Layer thickness selection must provide a satisfactory balance between speed and resolution. 31
It was not until 2017 that Favero et al. published a study that investigated the effect of layer thickness on the accuracy of 3D printed dental models. Thirty-six typodont models were scanned and then fabricated by a SLA printer. Three layer thicknesses were evaluated: 25, 50, and 100 µm (N=12). Forty-eight additional models were printed using 4 commercially available 3D printers: Juell 3D (12 models printed with 100 µm layer), Objet Eden260V Dental Advantage (12 models printed with 28 µm layer), large-frame Vector 3SP (12 models printed with 100 µm layer height), and Perfactory Desktop Vida (EnvisionTEC) (12 models printed with 100 µm layer height). All printed models were digitally scanned and superimposed using a best-fit algorithm to assess accuracy. As the layer thickness decreased, the deviation values increased, with the 25 µm layer models showing the greatest deviations, and the 100 µm layer models showing the least deviation. The authors attributed that to the increased potential for errors and artifacts as the quantity of layers are added. An inconsistent X-Y resolution may have also produced surface irregularities. Similarly, as the number of layers increased, it also increased the amount of potential variation cause by the x-y resolution. Although statistically significant differences were found in the average overall deviations, all values were considered clinically acceptable. Based on this study, it can be stated that increased resolutions do not necessarily mean increased accuracy. Factors such as cost, efficiency, surface quality, and accuracy should be considered when selecting layer thickness.30
score each model. Based on that, 8 criterias were evaluated: alignment/rotations, marginal ridges, buccolingual inclination, overjet, occlusal contacts, occlusal relationships, interproximal contacts, and root angulation.31
Models with a 100 µm layers showed the strongest correlation of total score to stone models, while 25 µm models showed the weakest correlation of total score. The 100 µm layer models were highly correlated to stone models in regards to buccolingual inclination, overjet, occlusal relationship, and interproximal contacts, and presented a weak correlation in regards to alignment/rotations and marginal ridges. All models showed very strong correlation with stone models for occlusal contacts.31
Accuracy of 3D printed dental models
In order to incorporate the use of 3D printed models in orthodontics, accuracy must be warranted. Accuracy can be determined by the superimposition of the printed model to the original CAD model and it is reported as a percentage of its original volume. Precision is the closeness of the superimposition of repeatedly printed models. In other words, it can be referred to the reproducibility of the printer to fabricate multiple models with the exact same dimensions. Precision is especially important when fabricating clear aligners.
The accuracy of 3D printed models can range from 20 to 100 µm. This can be influenced by the 3d printer technology and its resolution. Dietrich et al reported a superior precision, but less accuracy for SLA technology when compared with Polyjet. Although Kim et al showed better trueness values for DLP and Polyjet, SLA had better accuracy when the occlusion was evaluated. However, it is important to recognize the discrepancy observed in the results from those studies ranged from 20 to 50 µm, which may not be significant for many clinical applications. Also, since then the laser resolution of the current SLA 3D printers have improved.33,34
The color can also affect it since the more transparent the resin is, the easier for the laser to pass through and cure undesired areas, introducing artifacts.
Accuracy can also be altered by the print orientation. Horizontal prints are known to be more accurate than vertical ones due to shrinkage of unsupported parts. To avoid distortion, current 3D software will add the support to the printed part.
It is critical that the build platform rises perfectly parallel. Otherwise it will create distortion and may skew the print. Different technologies are used to allow this parallel raise of the platform. Despite of the mechanism used, 3D printers should be calibrated in a regular basis to provide reliable prints. The intervals between calibrations should not exceed 3 to 4 months.
Clinical Applications of 3D printed dental models
Metal appliances can be produced by Selective Laser Sintering (SLS) technology. This technology can use several materials such as Stainless Steel, Cobalt Chromium, T64 Titanium, porcelain, plastics, and glass, providing high strength and stiffness to the printed part. Orthodontic metal appliances such as skeletal anchorage attachments, lingual holding arches, Rapid Palatal Expanders can be fabricated using SLS. However, a multi-piece part will often involve a 2-step process in which bands, support arms, and lingual pads are 3D printed and then welded to the commercially available expansion screw to complete the RPE appliance.35
REFERENCES
1. Hajeer MY, Millett DT, Ayoub AF, Siebert JP. Applications of 3D imaging in orthodontics: part II. J.Orthod 2004; 31:154-62.
2. Liang YM, Rutchakitprakarn L, Kuang SH, Wu TY. Comparing the reliability and accuracy of clinical measurements using plaster model and the digital model system based on crowding severity. J. Chinese Med. Assoc 2018; 81:842–7.
3. Akyalcin S, Dyer DJ, English JD, Sar C. Comparison of 3-dimensional dental models from different sources: Diagnostic accuracy and surface registration analysis. Am. J. Orthod. Dentofac. Orthop 2013; 144:831-7.
4. Santoro M, Ayoub ME, Pardi VA, Cangialosi TJ. Mesiodistal Crown Dimensions and Tooth Size Discrepancy of the Permanent Dentition of Dominican Americans. Angle Orthod 2000; 152:557-65. 5. McGuinness NJ, Stephens CD. Storage of Orthodontic Study Models in Hospital Units in the U.K. Br. J. Orthod 2014; 19:227-32.
6. Fleming PS, Marinho V, Johal A. Orthodontic measurements on digital study models compared with plaster models: A systematic review. Orthod. Craniofacial Res 2011;14:1–16.
7. Rheude B, Sadowsky PL, Ferriera A, Jacobson A. An evaluation of the use of digital study models in orthodontic diagnosis and treatment planning. Angle Orthod 2005; 75:300-4.
8. Wan Hassan WN, Yusoff Y, Mardi NA. Comparison of reconstructed rapid prototyping models produced by 3-dimensional printing and conventional stone models with different degrees of
crowding. Am. J. Orthod. Dentofac. Orthop 2017;151:209–18.
9. Akyalcin S, Cozad BE, English JD, Colville CD, Laman S. Diagnostic accuracy of impression-free digital models. Am J Orthod Dentofac Orthop 2013; 144:916-22.
10. Stevens DR, Flores-Mir C, Nebbe B, Raboud DW, Heo G, Major PW. Validity, reliability, and reproducibility of plaster vs digital study models: Comparison of peer assessment rating and Bolton analysis and their constituent measurements. Am J Orthod Dentofac Orthop 2006; 129:794-803. 11. Luu NS, Nikolcheva LG, Retrouvey JM, Flores-Mir C, El-Bialy T, Carey JP, Major PW. Linear measurements using virtual study models. Angle orthod 2012; 82:1098-106.
12. Rossini G, Parrini S, Castroflorio T, Deregibus A, Debernardi CL. Diagnostic accuracy and measurement sensitivity of digital models for orthodontic purposes: A systematic review. Am J Orthod Dentofac Orthop 2016;149:161-170.
13. Im J, Cha JY, Lee KJ, Yu HS, Hwang CJ. Comparison of virtual and manual tooth setups with digital and plaster models in extraction cases. Am J Orthod Dentofacial Orthop 2014;145:434-42. 14. Hildebrand JC, Palomo JM, Palomo L, Sivik M, Hans M. Evaluation of a software program for
model analysis for the American Board of Orthodontics objective grading system for dental casts. Am J Or- thod Dentofacial Orthop 2005;128:624-9
16. Okunami TR, Kusnoto B, BeGole E, Evans CA, Sadowsky C, Fadavi S. Assessing the American Board of Orthodontics objective grading system: digital vs plaster dental casts. Am J Orthod Dentofacial Orthop 2007;131:51-6.
17. Filser F, Kocher P, Weibel F, et al. Reliability and strength of all-ceramic dental restorations fabricated by direct ceramic machining (DCM). Int J Comput Dent 2001; 4:89-106.
18. Strub JR, Rekow ED, Witkowski S. Computer-aided design and fabrication of dental restorations: Current systems and future possibilities. J Am Dent Assoc 2006; 137:1289-96.
19. Sun J, Zhang FQ. The Application of Rapid Prototyping in Prosthodontics. J Prosthodont 2012; 21:641-4.
20. Ebert J, Özkol E, Zeichner A, et al. Direct inkjet printing of dental prostheses made of zirconia. J Dent Res 2009; 88:673-6.
21. Torabi K, Ahangari AH, Salehi S, Motamedi M. A Comparison of fracture resistance of zirconia copings made with CAD/CAM technology and slip casting technique. J Dent Shiraz Univ Med Scien. 2012; 12:327–333.
22. Vojdani M, Torabi K, Farjood E, Khaledi AAR. Comparison the Marginal and Internal Fit of Metal Copings Cast from Wax Patterns Fabricated by CAD/CAM and Conventional Wax up Techniques. J Dent Shiraz Univ Med Sci 2013; 14:118–129.
23. Kasparova M, Grafova L, Dvorak P, et al. Possibility of reconstruction of dental plaster cast from 3D digital study models. Biomed Eng Online 2013;12:1-11.
24. Hideo Kodama. A Scheme for Three-Dimensional Display by Automatic Fabrication of Three Dimensional Model. IEICE Transactions on Electronics (Japanese Edition) 1981; J64-C:237–41.
25.
Hideo Kodama. Automatic method for fabricating a three-dimensional plastic model with photo-hardening polymer. Review of Scientific Instruments 1981; 52: 1770–73.26. Hull CV. Apparatus for production of three-dimensional objects by stereolithography. U.S. Patent No. 4,575,330. March 11, 1986.
27. Dandekeri S, Sowmya MK, Bhandary S. Stereolithographic surgical template: A review. J Clin Diagnostic Res 2013; 7:2093-5.
28. www.formlabs.com 29. www.uniz.com
Dentofac Orthop 2017;152:557-565. 31. www.all3dp.com
32. Loflin, W. (2018) The Effect of Print Layer Thickness on the American Board of orthodontics (ABO) Cast-Radiograph Evaluation (CRE) Grading of 3D-printed Models (masters dissertation) 33. Dietrich CA, Ender A, Baumgartner S, Mehl A. A validation study of reconstructed rapid prototyping models produced by two technologies. Angle Orthod 2017;87:782-787.
34. Kim SY, Shin YS, Jung HD, Hwang CJ, Baik HS, Cha JY. Precision and trueness of dental models manufactured with different 3-dimensional printing techniques. Am J Orthod Dentofac Orthop. 2018;153:144-153.
35. Graf S, Cornelis MA, Hauber Gameiro G, Cattaneo PM. Computer-aided design and manufacture of hyrax devices: Can we really go digital? Am J Orthod Dentofac Orthop. 2017;152:870-874.
ACCURACY AND PRECISION OF 3-DIMENSIONAL PRINTED DENTAL MODELS PRODUCED BY DIFFERENT ADDITIVE MANUFACTURING TECHNOLOGIES.
Introduction
Three-dimensional (3D) printing technology has undergone significant advances in recent years, rapidly changing dentistry. This technology is becoming more affordable, efficient, and capable to
provide high printing accuracy. In orthodontics, 3D printing is used to produce study models for diagnosis as well as working models for appliance fabrication.1,2 Additive Manufacturing (AM), also referred to as Rapid Prototyping (RP) is described as a variety of techniques used to rapidly fabricate a scale model of a physical part or assembly using three-dimensional computer-aided design (CAD) data. . The printer reads the CAD data and deposits consecutive layers of liquid, powder, or plastic filaments to build a model from a series of cross sections that are joined together to establish the final shape.3
As defined by its name, three-dimensional printing involves 3 dimensions where “X” and “Y” represent the horizontal plane. The “Z” dimension represents the vertical axis and it is related to the layer height in which a part will be printed. As with any 3D printed structures, the final accuracy of dental models produced by AM can be influenced by the 3D printing system of choice. Currently, many different AM technologies are available. It is important for clinicians to be aware of each system’s properties and characteristics so to appropriately utilize it for the different orthodontic needs.4
similar mode of operation in which a light source is used to promote photopolymerization of resin monomers. The method used to apply this principle is what sets them apart. The SLA printing technique uses a laser beam as the light source, the DLP technique uses a projector, and the LCD-SLA/UDP uses an array of ultraviolet (UV) LCD.5,6
In the SLA technique, the laser must pass through every point of the cross-sectional area to be printed. The DLP projector and the LCD screen permits that an entire layer of polymer be
photopolymerized at once, allowing to a faster printing cycle when compared to SLA. The light directed from a DLP projector expands as it reaches the cross-section area to be printed. Due to the nature of the projected cone of light, the periphery of a printed part may have a higher chance of presenting distorted pixels. Unlike previous technologies, the LCD technology uses panels that have the ability to project the light in a parallel mode, instead of expanding the light. It also selectively filters UV light, which allows the entire layer to be printed faster than DLP.6
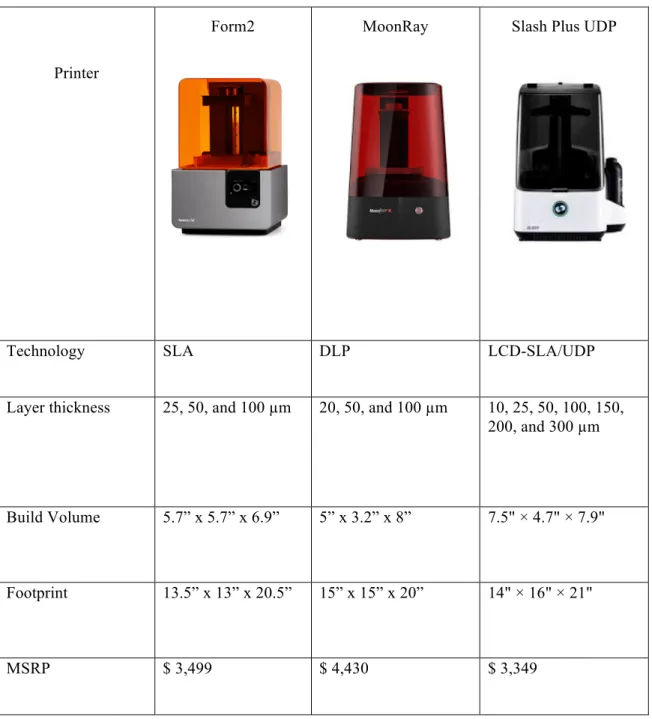
Currently, the two most popular printers used amongst orthodontists are the Form2 (Formlabs, Somerville, MA, USA) and the MoonRay (SprintRay, Los Angeles, CA, USA). They employ SLA and DLP technologies, respectively. The Slash Plus UDP uses LCD printing method, which is a more recent technology and, for that reason, not as popular as Form2 and Moonray.5,6
As the adoption of 3D printing technology by orthodontics practices sees a significant increase, it is important to investigate the accuracy of different systems, notably of 3D printed dental models since they are used for a variety of clinical purposes. To this day, limited data exists on the accuracy of 3D printed dental models and possible differences between various additive processes using different layer thicknesses.
technologies, and that there would be no significant differences between printed models printed at different Z-plane resolutions.
Methods
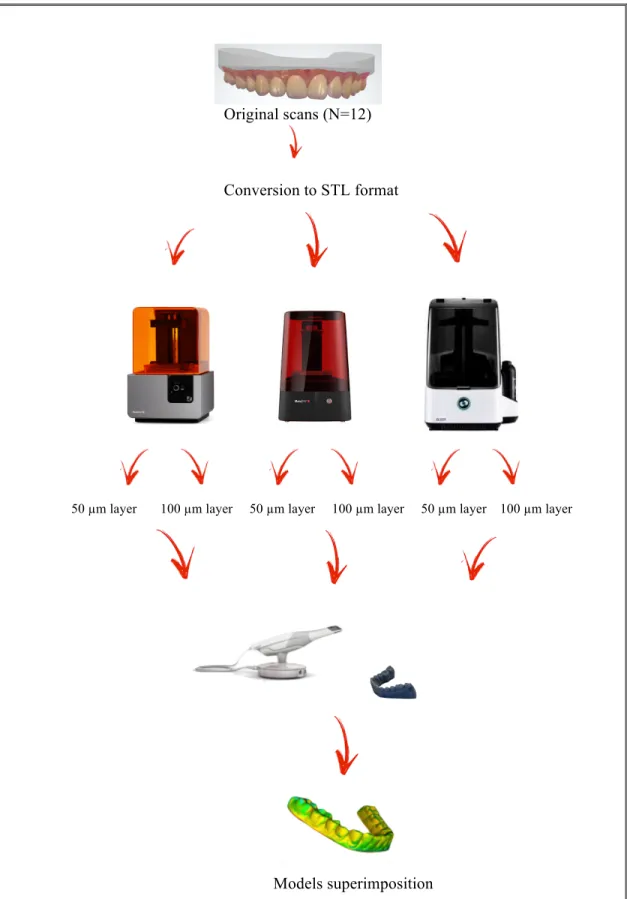
Ethical approval for this study was obtained from the Institutional Review Board (IRB) at the University of North Carolina (Institutional Review Board number 18-3245; reference number 236961). A flowchart illustrating the study methodology is shown in Figure 1. Twelve consecutive 3D digital models (6 maxillary and 6 mandibular) from the UNC Orthodontic database were randomly selected. According to power analysis done on similar precursor studies, a total of 12 dental models were required to
demonstrate significant results in regards to dimensional accuracy of different additive manufacturing technologies.7,8 Models were selected based on the following inclusion criteria: 1) Complete intra-arch permanent dentition from first molar to first molar; 2) Morphology of all involved teeth within normal limits.
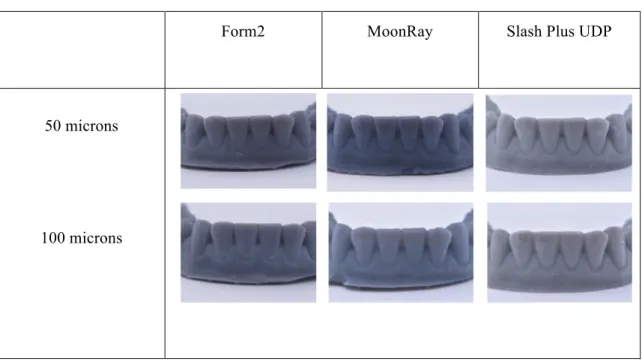
Digital scans were obtained via TRIOSⓇ scanner (3Shape, Copenhagen, Denmark) and exported as surface model stereolithography (STL) files. Digital models were coded to remove any identifiable information, and stored in an encrypted drive. The STL files were converted into physical models using 3 different AM techniques: 1) SLA (Form2), 2) DLP (MoonRay S100), and 3) LCD-SLA/ UDP (Slash Plus UDP) (Figure 2). For every technology, dental models were printed at resolutions of 50 and 100 microns in the Z plane (Figure 3). Photopolymer resins were selected based on the manufacturers
container to prevent exposure to sunlight.
The printed models were rescanned with the TRIOSⓇ scanner to create new digital STL models. The scanner was calibrated before every use and all models were placed in the same orientation during the scanning process. Each model was positioned on the back of its base and was oriented with the dental arch pointing toward the scanner. A scan spray (3M™ High-Resolution Scanning Spray) (Figure 4) was applied in each printed model prior to scanning. A minimal surface coating was sprayed to ensure optimal scanning properties of the models. These new digital models produced STL files that were superimposed to the original ones, which were obtained by the first scanning process. Prior to the superimposition, all models, including the original ones, were cropped digitally to eliminate non-anatomic parts.
A Procrustes analysis, which overlaps 3D images, was done using an open source software (Slicer
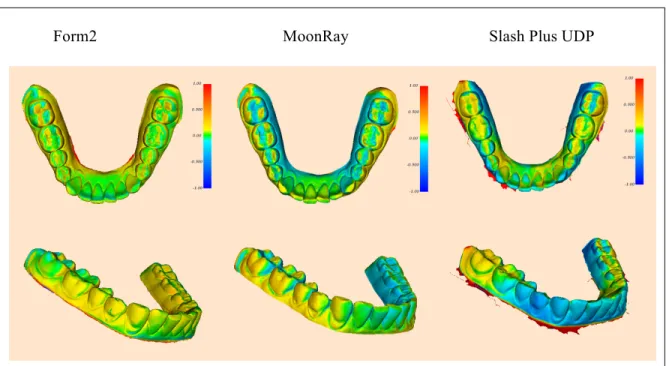
3D CFM 4.0). 9 Reports were generated for each superimposition that listed any deviations between the mesh surfaces of the original files and their corresponding 3D printed models. Figure 4 shows examples
of superimpositions of the digitized SLA, DLP, and LCD-SLA/UDP replicas with the corresponding STL original files. Positive discrepancies are represented by a range from yellow to red, and show areas of the print that are larger when compared to the original dataset. Negative discrepancies are represented by a range from light to dark blue, and show areas of the print that are smaller when compared to the original dataset. The green areas indicate few or no deviations between the superimposed models equivalent to less than 0.1 millimeter when compared to the original scan. Five randomly selected models were re-measured after 2 weeks to ensure the measurements could be accurately replicated. The same investigator recorded all measurements on two separate occasions. Any differences between the two sets of
Results
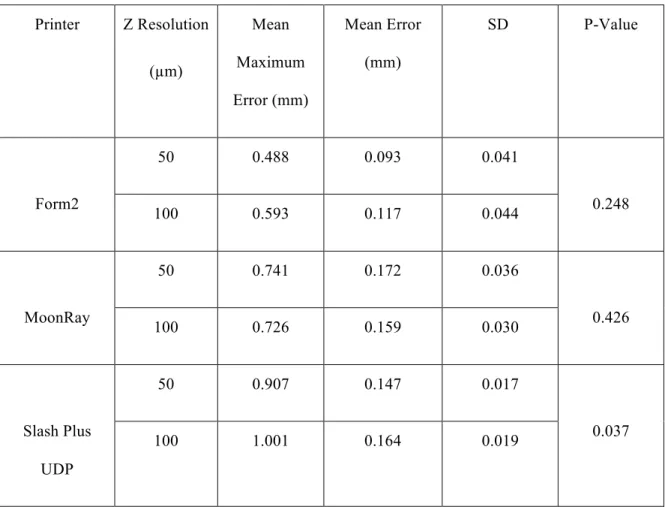
The results of the difference in the overall accuracy between 50 and 100 µm layer thicknesses for each 3D printer are presented in Table 1. No statistical significant difference between 50 and 100 µm layer thicknesses was found for the SLA technology (Form2) (p 0.0248), and for the DLP technology (MoonRay S100) (p 0.426). The LCD-SLA/ UDP technology (Slash Plus UDP) showed statistical significant differences between 50 and 100 µm layer thicknesses (p 0.019), presenting a lower mean error value for the 50 µm layer (0.147 mm) when compared to the 100 µm layer (0.164 mm). Among the 3D printers investigated, the lowest mean error value was found for models produced by the SLA technology (Form2), with a 50 µm layer thickness (0.172 mm). The highest mean error value was observed on models produced by the DLP technology (MoonRay S100), also with a 50 µm layer thickness (0.172 mm). The SLA technology (Form2) showed the lowest value for mean maximum error, followed by MoonRay, and Slash Plus UDP.
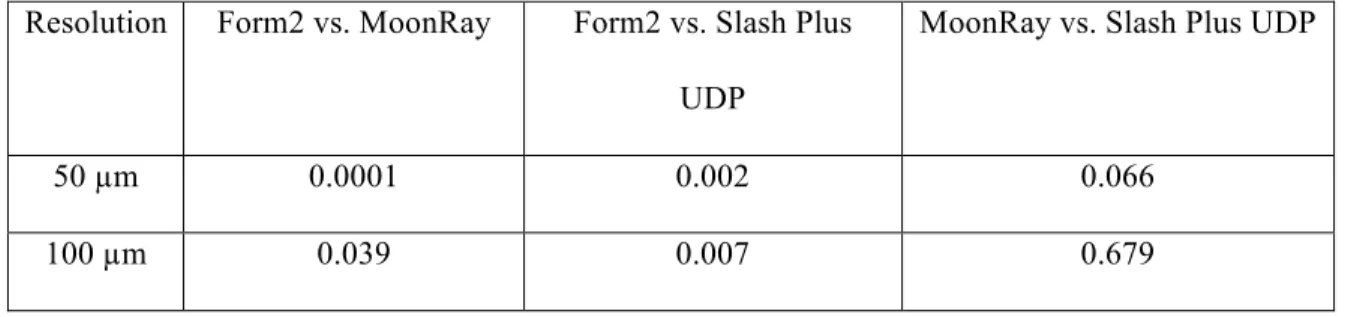
Table 2 shows the results of overall accuracy between 3D printers by different layer thicknesses. The SLA technology (Form2) showed statistically significant difference from DLP (MoonRay S100) and LCD-SLA/ UDP (Slash Plus UDP) for both 50 µm (p 0.0001) and 100 µm (p 0.039) layer thicknesses. No significant difference was observed between DLP (MoonRay) and LCD-SLA/ UDP (Slash Plus UDP).
Discussion
The objectives of the present study were to investigate the accuracy of dental models manufactured by different 3D printing technologies, and to evaluate the accuracy of the 3D-printed dental models at different layer thicknesses..
smoother surface finish and better surface detail of the model. For this reason, it could be assumed that a 50 µm layer thickness 3D print would exhibit a better resolution than a 100 µm layer thickness print. Despite the fact that a reduced layer thickness is expected to provide more detail in a 3D printed model, it does not necessarily mean that it will provide superior accuracy when compared to a model produced with a larger layer thickness, as it is often assumed. Our data showed no statistical significance in accuracy for different layer thicknesses for both SLA (Form2) and DLP (MoonRay S100) technologies. Although the difference between 50 and 100 µm layer models produced by the LCD-SLA/ UDP (Slash Plus UDP) technology was statistically significant. This difference corresponds to 0.017mm and is not considered clinically relevant.
The superior overall accuracy found for the SLA (Form2) technology, when compared to DLP (MoonRay S100) and LCD-SLA/UDP (Slash Plus UDP), may be attributed to the fact that this
technology uses a laser beam that cures every point of the entire printing layer, turning the process time-consuming but also highly accurate. The DLP and LCD-SLA/UDP technologies are able to cure an entire layer at once. The cone of light projected by the DLP can also interfere with the XY resolution since it may create distorted pixels, which can affect the periphery of a printed part. The resulting irregularities found on the boundaries of each layer will affect the accuracy of the 3D printed model. The XY resolution, also known as “minimal feature size”, corresponds to 140 µm, 100 µm, and 75 µm for SLA, DLP, and LCD-SLA UDP, respectively. This feature is set by the manufacturer, so standardization for comparison purposes is not possible.10-12
An important characteristic of our methodology is that the original digital models were obtained directly from the oral environment, and then compared to the scanned 3D printed models. This allowed us to assess accuracy of 3D printed models while eliminating variables that could have been introduced during acquisition by means of alginate impressions. On the other hand, the 3D printed models had to be scanned to be digitally superimposed with the original models. However, the TRIOSⓇ scanner provides
significant than those introduced by the printing techniques.13
Previous studies on accuracy of 3D printed models compared plaster to 3D printed models through linear measurements using a digital caliper.14-17 To evaluate the discrepancies between the original scans and the 3D printed models, we opted to use digital superimposition. Mathematical superimposition has the ability to overcome human errors related to landmark identification.
A digital model produced by additive manufacturing can be influenced by factors that would include a possible distortion produced with data conversion and manipulation during formatting to STL file, and also model shrinkage during fabrication and post-curing process. If these errors were part of the present study, all 3D printed models would have been influenced. Previous studies have determined a range of error that would be considered clinically acceptable when evaluating accuracy of 3D printed models. The data from these studies showed 0.20 to 0.50 mm to be an acceptable range for clinical accuracy.14,18-22 Taking this range in consideration, the 3D printing technologies included in our study produced 3D printed models that are suitable for diagnostic and treatment planning.
A previous study conducted by Favero et al. showed an increase in deviation values directly proportional to an increase in Z resolution values. The 100 µm layer thickness group showed increased accuracy when compared to the 50 µm and 25 µm layer thickness groups in terms of deviation from the original digital model. The 25 µm layer models presented the greatest deviations, while the 100 µm layer models showed the smallest deviation. The authors attributed that to the increased potential for errors and artifacts as the amount of layers required to print a given part increases. Despite of the differences, all values were considered clinically acceptable. The selection of layer thickness must take in consideration not only accuracy, but also factors such as cost, surface quality, and efficiency. In our study, No
The intraoral scanner (TRIOSⓇ) used to scan the printed 3D models was the same used to obtain
the original intraoral scans. The TRIOSⓇ scanner is a powder-free system based on ultrafast optical scanning technology and has documented high accuracy.24, 25 Although the original intraoral scan used does not require a scan spray, difficulties were found during the scanning process of the 3D printed models. The scan was not able to capture continuous images of the models, likely due to the highly different optical properties of oral tissues and printing polymers. The scanners produced were grossly inaccurate and irregular. In an attempt to eliminate the issue and obtain quality scans of the models, we opted for applying a thin layer of the 3M™ High-Resolution Scanning Spray over all printed models. This scanning spray has the ability to adjust the optical reflective properties of intraoral surfaces to allow for proper capture of 3D digital images. In our study, we found this to be true for models surfaces as well.
Although the 3D printed models had to be coated by scanning spray powder, the coating thickness was kept to a minimal. A previous study comparing the surface morphologies and coating thickness of 3 different spray scan systems was done using confocal laser scanning microscopy. The mean coating thickness ranged from of 18.9 µm to 25.3 µm. The study concluded that all coating thickness values were clinically acceptable.26
Conclusion
REFERENCES
1. Christensen LR. Digital workflows in contemporary orthodontics. APOS Trends Orthod 2017; 7: 12-8. 2. Graf S, Cornelis M, Gameiro G, and Cattaneo P. Computer-aided design and manufacture of hyrax devices: Can we really go digital? Am J Orthod Dentofacial Orthop 2017; 152: 870-4.
3. Beguma Z, Chhedat P. Rapid prototyping—when virtual meets reality. Int J Comput Dent 2014; 17: 297-306.
4. Wu W, Ye W, Wu Z, Geng P, Wang Y, Zhao J. Influence of Layer Thickness, Raster Angle, Deformation Temperature and Recovery Temperature on the Shape-Memory Effect of 3D-Printed Polylactic Acid Samples. Materials 2017; 10: 970.
5. Nguyen T, Jackson T. Understanding the Fundamentals of 3D printing. In: Kim-Berman H, Franchi L, Ruellas A, eds. Effective, Efficient and Personalized Orthodontics: Patient-centered Approaches and Innovations. Craniofacial Growth Series, Center for Human Growth and Development, The University of Michigan, Ann Arbor, MI 2018; 55:281-293.
6. LCD vs DLP - Resin 3D Printing Technologies Compared. https://all3dp.com/2/lcd-vs-dlp-3d-printing-technologies-compared/
7. Hazeveld A, Huddleston Slater, and Ren Y. Accuracy and reproducibility of dental replica models reconstructed by different rapid prototyping techniques. Am J Orthod Dentofacial Orthop no. 2014; 104: 108-15.
8. Rebong RE, Stewart KT, Utreja A, Ghoneima AA. Accuracy of three-dimensional dental resin models created by fused deposition modeling, stereolithography, and Polyjet prototype technologies: A
comparative study. Angle Orthod. 2018; 3: 363-69.
9. 3D Slicer. 2017 [cited 2017 March 7, 2017]; Available from: slicer.org. 10. Form2 Tech Specs. https://formlabs.com/3d-printers/form-2/tech-specs/
11. Technical Specifications. https://sprintray.com/moonray-desktop-3d-printer/technical-specifications/ 12. Slash plus UDP. https://www.uniz.com/us_en/page/3d-printers-slashplus-udp
13. Nedelcu RG, Persson AS. Scanning accuracy and precision in 4 intraoral scanners: an in vitro comparison based on 3-dimensional analysis. J Prosthet Dent 2014; 6:1461-71.
14. Hazeveld A, Huddleston Slater, and Ren Y. Accuracy and reproducibility of dental replica models reconstructed by different rapid prototyping techniques. Am J Orthod Dentofacial Orthop 2014; 145:108-15.
15. Rebong RE, Stewart KT, Utreja A, Ghoneima AA. Accuracy of three-dimensional dental resin models created by fused deposition modeling, stereolithography, and Polyjet prototype technologies: A
comparative study. Angle Orthod. 2018; 3: 363-69.
17. Murugesan K, Anandapandian PA, Sharma SK, and Kumar MV. Comparative evaluation of
dimension and surface detail accuracy of models produced by three different rapid prototype techniques. J. Indian Prosthodont 2012; 1:16-20.
18. Hassan WN, Yusoff Y, Mardi NA. Comparison of reconstructed rapid prototyping models produced by 3-dimensional printing and conventional stone models with different degrees ofcrowding. Am J Orthod Dentofacial Orthop 2017; 151:209-18.
19. Schirmer UR, Wiltshire WA. Manual and computer-aided space analysis: a comparative study. Am J Orthod Dentofacial Orthop 1997; 112:676-80.
20. Hirogaki Y, Sohmura T, Satoh H, Takahashi J, Takada K. Complete 3-D reconstruction of dental cast shape using perceptual grouping. IEEE Trans Med Imaging 2001; 20:1093-101.
21. Halazonetis DJ. Acquisition of3-dimensional shapes from images. Am J Orthod Dentofacial Orthop 2001; 119:556-60.
22. Bell A, Ayoub AF, Siebert P. Assessment of the accuracy of a three- dimensional imaging system for archiving dental study models. J Orthod 2003; 30:219-23.
23. Favero CS, English JD, Cozad BE, Wirthlin JO, Short MM, Kasper FK. Effect of print layer height
and printer type on the accuracy of 3-dimensional printed orthodontic models. American Journal of Orthodontics and Dentofacial Orthopedics 2017; 4:557-565.
24. Hack GD, Patzelt SBM. Evaluation of the Accuracy of Six Intraoral Scanning Devices: An in-vitro Investigation. ADA Professional Product Review 2015;4:1-5.
25. Ender A, Zimmermann M, Attin T, Mehl A. In vivo precision of conventional and digital methods for obtaining quadrant dental impressions. Clin Oral Investig 2015; 7:1495-504.
26. Lehmann KM, Azar MS, Wentaschek S, Scheller H. The Effect of Optical Conditioning of Preparations with Scan. Acta Stomatol Corat 2011; 2:86-92.
APPENDIX 1: TABLES AND FIGURES
Table 1. Difference in overall accuracy between different layer thicknesses (Z resolution) for each 3D
printer. Level of significance set to ≤ 0.05.
Printer Z Resolution
(µm)
Mean Maximum Error (mm)
Mean Error (mm)
SD P-Value
50 0.488 0.093 0.041
Form2
100 0.593 0.117 0.044 0.248
50 0.741 0.172 0.036
MoonRay
100 0.726 0.159 0.030 0.426
50 0.907 0.147 0.017
Slash Plus UDP
Table 2. Difference in overall accuracy between 3D printers by different layer thicknesses (Z resolution).
Level of significance set to ≤ 0.05.
Resolution Form2 vs. MoonRay Form2 vs. Slash Plus UDP
MoonRay vs. Slash Plus UDP
50 µm 0.0001 0.002 0.066
100 µm 0.039 0.007 0.679
Table 3. Photopolymer resins based on the manufacturers recommendations.
Printer Form2 MoonRay Slash Plus / UDP
Resin Formlabs Gray Resin (RS-F2-GPGR-04)
SprintRay Model Gray (SGR – 12419)
Figure 1: Study methodology flowchart.
Original scans (N=12)
Conversion to STL format
50 µm layer 100 µm layer 50 µm layer 100 µm layer 50 µm layer 100 µm layer
Figure 2: Chart comparing the 3D printing technologies and printers investigated in this study.
Printer
Form2 MoonRay Slash Plus UDP
Technology SLA DLP LCD-SLA/UDP
Layer thickness 25, 50, and 100 µm 20, 50, and 100 µm 10, 25, 50, 100, 150, 200, and 300 µm
Build Volume 5.7” x 5.7” x 6.9” 5” x 3.2” x 8” 7.5" × 4.7" × 7.9"
Footprint 13.5” x 13” x 20.5” 15” x 15” x 20” 14" × 16" × 21"
MSRP $ 3,499 $ 4,430 $ 3,349
Figure 3: Close up view of models printed at 50 micron and 100 micron resolution.
Form2 MoonRay Slash Plus UDP
50 microns
100 microns
Figure 4: 3M™ High-Resolution Scanning Spray (A) applied on printed models (B). Close up view of
Figure 5: Superimposition of 3D printed models to their original counterpart.