MODELING CELL CYCLE PHASE TRANSITIONS AND ARREST DECISIONS UPON DNA DAMAGE
Hui Xiao Chao
A dissertation submitted to the faculty at University of North Carolina at Chapel Hill in partial fulfillment of the requirements for the degree of Doctor of Philosophy in the
Department of Bioinformatics and Computational Biology.
Chapel Hill 2019
ABSTRACT
Hui Xiao Chao: Modeling Cell Cycle Phase Transitions and Arrest Decisions Upon DNA Damage
(Under the direction of Jeremy Purvis)
Furthermore, DNA damage checkpoints showed distinct dynamics in each phase, with gap phase checkpoints being the most stringent and the S phase checkpoint being the least sensitive to damage. Our study challenges existing
ACKNOWLEDGEMENTS
My journey through the graduate school has been full of joy and excitements because of the mentors and peers surrounded me. My PI, Dr. Jeremy Purvis, is the kind of mentor that every student would hope for. He deeply cares for his students in every aspect. To grow me scientifically, he provides enormous amounts of opportunities for me to give public speeches attend conferences, workshops. He spends tremendous time preparing me to give good presentations and giving me feedbacks, and I never had to worry about financial issues in attending conferences that are cross-continent. He also finds funding opportunities for me and pushes me to write grants, giving all the guidance and help possible along the way. He always has the students’ best interests and spares no efforts in developing me as a person, promoting my growth in emotional intelligence. When I encounter frustration and depression, he always empathizes with me and listen to me, making me feel supported through the hardships. He also cares about my family and tried to help my spouse during his job search. It is said that, to just meet someone in one’s lifetime requires 500 years of praying and practicing before incarnation. I do not remember how many years I have prayed for meeting such a wonderful mentor in my lifetime, but there is no word to express how grateful I am for having Jeremy as my thesis advisor and mentor. And I know he will not stop being my mentor after I graduate.
technical issues such as fixing the microscope when I ran into problems, to
recommending running clinics for Clark and my injuries. Phillip Coryell cheers me up and lightens my days when I feel down. Ray Haggerty organizes all the fun for the lab such as decoration contests, board games, escape rooms, and virtual augmentation, making my memories of the lab full of laughers. Kasia Kedziora always spares no efforts in helping with me project. She also warms up my heart and helps me re-find my souls when I am lost. Wayne constantly checks on my mental states to make sure I have all the supports needed from the lab. Cere has been through a lot with me. I mean a lot of gels filled with failed PCRs. And thank you for not abandoning me and sticking to our project to get it finally out. Randy is a dedicated and reliable labmate who I know I can trust when I need him. Hristo is patient in tracking numerous cells and being cheerful when I am down. Chi shared my enthusiasm for the project and makes me feel the most alive throughout the PhD years. Ashley Privette patiently tracked all the cells despite lots of sickness. Angela had to bear with my heavy work demands and took care of all my stem cells when I was away at home in Taiwan. Maggie helped me track many cells and helped me design the bachelorette party. Gavin has been one the strongest supports for my projects, teaching and providing all the cloning and cell lines that are essential for all my projects. And all the other wonder labmates that I have had the fortune to have, I am so grateful for you being there for me. I will carry these
memories for the rest of my life.
I would like to thank my committee members: Dr. Yue Xiong for his critical
exciting collaboration opportunities along with Rashmi; Dr. Shawn Gomez for inputs on my Erlang model as well as caring about my progresses in the hallway. I am very
grateful for Dr. Jean Cook for her mentorship. Even though she is not on my committee, she has been committed in mentoring me and giving me invaluable advices and
resources with her cell cycle expertise.
Administrative paper works are often boring, tedious, and sometimes dreadful, but with our wonderful student services manager, John Cornett, I actually look forward to dropping by his office. This is because John always shows his sincere care for his student and makes me feel warm. I am so lucky to have John taking care of my paper works as well as my spirit, and I cannot thank him enough. I also want to thank all the people in the Genetics Department for taking care of my finances, travels, and other logistics—Cara Marlow, Cathy Cornett, Mike Harriss, Jackie Boyden, Ann Nochlin, Sam Robinson, Minh Quach, and everyone else.
During my graduate study, I have made some achievements and received some honors, but there are lots of great sacrifice behind that is unseen. For me to be the person who I am today, my family has made huge. My mother gave up her career as a physician in the US so that she could raise me up in Taiwan. When I turned 20, she missed me dearly but encouraged me to leave my home country to chase my dream to become an MD-PhD. My father provided all the financial supports so that I can focus on my education. My little sister suddenly lost a day-by-day companion and often cried in loneliness. My boyfriend at that time (now husband) had to separate with me by ten thousand miles but still had to teach me physics sometimes through Skype. My family has been fully supported of me, but I could only spare about once a year to visit them. My husband had to sacrifice his career as a theoretical physicist in condensed matter to reunite with me and support me. There is no way that I can fully express my
gratitude for my family’s sacrifice, but I promise to keep my family the top of my priority and to devote my love to you for the rest of my life.
TABLE OF CONTENTS
LIST OF TABLES ... xiii
LIST OF FIGURES ... xiv
LIST OF ABBREVIATIONS ... xvii
CHAPTER 1: BACKGROUND ... 1
1.1 A General Description of the Cell Cycle ... 1
1.2 DNA Damage Checkpoint and the Cell Cycle ... 4
1.3 Cell Fate Decision Upon DNA Damage ... 6
1.4 Working Hypothesis for My Dissertation ... 8
REFERENCES ... 9
CHAPTER 2: EVIDENCE THAT THE HUMAN CELL CYCLE IS A SERIES OF UNCOUPLED, MEMORYLESS PHASES ... 12
2.1 Overview... 12
2.2 Introduction ... 13
2.3 Results... 14
2.3.1 Cell cycle phase durations are uncoupled under unstressed conditions ... 14
2.3.2 Each cell cycle phase follows an Erlang distribution with a characteristic timescale and rate ... 16
2.3.3 Cell cycle phase durations remain uncoupled when phase durations are altered. ... 19
2.3.4 A model for heritable factors governing independence of phase duration ... 22
2.3.6 Uncoupling between cell cycle phases is disrupted in a
cancer cell line ... 25
2.4 Materials and Methods ... 52
2.4.1 Cell culture ... 52
2.4.2 Chemical and genetic perturbation of the cell cycle phases ... 52
2.4.3 Cell line construction ... 53
2.4.4 Time-lapse microscopy ... 54
2.4.5 Image analysis ... 54
2.4.6 In silico mapping of cell cycle progression in individual cells ... 56
2.4.7 Statistical analysis and sample size ... 56
2.4.8 Immunofluorescence ... 56
REFERENCES ... 57
CHAPTER 3: ORCHESTRATION OF DNA DAMAGE CHECKPOINTS ACROSS THE HUMAN CELL CYCLE ... 61
3.1 Overview... 61
3.2 Introduction ... 62
3.3 Results... 62
3.3.1 A quantitative model of DNA damage checkpoint dynamics and cell cycle phase transitions ... 62
3.3.2 Quantification of cell cycle progression in individual, asynchronously proliferating cells ... 64
3.3.3 Computational model of cell cycle progression ... 66
3.3.4 Each cell cycle phase displays distinct DNA damage checkpoint dynamics ... 67
3.3.6 G1 and G2 checkpoints completely halt cell cycle
progression ... 72
3.3.7 The graded slowdown and non-terminal commitment point location link cell cycle outcome to cell cycle stage. ... 75
3.4 Materials and Methods ... 98
3.4.1 Cell culture ... 98
3.4.2 Cell line construction ... 98
3.4.3 Time-lapse microscopy ... 99
3.4.4 Image analysis ... 99
3.4.5 In silico mapping of cell cycle progression in individual cells ... 100
3.4.6 Immunofluorescence ... 100
3.4.7 Model simulations and parameter fitting ... 100
3.4.8 Quantification and statistical analysis ... 104
REFERENCES ... 105
CHAPTER 4: DISCUSSION AND FUTURE DIRECTIONS ... 107
4.1 Discussion on the Model for Cell Cycle Progression ... 107
4.2 Discussion on the DNA Damage Checkpoint Dynamics ... 112
4.3 Overview of Preliminary Results ... 118
4.3.1 The mitosis-senescence decision is controlled by a bifurcation in CDK2 activity at S-phase exit mediated through p21 ... 118
4.4 Preliminary Results ... 119
4.4.1 DNA damage in S phase lead to heterogeneous cell fates in the subsequent G2 ... 119
4.4.3 The mitosis-senescence decision is contributed by the DNA damage repair, but not the timing of damage or the
damage level incurred. ... 121
4.4.4 The CDK activity bifurcation is mediated by p21 level bifurcation and is partially dependent on p53 ... 123
4.5 Materials and Methods ... 135
4.5.1 Cell culture ... 135
4.5.2 Chemical and genetic perturbation of the cell cycle phases ... 135
4.5.3 Cell line construction ... 135
4.5.4 Time-lapse microscopy ... 136
4.5.5 Image analysis ... 136
4.5.6 Immunofluorescence ... 137
4.6 Proposed Future Directions ... 137
LIST OF TABLES
Table S2.1. Correlation coefficient and significance with different linear
regression methods. ... 51 Table S3.1. Related to Figure 3.3. Fitting parameters for the
“arrest-and-restart” checkpoint model reveal dependencies of halt duration and
permanent arrest probability on damage level. ... 95 Table S3.2. Related to Figure 3.3. The refined checkpoint model with
all-or-none kinetics improves fits for the gap-phase checkpoints. ... 96 Table S3.3. Related to Figure 3.3. The refined checkpoint model with
LIST OF FIGURES
Figure 1.1. Smith and Martin model of the cell cycle transition ... 3 Figure 1.2. A Stretched model of the cell cycle ... 4 Figure 2.1. Variation and lack of correlation among cell cycle phase
durations in single human cells ... 29 Figure 2.2. Erlang model of cell cycle progression ... 30 Figure 2.3. Lack of coupling among cell cycle phases under perturbation ... 31 Figure 2.4. A model for heritable factors governing the rate of cell cycle
phase progression ... 32 Figure 2.5. Stress-induced coupling of cell cycle phases in a cancer cell
line... 33 Figure S2.1 The PCNA-mCherry reporter and imaging condition do not
alter the cell cycle dynamics ... 34 Figure S2.2. Pairwise correlations between cell cycle phases with
automated phase detection and PIP-FUCCI reporter ... 35 Figure S2.3. The quiescent (G0) population under proliferating conditions
is low compared to other phases ... 37 Figure S2.4. Pairwise correlations between cell cycle phases in three
human cell lines. ... 38 Figure S2.5. Correlation among cell cycle phase durations between sibling
cells and between adjacent mother daughter gap phases ... 39 Figure S2.6. The Pearson correlation coefficient’s dependence on
sampling frequency ... 40 Figure S2.7. Fitting with a single rate parameter for all phases is
insufficient to recapitulate the cell cycle distribution. ... 41 Figure S2.8. Perturbing cell cycle phase durations and phase coupling in
RPE cells ... 44 Figure S2.9. Phase coupling with DNA damage perturbation ... 45 Figure S2.10. Correlation in cell cycle phase durations and its origin ... 46 Figure S2.11. A model for the heritable factors governing phase
Figure S2.12. Bootstrap analysis for correlation coefficients between cell
cycle phases under perturbation in U2OS ... 49 Figure 3.1. Model of DNA damage checkpoint dynamics ... 79 Figure 3.2. Measuring and modeling cell cycle phase progression in single
cells ... 80 Figure 3.3. Each cell cycle phase exhibits distinct DNA damage
checkpoint dynamics ... 81 Figure 3.4. The G1 and G2 DNA damage checkpoints enforce a complete
halt to cell cycle progression by an interval that is proportional to the
damage level. ... 82 Figure 3.5. Cell cycle outcomes as a function of cell cycle phase at the
time of DNA damage ... 83 Figure 3.6. Cell cycle outcomes depend on the timing of DNA damage
both within and between cell cycle phases ... 84 Figure 3.7. Summary of checkpoint dynamics as a function of cell cycle
phase in RPE cells. ... 85 Figure S3.1. Related to Figure 3.2. Characterization of cell cycle
progression by the PCNA-mCherry reporter ... 86 Figure S3.2. Related to Figure 3.3. Quantifying the effects of DNA damage
on cell cycle progression ... 87 Figure S3.3. Related to Figure 3.3. Each cell cycle phase implements a
distinct DNA damage checkpoint response ... 88 Figure S3.4. Related to Figure 3.3. Model fitting of the cell cycle
phase-specific transition curves in response to acute DNA damage ... 89 Figure S3.5. Related to Figure 3.4. Cell cycle phase-specific checkpoint
dynamics and subsequent cell fate as a function of DNA damage level. ... 90 Figure S3.6. Related to Figure 3.5. Cell cycle response as a function of
cell cycle progress into the phase of damage ... 92 Figure S3.7. Related to Figure 3.6. The timing of DNA damage within cell
cycle phase affects the cell cycle outcomes ... 93 Figure 4.1. DNA damage in S phase lead to heterogeneous cell fates in
Figure 4.2. The mitosis-senescence decision is controlled by a bifurcation
in CDK activity at S-phase exit ... 127
Figure 4.3. The mitosis-senescence decision is contributed by the DNA damage repair process, but not the timing of damage or the damage level incurred ... 128
Figure 4.4. The CDK activity bifurcation is mediated by p21 and is partially dependent on p53 ... 130
Figure S4.1. Characterization of cell cycle phase distribution ... 132
Figure S4.2. Characterization and quantification of the 53BP1-EYFP reporter ... 133
Figure S4.3. Knockdown efficiency by siRNA for p21 and p53 ... 134
Figure 4.5. CDK activity drop is inhibited by inhibiting protein synthesis ... 139
Figure 4.6. CDK dynamics in single cells ... 139
Figure 4.7. Inhibition of CDK activity drop is determined by a CDK threshold ... 140
LIST OF ABBREVIATIONS
53BP1: p53 binding protein APH: aphidicolin
ATM: ataxia telangiectasia mutated Chk1: checkpoint kinase 1
ATR: ATM and RAD3-related CHX: cycloheximide
DAPI: 4′,6-diamidino-2-phenylindole DDR: DNA damage response DNA: deoxyribonucleic acid
DNA-PK: DNA-dependent protein kinase DSB: double strand break
EdU: 5-ethynyl-2′-deoxyuridine
FUCCI: fluorescence ubiquitination-based cell cycle indicator γH2AX: phosphorylated H2A histone family member X
NCS: neocarzinostatin
PCNA: proliferating cell nuclear antigen
CHAPTER 1: BACKGROUND
1.1 A General Description of the Cell Cycle
The discovery that DNA synthesis occurs during a well-defined period of time between cell divisions1 led to the development of the canonical four-stage cell cycle model comprising G1, S, G2, and M phases. It has long been known that the durations of these phases can vary considerably across cell types2. For example, stem cells and immune cells have relatively brief G1 durations compared to somatic cells3–5. Phase durations can also change under certain environmental stresses such as starvation, which lengthens G16, or DNA damage, which mainly prolongs G1 and G27,8.
Furthermore, examination of individual cells has revealed that phase durations vary even among clonal cells under similar environmental conditions2. These apparently stochastic differences in cell-cycle durations were originally attributed exclusively to the G1 phase9. However, more recent studies in multiple cell types have revealed that S and G2 also contribute significant variability to total cell cycle duration10–12. Collectively, these studies have revealed that differences in cell cycle durations are an inherent property of individual cells and raise the fundamental question of how these durations are determined.
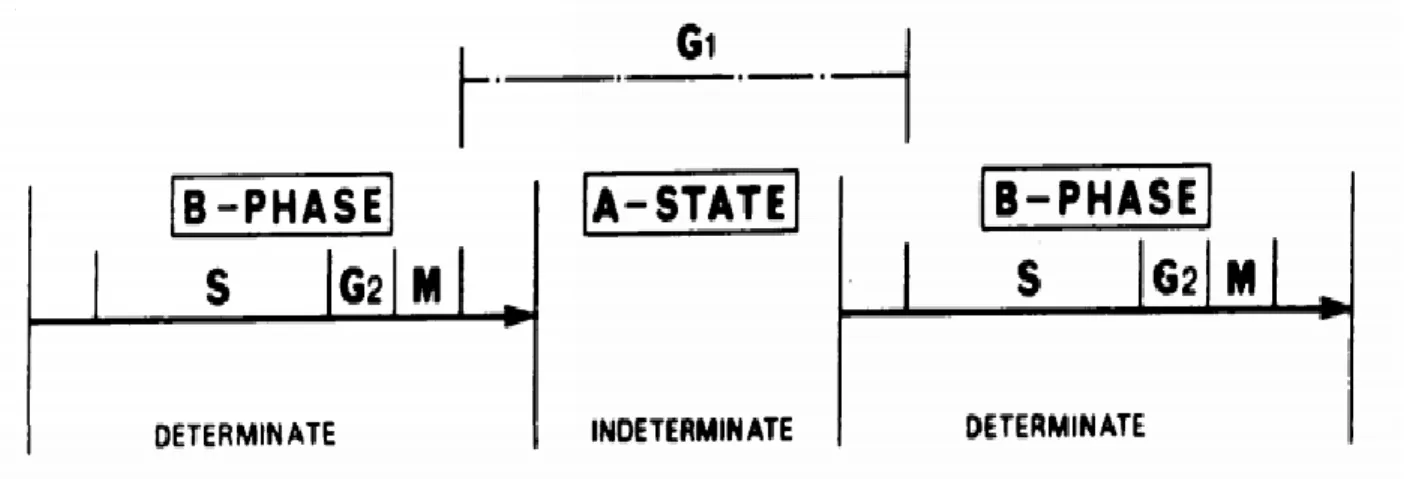
that includes most of G1, and a determinate part (“B-phase”) composed of the
combined S-G2-M phases and the remaining duration of G1 (Figure 1.1)13. The widely accepted implication of this model is that variability in total cell cycle duration stems mostly from G1 and that the durations of the A-state and B-phase are uncorrelated (since one is fixed and the other is random). However, a more recent body of work using time-lapse fluorescence microscopy suggests that cell-cycle phase durations may in fact be correlated. Using the FUCCI fluorescent reporter system14 to estimate the onset of S phase in proliferating mouse lymphocytes, the duration of the combined S-G2-M phase was reported to be proportional to the total cell cycle duration (Figure 1.2)10,15. This “stretched” cell cycle model suggests that S-G2-M contributes a substantial amount of variation to total cell cycle duration and claims that a shared factor may affect progression through multiple phases. In contrast, Araujo et al. showed that the duration of M phase is not correlated with total cell cycle length and is instead “temporally insulated” from upstream events16. Unifying these observations will require a physical model that can explain the quantitative relationships between phase durations in proliferating cells.
phase durations is also consistent with the observation that sister cells show strong correlations in their phase durations15,23. Recent quantification of G1 and S-G2-M showed that G1 itself is heritable and highly correlated between sisters15. Reconciling the heritable nature of phase durations with the question of phase coupling is necessary for building a comprehensive picture of cell cycle progression in individual cells.
Figure 1.2. A Stretched model of the cell cycle.In the stretched cell cycle model, all parts of the cell cycle are proportional to the total cell cycle length. (Adapted from Dowling et al. PNAS. 2014 Apr 29;111(17):6377-82.)
1.2 DNA Damage Checkpoint and the Cell Cycle
Cell cycle progression is restrained by multiple checkpoint mechanisms that block transitions between cell cycle phases when cells encounter stressful conditions. For example, DNA damage activates checkpoints that delay cell cycle progression and trigger DNA repair. Under severe stress, DNA damage checkpoints may trigger
permanent cellular outcomes such as apoptosis or senescence. Failure to fully activate DNA damage checkpoints can lead to genome instability, as the unrepaired DNA damage can be passed on to the next generation of cells 24,25. On the other hand, because cells routinely experience low levels of endogenous DNA damage 26, timely checkpoint recovery after DNA damage repair is necessary for continued cell
regulated to continue proliferation in the face of constant exposure to endogenous and exogenous DNA damage sources.
Activation of DNA damage checkpoints is often accompanied by cell cycle arrest, which provides a temporal delay necessary to repair DNA lesions before resuming proliferation 28–30. The precise timing of events during a DNA damage checkpoint response is not entirely clear. For example, it is not known how abrupt the pause is; whether the pause is a complete halt or a graded reduction in cell cycle progression; or how the duration of the pause changes in response to different DNA damage doses or during different cell cycle phases. Recent live-imaging studies in single cells have shed light on some of the underlying parameters that confer differential sensitivity to
endogenous DNA damage. For example, cell-to-cell variation in p21 levels leads to differences in checkpoint stringency (i.e., the robustness of cell cycle arrest in response to DNA damage) 7,31. However, the underlying parameters that result in differential responses within a cell cycle phase and in response to exogenous DNA damage are generally unknown. Knowledge of these collective dynamical behaviors—which we refer to as DNA damage checkpoint dynamics—is necessary for understanding the
relationship between the DNA damage response and functional cellular outcomes such as permanent cell cycle arrest.
show drastic differences in survival under the same levels of ionizing radiation, which induces DSBs 33. The underlying basis for these differences in cell survival is not clear. One explanation for the observed differences in survival among the cell cycle phases is that each phase employs unique molecular mechanisms to enforce the checkpoint. Indeed, the concept of distinct DNA damage checkpoint mechanisms at different stages of the cell cycle, such as G1/S, intra-S, and G2/M, has long existed. Precisely how these checkpoint dynamics are executed throughout each cell cycle phase, however, is not clear and requires real-time analysis of DNA damage checkpoint responses. Thus, a quantitative understanding of DNA damage checkpoint dynamics is crucial to linking the molecular pathways to predicted cell cycle outcomes. This knowledge would not only help explain the difference in cell viabilities in response to DNA damage in different cell cycle phases but would greatly inform efforts to predict clinical outcomes of genotoxic chemotherapies, which often target cells in a specific cell cycle phase.
1.3 Cell Fate Decision Upon DNA Damage
Proliferating cells needs to faithfully pass on their DNA content to the next generations. Actively replicating cells are under constant DNA damage threat.
state called senescence, or execute self-destruction termed apoptosis, in which the cell permanently exits the cell cycle. Permanent cell-cycle exit is usually assumed to
associate with more severe DNA damage that is beyond the cell’s repair capacity. However, what determines the cell fate decision upon DNA damage is not completely understood.
In actively replicating cells, the source of DNA damage can be endogenous, such as due to replication stress, or exogenous, such as from ionizing radiation. Recent studies have suggested that endogenous DNA damage from replication stress in the mother cell is a significant contributor of the proliferation-quiescence decision in the following generation7,22,31,34. In the cells that suffer from more severe replication stress, the DDR downstream effector p21, a potent CDK inhibitor, is activated mediates the quiescence in the daughter cells’ G1 phase. Furthermore, evidence suggests that the endogenous DNA damage resulted from active replication can itself slowdown
replication through the DDR35. While many studies focus on the effects of endogenous replication stress, little is known about how exogenous DNA damage occurred during replication affect the cell fate decision. Understanding how exogenous DNA damage affects cell fate is crucial, as many chemotherapeutics and radiotherapy rely on inducing DNA damage in actively-dividing cancer cells.
rendering replication unstoppable by DSB38,39. However, once the damaged cell finishes replication, the cell need to face the consequence of replicating through heavily
damaged chromosomes by deciding whether to permanently arresting in the subsequent G2 phase or to repair the damage and enter mitosis8. A systems-level understanding of the cell fate decision upon DNA damage in S phase is lacking and urgently needed for designing effective therapeutic strategies against cancer by pushing the cancer cells into more vulnerable states.
1.4 Working Hypothesis for My Dissertation
REFERENCES
1. Howard, A. & Pelc, S. R. Nuclear incorporation of P32 as demonstrated by autoradiographs. Exp Cell Res2, 178–187 (1951).
2. DAWSON, K. B., MADOC-JONES, H. & FIELD, E. O. VARIATIONS IN THE GENERATION TIMES OF A STRAIN OF RAT SARCOMA CELLS IN CULTURE.
Exp Cell Res38, 75–84 (1965).
3. Becker, K. A. et al. Self-renewal of human embryonic stem cells is supported by a shortened G1 cell cycle phase. J Cell Physiol209, 883–893 (2006).
4. Kareta, M. S., Sage, J. & Wernig, M. Crosstalk between stem cell and cell cycle machineries. Curr Opin Cell Biol37, 68–74 (2015).
5. Kinjyo, I. et al. Real-time tracking of cell cycle progression during CD8+ effector and memory T-cell differentiation. Nat Commun6, 6301 (2015).
6. COOPER, S. Reappraisal of serum starvation, the restriction point, G0, and G1 phase arrest points. FASEB J17, 333–340 (2003).
7. Arora, M., Moser, J., Phadke, H., Basha, A. A. & Spencer, S. L. Endogenous Replication Stress in Mother Cells Leads to Quiescence of Daughter Cells. Cell Rep19, 1351–1364 (2017).
8. Chao, H. X. et al. Orchestration of DNA Damage Checkpoint Dynamics across the Human Cell Cycle. Cell Syst5, 445–459.e5 (2017).
9. Zetterberg, A. & Larsson, O. Kinetic analysis of regulatory events in G1 leading to proliferation or quiescence of Swiss 3T3 cells. Proc Natl Acad Sci U S A 82, 5365–9 (1985).
10. Dowling, M. R. et al. Stretched cell cycle model for proliferating lymphocytes. Proc Natl Acad Sci U S A111, 6377–82 (2014).
11. Weber, T. S. et al. Quantifying the Length and Variance of the Eukaryotic Cell Cycle Phases by a Stochastic Model and Dual Nucleoside Pulse Labelling. PLoS Comput Biol10, e1003616 (2014).
12. Zhang, Q., Bassetti, F., Gherardi, M. & Lagomarsino, M. C. Cell-to-cell variability and robustness in S-phase duration from genome replication kinetics. Nucleic Acids Res45, 8190–8198 (2017).
13. Smith, J. A. & Martin, L. Do cells cycle? Proc Natl Acad Sci U S A 70, 1263–7 (1973).
15. Sandler, O. et al. Lineage correlations of single cell division time as a probe of cell-cycle dynamics. Nature519, 468–471 (2015).
16. Araujo, A. R., Gelens, L., Sheriff, R. S. M. & Santos, S. D. M. Positive Feedback Keeps Duration of Mitosis Temporally Insulated from Upstream Cell-Cycle Events.
Mol Cell64, 362–375 (2016).
17. Helin, K. Regulation of cell proliferation by the E2F transcription factors. Curr Opin Genet Dev8, 28–35 (1998).
18. Dong, P. et al. Division of labour between Myc and G1 cyclins in cell cycle commitment and pace control. Nat Commun5, 4750 (2014).
19. Dong, P., Zhang, C., Parker, B.-T., You, L. & Mathey-Prevot, B. Cyclin D/CDK4/6 activity controls G1 length in mammalian cells. PLoS One13, e0185637 (2018). 20. Ishida, S. et al. Role for E2F in Control of Both DNA Replication and Mitotic
Functions as Revealed from DNA Microarray Analysis. Mol Cell Biol 21, 4684– 4699 (2001).
21. Reis, T. & Edgar, B. A. Negative regulation of dE2F1 by cyclin-dependent kinases controls cell cycle timing. Cell117, 253–64 (2004).
22. Yang, H. W., Chung, M., Kudo, T. & Meyer, T. Competing memories of mitogen and p53 signalling control cell-cycle entry. Nature549, 404–408 (2017).
23. Froese, G. The distribution and interdependence of generation times of HeLa cells. Exp Cell Res35, 415–419 (1964).
24. Nyberg, K. A., Michelson, R. J., Putnam, C. W. & Weinert, T. A. Toward
Maintaining the Genome: DNA Damage and Replication Checkpoints. Annu Rev Genet36, 617–656 (2002).
25. Sogo, J. M., Lopes, M. & Foiani, M. Fork Reversal and ssDNA Accumulation at Stalled Replication Forks Owing to Checkpoint Defects. Science (80- )297, (2002).
26. Vilenchik, M. M. & Knudson, A. G. Endogenous DNA double-strand breaks: production, fidelity of repair, and induction of cancer. Proc Natl Acad Sci U S A
100, 12871–6 (2003).
27. Bartek, J. & Lukas, J. DNA damage checkpoints: from initiation to recovery or adaptation. Curr Opin Cell Biol19, 238–245 (2007).
29. Paulovich, A. G., Toczyski, D. P. & Hartwell, L. H. When checkpoints fail. Cell88, 315–21 (1997).
30. Shaltiel, I. A., Krenning, L., Bruinsma, W. & Medema, R. H. The same, only
different - DNA damage checkpoints and their reversal throughout the cell cycle. J Cell Sci128, 607–20 (2015).
31. Barr, A. R. et al. DNA damage during S-phase mediates the proliferation-quiescence decision in the subsequent G1 via p21 expression. Nat Commun8, 14728 (2017).
32. van Gent, D. C., Hoeijmakers, J. H. & Kanaar, R. Chromosomal stability and the DNA double-stranded break connection. Nat Rev Genet2, 196–206 (2001). 33. Pawlik, T. M. & Keyomarsi, K. Role of cell cycle in mediating sensitivity to
radiotherapy. Int J Radiat Oncol Biol Phys 59, 928–42 (2004).
34. Spencer, S. L. et al. The Proliferation-Quiescence Decision Is Controlled by a Bifurcation in CDK2 Activity at Mitotic Exit. Cell155, 369–383 (2013).
35. Daigh, L. H., Liu, C., Chung, M., Cimprich, K. A. & Meyer, T. Stochastic Endogenous Replication Stress Causes ATR-Triggered Fluctuations in CDK2 Activity that Dynamically Adjust Global DNA Synthesis Rates. Cell Syst (2018). doi:10.1016/j.cels.2018.05.011
36. Carpenter, A. E. et al. CellProfiler: image analysis software for identifying and quantifying cell phenotypes. Genome Biol7, R100 (2006).
37. Khanna, K. K. & Jackson, S. P. DNA double-strand breaks: signaling, repair and the cancer connection. Nat Genet27, 247–54 (2001).
38. Nishitani, H. et al. CDK inhibitor p21 is degraded by a proliferating cell nuclear antigen-coupled Cul4-DDB1Cdt2 pathway during S phase and after UV
irradiation. J Biol Chem283, 29045–52 (2008).
CHAPTER 2: EVIDENCE THAT THE HUMAN CELL CYCLE IS A SERIES OF UNCOUPLED, MEMORYLESS PHASES1
2.1 Overview
The cell cycle is canonically described as a series of four phases: G1 (gap phase 1), S (DNA synthesis), G2 (gap phase 2), and M (mitosis). Various models have been proposed to describe the durations of each phase, including a two-state model with fixed S-G2-M duration and random G1 duration; a “stretched” model in which phase durations are proportional; and an inheritance model in which sister cells show
correlated phase durations. A fundamental challenge is to understand the quantitative laws that govern cell-cycle progression and to reconcile the evidence supporting these different models. Here, we used time-lapse fluorescence microscopy to quantify the durations of G1, S, G2, and M phases in single cells from three human cell lines. We found no evidence of correlation between any pair of phase durations. Instead, each phase followed an Erlang distribution with a characteristic rate and number of steps. These observations suggest that the duration of each cell cycle phase is memoryless with respect to previous phase durations. We challenged this model by perturbing the durations of specific phases through oncogene activation, inhibition of DNA synthesis,
1 This chapter has been prepared as the following manuscript and is under revision at Molecular Systems Biology: Chao HX, Fakhreddin R.I., Shimerov H.K., Kedziora K.M., Kumar R.J., Grant G.D., Cook J.G., Gupta G, and Purvis J.E. Evidence that the human cell cycle is a series of uncoupled, memoryless phases.
reduced temperature, and DNA damage. Phase durations remained uncoupled in individual cells despite large changes in durations in cell populations. To explain this behavior, we propose a mathematical model in which the independence of cell-cycle phase durations arises from a large number of molecular factors that each exerts a minor influence on the rate of cell-cycle progression. The model predicts that it is
possible to force correlations between phases by making large perturbations to a single factor that contributes to more than one phase duration, which we confirmed
experimentally by inhibiting cyclin-dependent kinase 2 (CDK2). We further observe that phases can show coupling in a transformed cell line with defective cell cycle
checkpoints. This quantitative model of cell cycle progression explains the paradoxical observation that phase durations are both inherited and independent and suggests how cell cycle progression may be altered in disease states.
2.2 Introduction
Here, we report precise measurements of G1, S, G2, and M phase durations in three human cell lines. We find that each phase operates according to a distinct
timescale and detect no evidence of phase coupling. Instead, phase progression can be accurately modeled as a sequence of memoryless steps in which the duration of each phase is independent of the previous phase duration. This lack of correlation holds even when phase durations are altered by external stresses, although under certain
description of cell-cycle progression provides a new conceptual framework for studying diseases in which cell cycle progress is dysregulated.
2.3 Results
2.3.1 Cell cycle phase durations are uncoupled under unstressed conditions
We examined cell cycle progression in three human cell lines: a non-transformed cell line (hTERT RPE-1, abbreviated RPE), a transformed osteosarcoma cell line
(U2OS), and an embryonic stem cell line (H9). RPE cells are non-transformed human epithelial cells immortalized with telomerase reverse transcriptase with intact cell cycle regulators40; U2OS cells are transformed cancer cell line with near triploidy and an unstable G1 checkpoint41–43. H9 cells are derived from human blastocysts44 and exhibit rapid proliferation characterized by a shortened G1 duration3. We used the proliferating cell nuclear antigen (PCNA)-mCherry fluorescent reporter to quantify, for each cell, the duration of G1, S, G2, and M, and, implicitly, the entire cell cycle duration8 (Figure 2.1a, Figure S2.1). It has been firmly established in previous studies that, during S phase, PCNA is loaded at DNA replication forks and forms foci in well-described punctate patterns8,45–48. PCNA localization is precisely correlated with DNA replication and thus is a bona fide marker of S phase8,45,46,48–50. The transition from diffuse to punctate (G1/S) and from punctate back to diffuse (S/G2) was readily detectable between consecutive frames of time-lapse imaging by both manual and automated procedures31 (Figure S2.2a). The G2/M transition was easily identified by nuclear envelope breakdown16,47, and the M/G1 transition was recorded as the first frame after telophase8,34.
consistent across the three cell lines (Figure 2.1b). We did not observe a significant portion of p27-positive cells in RPE and U2OS nor p21-positive cells in RPE (Figure S2.3), suggesting that quiescence from contact inhibition, serum starvation, or endogenous DNA damage does not significantly contribute to the G1 duration measured in our experimental condition31,51. When looking among individual cells, however, both G1 and G2 showed substantial variability within each cell type (Figure 2.1c-d). S phase duration was the most tightly distributed phase52 with consistent coefficient of variance across different cell lines, even in the near-triploid U2OS. Thus, G1 is the most variable across different cell lines, but G1 and G2 are both highly variablewithin each cell line.
sampling frequency in the range that was used (Figure S2.6). To confirm these results, we validated the lack of correlation among cell cycle phases in an independent
fluorescent reporter system (Figure S2.2b-c, Table S2.1). A statistical power analysis revealed that our sample size would be adequate to detect significant correlations, if present (Materials and Methods). Finally, we note that many phases showed pronounced variability, indicating that the lack of correlation was not due to a lack of variability under basal conditions. Thus, contrary to previous claims that cell cycle phases are correlated, we find no evidence for phase coupling within a cell cycle for three distinct human cell lines.
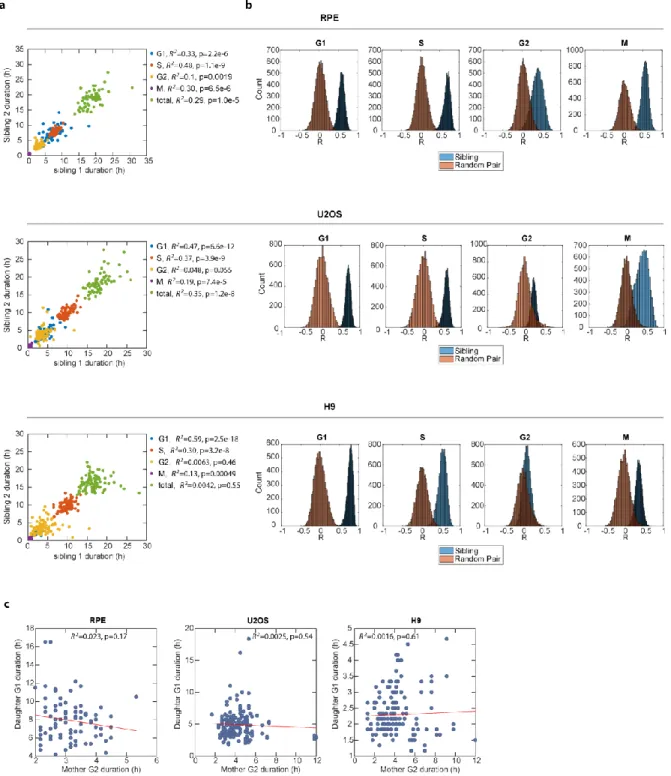
Recent single-cell studies have provided strong evidence that cellular memories of growth and stress signals can be passed on from mother to daughter cells and alter the daughter’s cell cycle progress7,22,31. To examine whether these memories can, in addition, lead to inter-generational coupling of phase durations, we examined the correlation between the mother cells’ G2 and their daughter cells’ G1. We did not
observe coupling between mother G2 and daughter G1 durations (Figure S2.5c). Thus, while memory of stress can prolong a daughter cell’s G1 phase, these molecular factors appear to be G1-specific and do not affect the duration of the mother cell’s G2 in a correlated manner. Taken together, these results suggest that factors determining the duration of a given cell cycle phase do not significantly affect the duration of the previous, or next, cell cycle phase.
2.3.2 Each cell cycle phase follows an Erlang distribution with a characteristic timescale and rate
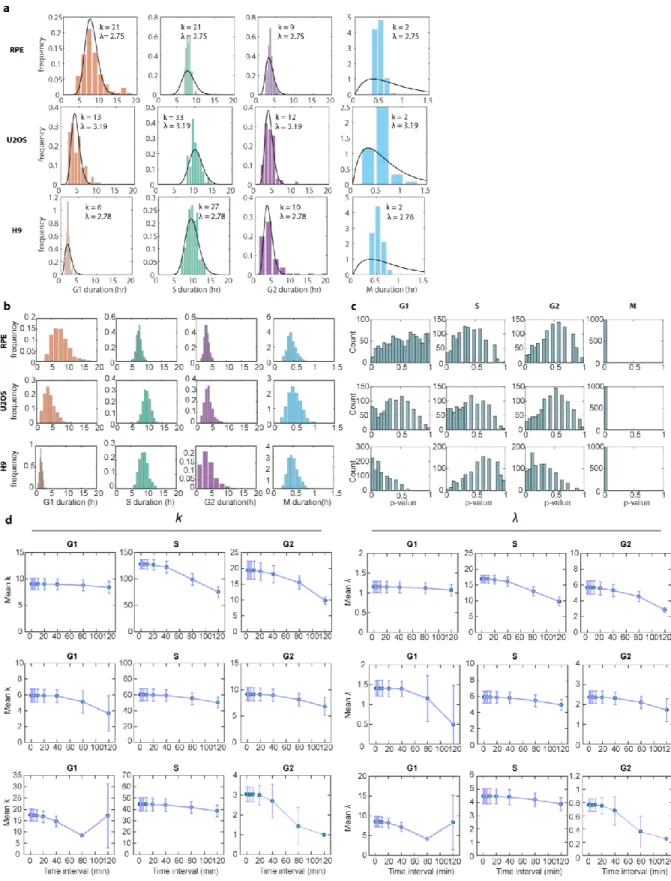
distributions of the phase durations in order to define the underlying stochastic processes driving them. All phases followed a similarly-shaped distribution
characterized by a minimum duration time and skewed right tail (Figure 2.2a). This distribution immediately ruled out a one-step stochastic process, which would be expected to produce an exponential distribution of phase durations13. Instead, each distribution of phase durations resembled an Erlang distribution, which represents the sum of k Poisson processes with rate λ (Figure 2.2b). The Erlang distribution was originally developed to describe the waiting time before a series of telephone calls is handled by an operator54. In its application to the cell cycle, each phase can be thought of as a series of steps that proceeds at some fundamental rate8,55. The total amount of time needed to complete all steps in the phase has an Erlang distribution56. This model does not claim that each cell cycle phase is, in actuality, merely a series of precisely k
steps. However, the Erlang model does provide a concise phenomenological description of cell cycle progression that has a simple and relevant biological
interpretation: each cell cycle phase can be viewed as a multistep biochemical process that needs to be completed in order to advance to the next cell cycle phase57. Similar models have been proposed to describe the “microstates” of stem-cell differentiation, a sequential biological process that undergoes similar discrete, observable state
transitions at the same rate throughout the differentiation process58. In contrast to the differentiation process, however, our model fitting suggested that a single rate
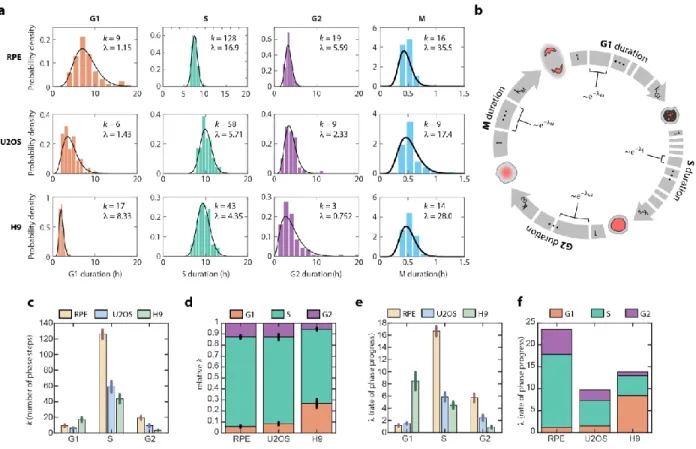
By fitting the experimentally measured distributions of phase durations for each cell line, we obtained two parameters for each phase: a shape parameter, k, which represents the number of steps within a phase; and a rate, λ, which represents how quickly on average the step is completed (Figure 2.2a, black curves). Using the estimated parameters, we were able to accurately simulate the cell cycle phase durations under basal conditions for all phases except for M phase, for which the time resolution of measurement was low (10 mins) compared to the average duration (~30 mins) (Figure S2.7b-c). The fitted parameters were robust to the sampling frequency used in our experiment (Figure S2.7d). When we compared the shapes and rates across cell lines, several interesting observations emerged. First, the number of steps was high (k = 43-128) for S phase but low for both G1 and G2 (k < 20) (Figure 2.2c). In addition, although the absolute number of steps differed across cell types, the
proportions of steps for each phase were highly conserved, especially for RPE and U2OS (Figure 2.2d). This conserved proportionality suggests that, across different cell types, a similar number of rate processes are necessary to complete each phase. In addition, the rate parameters generally followed the trends of the step parameters across cell lines, with high λ corresponding to high k (Figure 2.2c, 2.2e). This trend suggests that, regardless of the cell cycle phase, each cell line had a different set of kinetic parameters for cell cycle progression—RPE’s cell cycle kinetics were better fitted with higher rates through more numerous steps, followed by U2OS, then by H9 with slower rate and fewer step numbers. The one exception to this pattern was G1 in H9 (Figure 2.2d, 2.2f), which is consistent with the unusually short G1 duration in
molecular mechanisms that control each phase durations, it further supports the hypothesis that each cell cycle phase obeys a unique rate-governing process and is therefore consistent with the observation that phase durations are uncorrelated.
2.3.3 Cell cycle phase durations remain uncoupled when phase durations are altered.
To further test whether phase durations are independently controlled, we introduced a series of perturbations aimed at altering the durations of specific phases and asked whether subsequent phases remained uncoupled. We introduced
perturbations in the non-transformed RPE cell line, whose cell cycle regulation was unperturbed and was sufficiently resistant to perturbations61. We first specifically
proportionally in response to lower temperature, the phase durations remained
uncoupled at the single-cell level (Figure 2.3i, Figure S2.8h). Shortening all phases by incubating cells at 40°C produced similar effect on coupling (Figure S2.8i-k), although G1 and G2 showed a weakly significant correlation (R2 = 0.078, p = 0.002). This weak coupling may be explained by complication with high temperature that had a detrimental effect (eg. protein denature) on the cells.
properties, for example checkpoint efficiency. Therefore, whichever factors determined G2 duration did not necessarily determine G1 duration. Thus, although increasing levels of DNA damage increased both G2 and the subsequent G1, a mother with a prolonged G2 did not necessarily have daughters with long G1 durations, indicating that there was no phase coupling between G2 and the subsequent G1 on a single-cell level. We observed no effect of NCS treatment in the mother cells on the S and G2 phases in the daughter cells (Figure S2.9b). In addition, there was no coupling between S and G2 durations in cells damaged during S phase (Figure S2.9e-f). In summary, DNA damage incurred in mother cells lengthened phase durations in the daughter cells but did not couple the durations of cell cycle phases either within or across cell cycle generations.
of total variability in H9 (Figure S2.10d). Thus, the RPE cell line is more consistent with the Smith-Martin model in which G1 accounts for most of the variability in cell cycle length13. In contrast, rapidly proliferating H9 cells are most similar to the lymphocytes that form the basis for the stretched model10, in which variability in cell cycle duration stemmed primarily from S and G2 due to the relatively short duration of G1.
2.3.4 A model for heritable factors governing independence of phase duration
We next sought to reconcile our model with previous observations concerning the heritability of cell cycle phase durations. It has long been known that sibling cells are highly correlated in their total cell cycle durations as well as in the durations of individual phases5,10,15,53. These observations strongly suggest that there are heritable molecular factors that influence the rate of cell cycle progression. But this observation raises an obvious paradox: if cells retain factors that control the durations of cell cycle phases, how can consecutive phases be uncoupled and memoryless? To reconcile these two observations, we considered three models in which heritable factors influence the phase progression rates, and implicitly the phase durations. In the first model, which we refer to as the “one-for-all” model, one heritable factor influences the duration of all phases (Figure 2.4a). Under this model, all phases should be strongly correlated because each phase is under a common control. However, the uncoupling between phases we
observed (Figure 2.1e, Figure 2.3) is inconsistent with this model.
about several molecular factors that share control over multiple phase durations. For example, cells that have high E2F activity, which controls both the entry into S phase as well as DNA replication, are expected to progress through both G1 and S faster18,19. In contrast, cells with high Cdt1 expression, which functions to license origins for
replication, finish G1 early but have a prolonged S phase63,64. As a third possibility, therefore, we considered a model containing numerous types of heritable factors, each of which affects multiple phase durations in potentially different directions. We called this the “many-for-all” model (Figure 2.4a). Under this model, each phase is under shared control by multiple types of factors. Because each factor individually has a coupling effect, the net effect of a group of such factors could potentially lead to coupling of cell cycle phase durations.
To explore under what conditions such heritable factors would lead to phase coupling under the many-for-all model, we computationally modeled the coupling between two phases under shared control as a function of numbers of unique factor types. Simulation results revealed that the coupling between phases weakened as the number of unique coupling factor types increased (Figure 2.4b). Intuitively, this
consistent with the regime of numerous factor types under many-for-all model of cell cycle phase progression.
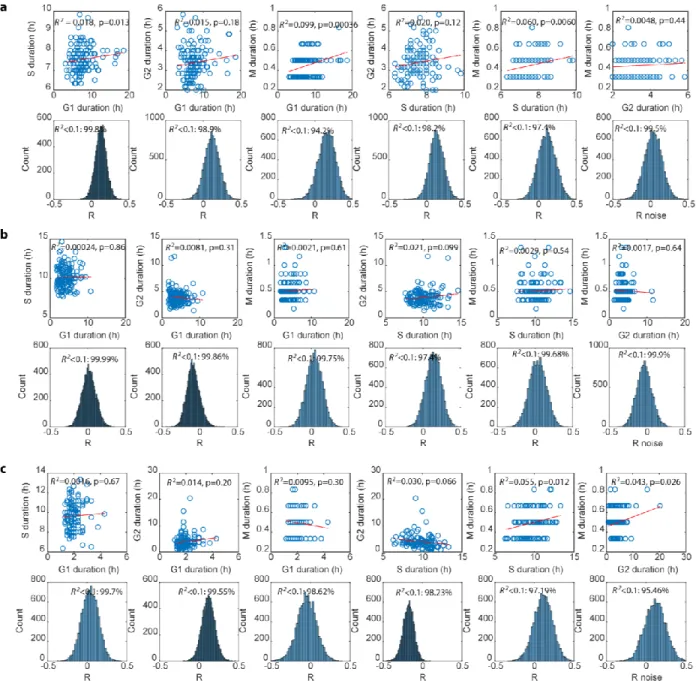
We gained further insight into the inheritance of phase-coupling factors by analyzing sister cell pairs. Because sister cells share similar amounts of heritable factors due to shared cytoplasmic and genetic content65,66, all of the models above would be expected to produce correlations between sister cells’ phase durations. However, in order to achieve the observed phase uncoupling in individual cells, the distribution of each type of heritable factor to daughter cells must be independent of the others. If factors segregate independently, then even in sister cells—for which phase durations are highly correlated—the noise for each cell cycle phase length is expected to be uncoupled between sisters. For example, the differences between G1 durations in sisters would not be expected to correlate with differences between S durations. To support this hypothesis, we show that even though cell cycle phase durations are highly correlated between sisters (Figure S2.5a-b), we found no correlation between the differences in sibling cells’ phase durations for any pair of phases (Figure S2.11a). Thus, phase durations appear to be controlled by a large number of heritable factors that segregate independently during cell division.
2.3.5 Perturbation of a single factor leads to coupling between cell cycle phase durations
According to the many-for-all model of heritable factors, no single factor
factor by significantly increasing its abundance. Consistent with our hypothesis,
increasing one factor’s net effect introduced coupling between phase durations (Figure 2.4d-e). To experimentally test this prediction, we introduced a negative cell cycle
regulation, the cyclin-dependent kinase 2 (CDK2) inhibitor CVT-31367 and measured the resulting phase durations (Figure 2.4f). Adding the CDK2 inhibitor is analogous to adding p21 molecules, a potent CDK2 inhibitor and a key negative cell cycle regulator, into the system, resulting in a slowdown in G1/S transition, S phase progression, and G2/M transition68–71. As expected, CDK2 inhibitor treatment prolonged all cell cycle phases, having the strongest effect on G1 (Figure 2.4g, Figure S2.11b-c). Moreover, consistent with the model’s prediction, introducing high level of CDK2 inhibitor also introduced a strong correlation between each pair of phase durations (Figure 2.4h, Figure S2.11d). It is notable that we were able to force correlations by adding CDK2 inhibitor, a single molecular factor that affects multiple phases, but not by decreasing temperature, which—although also influencing all phases—perturbed a large number of molecular factors’ activities. To test the model with a positive cell cycle regulator, we have overexpress cyclin D, which is important in G1/S transition and G2 progression (Figure S2.11e)72–74. Under cyclin D overexpression, we observed strong and
significant shortening of both G1 and G2, as well as coupling between G1 and G2 durations (Figure S2.11e-i).
2.3.6 Uncoupling between cell cycle phases is disrupted in a cancer cell line
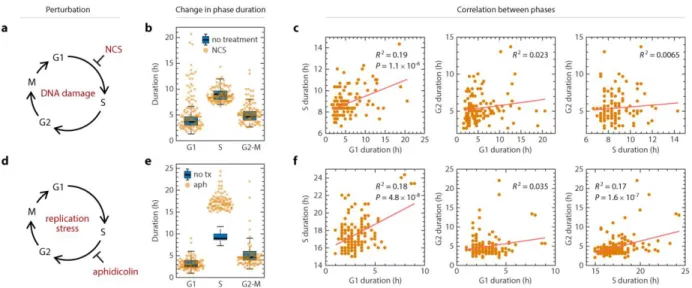
depleted abundance of cell cycle control factors. To examine phase coupling in cells with dysregulated cell cycle control, we measured whether coupling occurred after perturbing specific phases in U2OS cells, which are known to have a compromised G1 checkpoint41,42. We used NCS to induce DNA damage in mother cells and quantified the daughter cells’ phase durations (Figure 2.5a). As in RPE cells, only G1 was significantly prolonged by the DNA damage induced in the mother cells (Figure 2.5b, Figure
S2.12a). However, unlike in RPE cells, DNA damage induced in U2OS mother cells introduced coupling between daughters’ G1 and S durations and resulted in a positive correlation (Figure 2.5c, Figure S2.12b), even in the absence of an increase in S phase duration at the population level. S and G2-M durations remained uncoupled in cells damaged during S phase (Figure S2.12c-e). We next perturbed S phase with aphidicolin to induce replication stress in U2OS cells (Figure 2.5d). As in RPE cells, we observed significant prolongation of S phase duration only (Figure 2.5e, Figure
phase durations of mother cells (Figure S2.12h). Another prediction of the many-for-all model is that, a perturbation promiscuously affecting many factors would not introduce coupling despite a dysregulated cell cycle. Consistent with this prediction, low
Figure 2.1. Variation and lack of correlation among cell cycle phase durations in single human cells. a, Diagram of the cell cycle composed of G1, S, G2, and M phases (not to scale). Phase durations were quantified by time-lapse fluorescence microscopy using a PCNA-mCherry reporter to identify four discrete events during the lifetime of an individual cell (see main text and medures). Images were acquired every 10 min. b, Mean phase durations in RPE, U2OS, and H9 cell lines. Error bars represent standard deviations. c, Coefficient of variation (CV) of phase durations. d, Percentage of the total variation in cell cycle duration contributed by individual phases. e, Correlations between individual cell cycle phase durations. Sample sizes were adequate to detect correlations (see Materials and Methods). n = 125 (RPE), 130 (U2OS), 113 (H9). R2, square of Pearson correlation
Figure 2.2. Erlang model of cell cycle progression. a, Distributions of cell cycle phase durations for RPE, U2OS, and H9 cells using single-cell measurements of phase duration reported in Figure 2.1. Black curves represent fits to Erlang distribution. b, Erlang model of cell cycle progression. Each phase consists of a distinct number of steps, k. Each step is a Poisson process with rate parameter, λ. After fitting each phase to the Erlang distribution, we were able to accurately simulate all phase
durations except for M phase (2-sided Kilmogorov-Smirnov test for difference between measured and simulated distributions, Figure S2.2.3b-c). c, Fitted shape parameter, k, representing the number of steps for each phase. Error bars represent std from 1000 bootstraps. d, Normalized shape parameter, k, for G1, S, and G2 phases in RPE, U2OS, and H9 cells. Bar height represents the fraction of total cell cycle steps spent in each phase. Error bars represent std from 1000 bootstraps. e, Fitted rate parameter, λ,
Figure 2.3. Lack of coupling among cell cycle phases under perturbation. a, Schematic of shortening G1 by Myc overexpression. RPE cells infected with retrovius harboring a taxmoifen-inducible Myc-overexpression construct. b, Shift in phase durations of RPE cells overexpressing Myc. c, Pairwise correlation between cell cycle phase durations of RPE cells overexpressing Myc. d, Schematic of prolonging S phase by replication stress using aphidicolin.
Figure 2.4. A model for heritable factors governing the rate of cell cycle phase progression.a, Alternative models for inheritance of molecular factors governing the durations of cell cycle phases. b, Simulation of the “strength of coupling” as a function of the number of unique phase-coupling molecule types under the many-for-all model. Each simulation generated 200 cells for which an R2 value was calculated. R2 values were averaged across 200 simulations. The shaded area represents
the standard deviation of R2 across the simulations. c, Simulation of coupling strength as a function of the
number of unique phase-coupling and phase-specific factors. Phase-coupling factors have shared control over a pair of cell cycle phases, whereas phase-specific factors affect only one cell cycle phase. Strength of coupling is represented by mean R2 value as in panel b. d, same as in b, but simulating the effect of
Figure S2.1 The PCNA-mCherry reporter and imaging condition do not alter the cell cycle dynamics. a, RPE, U2OS, and H9 cell lines with and without the PCNA-mCherry reporter were pulse with 30mins EdU and quantified for cell cycle phase distributions. n>3000 for each condition. b, RPE, U2OS, and H9 cell lines were imaged every 10 mins with the same imaging settings for acquiring phase duration data for 72 hours before 30min EdU pulse and quantification of cell cycle phase
Figure S2.3. The quiescent (G0) population under proliferating conditions is low compared to other phases. a, Scatter plots of RPE cells with DAPI, EdU, and p27 quantification. For control, cells were seeded at 5% initial density and grown for 72 h before 30 mins of EdU pulse. For the confluence condition, cells were seeded at 80% initial density and grown for 72 h before 30 mins of EdU pulse. n = 4264 (control); n = 13580 (confluence). b, Scatter plot of p27 level in the confluence growing condition as a function of EdU incorporation level. c, Histograms of p27 expression levels. For the control population, cells were categorized into S phase and non-S phase based on the EdU level in panel a. A p27 threshold was calculated so that 1% of the S phase cells, which were presumably non-G0, were above the threshold. This same threshold value was then used to calculate the percentage of non-S phase control cells above this threshold, in both the control and the confluence conditions. A percentage for S phase cells in the confluence condition was not quantified because only a small portion of cells (<0.5%) were EdU positive. d, Same as panel a, but for U2OS. n = 1459 (control); n = 14467
Figure S2.8. Perturbing cell cycle phase durations and phase coupling in RPE cells. a, Ratio of RPE’s cell cycle phase duration increase with myc overexpression relative to control. b, Non-parametric bootstrap of the distribution of correlation coefficient (R) for RPE under myc
overexpression. n=10,000. c, Ratio of RPE’s cell cycle phase duration increase under 50 ng/mL APH treatment relative to control. d, Non-parametric bootstrap of the distribution of correlation coefficient (R) for RPE under 50 ng/mL APH. n=10,000. e, G1 durations in the mother cells (treated during S phase) and in the daughter cells whose mothers were treated. p-value=0.0017 based on 2-sided Kolmogorov–
Figure S2.10. Correlation in cell cycle phase durations and its origin. a, Simulation of pairwise correlation between cell cycle phase durations under the Erlang model. The parameters were from the fitted RPE cell data in Figure 2.2a. b, Simulation of correlation between each cell cycle phase and the total cell cycle durations under the Erlang model, as in Figure S2.9a. c, Simulation of correlation coefficients as a function of the variance in total cell cycle duration contributed by G1. Data were
between S and G2-M durations in RPE cells damaged during their S phase with different NCS
Table S2.1. Correlation coefficient and significance with different linear regression methods.
For the winsorization, the threshold for replacing extreme values was set to be 90% percentile.
G1-S G1-G2 S-G2
R2 p-value R2 p-value R2 p-value
RPE
Pearson 0.018396388 0.131511 0.014593 0.179606 0.019715 0.118329 Spearman 0.026126627 0.071724 0.015156 0.17138 0.028598 0.059386 Kendall 0.0122576 0.080145 0.009354 0.124062 0.015667 0.051784 Winsorize 0.019076453 0.124524 0.018392 0.131561 0.029769 0.054341 U2OS
Pearson 0.000235173 0.862517 0.008148 0.307098 0.021102 0.099137 Spearman 0.003063314 0.531682 0.004096 0.469425 0.001626 0.648707 Kendall 0.001401575 0.542256 0.00213 0.452869 0.000493 0.719344 Winsorize 0.001883244 0.623959 0.003629 0.495962 0.006931 0.346361 H9
Pearson 0.001664173 0.667919 0.014255 0.207822 0.029764 0.067659 Spearman 0.003949215 0.508449 0.029494 0.068937 0.060204 0.008808 Kendall 0.002123751 0.498697 0.014624 0.074802 0.027 0.012255 Winsorize 0.004073638 0.501831 0.02737 0.079915 0.059337 0.009324 RPE myc
Pearson 0.045586408 0.021376 6.22E-05 0.933023 0.047445 0.018832 Spearman 0.01522929 0.186905 0.005023 0.449647 0.006258 0.398599 Kendall 0.009054649 0.155221 0.003292 0.400271 0.004017 0.355278 Winsorize 0.040899672 0.029472 0.003386 0.534937 0.001066 0.727937 RPE APH
Pearson 8.98E-05 0.921388 0.023516 0.108083 0.004618 0.478536 Spearman 0.000285445 0.860295 0.025254 0.09573 0.000114 0.911623 Kendall 4.55E-07 0.993887 0.012215 0.099755 0.000129 0.867825 Winsorize 3.14E-06 0.985271 0.029235 0.072773 0.003718 0.524925 RPE NCS
Pearson 0.044460945 0.021344 0.0625 0.006105 0.05012 0.014383 Spearman 0.078839803 0.001981 0.069637 0.003733 0.072882 0.002985 Kendall 0.039573666 0.002327 0.029899 0.006998 0.038655 0.003276 Winsorize 0.052398266 0.012278 0.058168 0.008234 0.07124 0.003343 RPE 34C
Pearson 0.0292764 0.059516 0.007609 0.339372 0.001378 0.68484 Spearman 0.08950409 0.000816 0.015003 0.178935 0.044476 0.019716 Kendall 0.042292811 0.001176 0.007078 0.183117 0.022788 0.018586 Winsorize 0.065214203 0.004528 0.016169 0.162801 0.024572 0.084658 RPE 40C
Pearson 0.00079779 0.765465 0.0797 0.002346 1.486e-06 0.98973 Spearman 0.025933 0.08696 0.134 6.05E-05 0.00263 0.587579 Kendall 0.01101 0.115943 0.0747 4.14E-05 0.00127 0.603349 Winsorize 0.000697 0.780356 0.141 3.97E-05 0.000186 0.885521 RPE
CDK2i
Pearson 0.50383879 4.66E-19 0.260429 4.86E-09 0.159107 9.20E-06 Spearman 0.548928669 1.96E-21 0.308216 9.96E-11 0.254287 7.87E-09 Kendall 0.304128537 1.51E-17 0.160858 5.32E-10 0.137864 1.75E-08 Winsorize 0.5265358 3.16E-20 0.28022 1.00E-09 0.223207 8.58E-08 RPE
cyclin D
Pearson 0.0182 0.154363 0.2136 2.55E-07 8.69e-06 0.975278 Spearman 0.0306 0.063683 0.2199 1.62E-07 0.00361 0.527257 Kendall 0.0140 0.072354 0.1119 3.59E-07 0.00194 0.509096 Winsorize 0.0245 0.097648 0.2309 7.21E-08 0.000979 0.742135 U2OS
APH
G1-S G1-G2 S-G2
R2 p-value R2 p-value R2 p-value
U2OS NCS
Spearman 0.150788094 1.96E-05 0.031018 0.060878 0.011085 0.264922 Kendall 0.080804958 2.47E-05 0.016523 0.052833 0.004923 0.302318 Winsorize 0.176115054 3.35E-06 0.022542 0.110834 0.009307 0.307219 U2OS 34C
Pearson 0.014155232 0.211505 0.004527 0.480911 0.032024 0.059041 Spearman 0.002642636 0.590378 0.006642 0.392963 0.030639 0.064901 Kendall 0.001375721 0.591809 0.003799 0.362389 0.016907 0.056233 Winsorize 0.007528012 0.363012 0.005084 0.455009 0.035819 0.045654
2.4 Materials and Methods
2.4.1 Cell culture
hTERT retinal pigment epithelial cells (RPE) were obtained from the ATCC (ATCC® CRL-4000™) and cultured in DMEM medium supplemented with 10% fetal calf serum (FBS) and penicillin/streptomycin.U2OS cells were obtained from the laboratory of Dr. Yue Xiong and cultured in DMEM medium supplemented with 10% fetal bovine serum (FBS) and penicillin/streptomycin (Gibco).WA09 (H9) hES cell line was
purchased from WiCell (Wisconsin) and maintained in mTeSR1 (85850, StemCell Technologies) on growth factor reduced Matrigel (354230, BD). Cells were
authenticated by SRT profiling and confirmed to be free of mycoplasma. Cells were passaged using Trypsin (25300054, Gibco) for RPE and U2OS or ReLeSR™ (05872, StemCcell Technologies) for H9 as needed. When required, the medium was
supplemented with selective antibiotics (2 μg/mL puromycin for RPE and U2OS; 0.5 μg/mL puromycin for H9) (A1113803, Gibco).
2.4.2 Chemical and genetic perturbation of the cell cycle phases
1 μL polybrene. Cells were subsequently passaged post 48 hours of infection and seeded onto a glass-bottom plate for imaging. 16 hours prior to imaging, tamoxifen was added at a final concentration of 50 nM. For aphidicolin treatment, medium was
replaced with fresh medium supplemented with aphidicolin (A0781, Sigma-Aldrich) for 8 hours during experiments, washed off once with PBS, and then replenished with
imaging media described below. For CDK2 inhibition, cells were treated with 2 μM CVT-313 (221445, Santa Cruz) prior to starting the imaging.
2.4.3 Cell line construction
The construction of the pLenti-PGK-Puro-TK-NLS-mCherry-PCNA plasmid was described in our previous publication8. The plasmid was stably expressed into RPE, U2OS, and H9 cells by first transfecting the plasmid into 293T cells to generate
replication-defective viral particles using standard protocols (TR-1003 EMD Millipore), which were used to stably infect the RPE, U2OS, and H9 cell lines. The cells were maintained in selective media and hand-picked to generate a clonal population. The MSCV-Myc-ER-IRES-GFP was made by cloning the Myc-ER from pBabe-puro-Myc-Er into MSCV-IRES GFP. pBabe-puro-myc-ER was a gift from Wafik El-Deiry (Addgene plasmid # 19128)75. MSCV-IRES-GFP was a gift from Tannishtha Reya (Addgene plasmid # 20672). The cloned plasmid was then sequenced and verified. Stable RPE and U2OS cell lines expressing PCNA-mTurq2 and PIP-FUCCI
2.4.4 Time-lapse microscopy
Prior to microscopy, RPE and U2OS cells were plated in poly-D-lysine coated glass-bottom plates (Cellvis) with FluoroBrite™ DMEM (Invitrogen) supplemented with 10% FBS, 4 mM L-glutamine, and penicillin/streptomycin. H9 cells were plated in Matrigel coated glass-bottom plates with phenol red-free DMEM/F-12 (Invitrogen) supplemented with 1x mTeSR1 supplement (85852, StemCell Technologies).
Fluorescence images were acquired using a Nikon Ti Eclipse inverted microscope with a Nikon Plan Apochromat Lambda 40X objective with a numerical aperture of 0.95 using an Andor Zyla 4.2 sCMOS detector. In addition, we employed the Nikon Perfect Focus System (PFS) in order to maintain focus of live cells throughout the entire
acquisition period. The microscope was surrounded by a custom enclosure (Okolabs) in order to maintain constant temperature (37oC) and atmosphere (5% CO2). The filter set used for mCherry was: 560/40 nm; 585 nm; 630/75 nm (excitation; beam splitter;
emission filter) (Chroma). Images were acquired every 10 minutes for RPE and H9 cells and every 10 or 20 minutes for U2OS cells in the mCherry channel. We acquired 2-by-2 stitched large image for RPE cell. NIS-Elements AR software was used for image
acquisition and analysis. 2.4.5 Image analysis
min). In addition, due to the nature of time-lapse imaging, there was an uncertainty regarding when the phase transition occurred within the 10-min time frame.
Image and data analysis was performed in Fiji77 (version 1.51n, ImageJ NIH) and MATLAB (R2017b, MathWorks). Images from time lapse experiments (16 bit) were processed with rolling ball background subtraction algorithm prior to analysis. PCNA-mTurq2 channel was selected for segmentation of nuclear regions of interest (ROIs) and tracking of individual cells by in-house developed ImageJ scripts with a user-assisted approach. Briefly, user-defined tracks were used for local automated segmentation of ROIs based on intensity thresholding followed by morphological operations to define an oval shape and a watershed algorithm to separate adjacent nuclei. Defined ROIs were used to analyze all fluorescent channels.
PCNA pattern (PCNA variance) was defined within nuclear ROIs from which nucleoli (dark regions) were eliminated using Remove Outliers algorithm (ImageJ). Images were smoothed with a Gaussian filter (sigma=1x) and then processed with a variance filter (sigma=2x) to enhance PCNA pattern. Intensity and standard deviation of variance images was measured within 70% central region of defined ROIs to avoid edge artefacts. Beginning and end of S phase was defined as a transition from low to high and high to low variance respectively and detected automatically from a one dimensional signal.
was defined as a point of 50% loss of G1 level of the sensor while beginning of G2 was defined as an increase (2% of maximum signal) over S phase level.
2.4.6 In silico mapping of cell cycle progression in individual cells
We quantified the cell cycle phase durations of our cell lines by imaging
asynchronously dividing cells. During the entire life of each individual cell, we took five time point measurements: the time of cell birth (tbirth), the onset of S phase (ts_onset), the end of S phase (ts_end), the time of nuclear envelope breakdown (NEB, tm_start), and the time of telophase (ttelophase), which were manually identified from the PCNA-mCherry reporter. These five time points allowed for quantifying the durations of four cell cycle phases: G1, S, G2, and M phases.
2.4.7 Statistical analysis and sample size
Sample size was calculated based on Type I error rate of 0.2, Type II error rate of 0.01, and R2 =0.1 to prevent false negative correlation, which resulted in 112 cells per condition78. Non-parametric bootstrap was performed with 10,000 iterations to calculate the distribution of correlation coefficients for each condition and the percentage of
iterations with no significant correlation (R2 < 0.1). 2.4.8 Immunofluorescence
Cells were fixed with 4% paraformaldehyde for 10 minutes, permeabilized with 0.5% Triton X-100 for 10 minutes, and stained overnight at 4°C with anti-p27 KIP 1 antibody [Y236] (abcam ab32034) or anti-p21 antibody (CST #2947). Primary