SOCIAL CLASS SOCIALIZATION IN WHITE, NON-HISPANIC FAMILIES: THE ROLE OF PARENTS
April Highlander
A thesis submitted to the faculty at the University of North Carolina at Chapel Hill in partial fulfillment of the requirements for the degree of Master of Arts in the Department of Psychology
and Neuroscience in the College of Arts and Sciences.
Chapel Hill 2019
Approved by:
Deborah J. Jones
Keely Muscatell
ABSTRACT
April Highlander: Social Class Socialization in White, Non-Hispanic Families: The Role of Parents
(Under the direction of Deborah J. Jones)
Subjective social class, or one’s perception of their position in socioeconomic hierarchies, is
theorized to be an identity present in children as young as twelve years old; however, little is
known about younger children’s exposure to social class messages or parents’ role in the
socialization of subjective social class during this critical developmental period.
As a formative step, this study includes the development and preliminary testing of a social
class socialization scale which was administered to White, non-Hispanic parents (N = 227) of
young (3 – 7 years old) children. Findings suggest that parents of children in this age range
convey class socialization messages, and those messages may vary based on experiences of
TABLE OF CONTENTS
LIST OF TABLES ...v
LIST OF FIGURES ... vi
LIST OF ABBREVIATIONS ... vii
Introduction ...1
Methods...5
Participants and Design...5
Measures ...6
Social Class Socialization ...6
Socioeconomic Status ...6
Experience of Class-based Discrimination ...7
Results ...8
Data Analytic Strategy ...8
Primary Analyses ...8
Additional Analyses ...10
Discussion ...11
LIST OF TABLES
Table
1. Demographic characteristics of the participating families ...38
2. Rotated Factor Pattern Matrix and Interfactor Correlations: EFA of the PRESBM....39
3. Rotated Factor Pattern Matrix and Interfactor Correlations: EFA of the PSCSM ...40
4. Correlations of latent constructs and covariates ...41
5. Summary of robust regression analyses for variables predicting
LIST OF FIGURES
Figure
1. Scree plot of eigen values from exploratory factor analysis
of the Parental Social Class Socialization Measure ...43
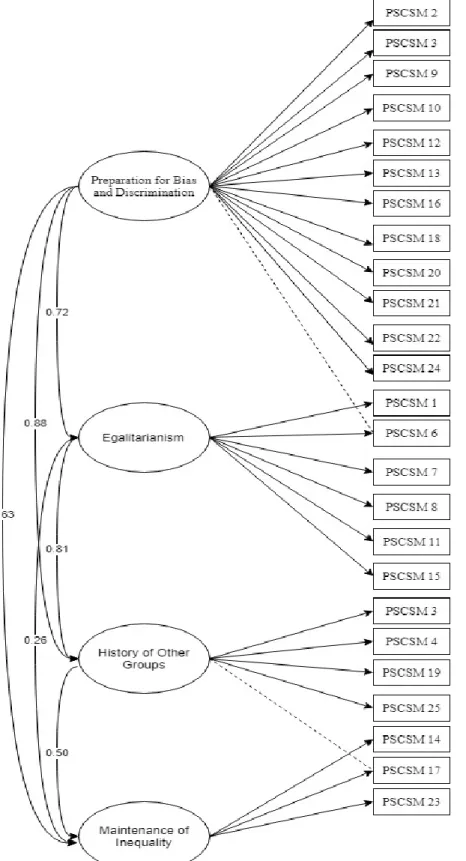
2. Figure 2 - Factor model produced by the confirmatory factor
LIST OF ABBREVIATIONS
CFA Confirmatory Factor Analysis
CFI Comparative Fit Index
EFA Exploratory Factor Analysis
MIC Microaggression Scale
ML Maximum Likelihood
MTurk Amazon Mechanical Turk
PRESBM Parental Racial-Ethnic Socialization Behaviors Measure PSCSM Parental Social Class Socialization Measure
RMSEA Root Mean Square Error of Approximation
SES Socioeconomic Status
SRMR Standardized Root Mean Square Residual
TLI Tucker-Lewis Index
Socialization of Social Class in White, Non-Hispanic Families: The Role of Parents
Social class is hypothesized to be a relational construct that involves the categorization of
individuals based on similarities in power, prestige, disposition, and practices (e.g., Bourdieu,
1987; Russell, 1996; Stephens, Markus, & Phillips, 2014). While objective measures of class
often include metrics such as income and education, as well as their combinations (i.e.,
socioeconomic status or SES), class also involves subjective perceptions regarding one’s (and
others’) place in society (Adler & Stewart, 2007; Lott, 2012). Similar to other status-based
identities such as ethnicity, gender, and race, social class is subject to social stratification and/or
marginalization in social hierarchies (García Coll et al., 1996). For example, Destin,
Rheinschmidt-Same, & Richeson (2017) proposed a model of Status-Based Identity that includes
aspects of narrative (e.g., life stories), social (e.g., social group membership), and future (e.g.,
one’s imagined future) identities that interact to create processes and outcomes that vary by SES.
Consistent with theory, experimental evidence supports social class as a highly important status
identity that contributes to both cultural practices and psychological adjustment (e.g., Destin et
al., 2017; Kraus, Piff, & Keltner, 2011; Thomas & Azmitia, 2014). One’s perception of, as well
as discrimination associated with, relative social class, has been linked to a wide range of
biopsychosocial outcomes within and between majority and minority racial and ethnic groups in
the United States throughout the lifespan, including more health problems, greater feelings of
inferiority and social anxiety, and lower academic satisfaction and grade point averages (e.g.,
Studies have highlighted children and adolescents’ experiences and perceptions of social
class and social inequality across a range of SES and racial and ethnic groups (Elenbaas, 2019;
Seider et al., 2019). Indeed, the recent special section “Children's and Adolescents'
Understanding and Experiences of Economic Inequality: Implications for Theory, Research,
Policy, and Practice” emphasizes the importance of advancing psychological theory and research
to better understand the nuances of social class and its effect on children (Ruck, Mistry, &
Flanagan, 2019). While theories exist for adolescents, surprisingly little psychological theory or
research, however, has been devoted to understanding potential mechanisms through which
perceptions of relative social class may develop in young children (see Jones, Loiselle, &
Highlander, 2018 for a review). To begin to address this gap in the psychological literature, this
preliminary study aims to advance theory, measurement, and data toward a better understanding
of the potential role of parents as vehicles of social class socialization by focusing on one
demographic in particular as a starting point for this formative work: White, Non-Hispanic
parents of young children. Given that the endorsement and impact of parental socialization
messages based on race or ethnicity are more well-established and perhaps difficult at the
formative stage to disentangle from messages of social class (e.g., Brown & Ling, 2012; Hughes
et al., 2006; Neblett, Banks, Cooper, & Smalls-Glover, 2013), a focus on White, Non-Hispanic
families affords the opportunity to at least preliminarily begin to identify patterns that may be
unique to the experiences of class in particular. Moreover, some work suggests that subjective
social class, or one’s perception of their position in socioeconomic hierarchies, may be a more
salient and, thus, robust predictor of mental (e.g., depression) and physical (e.g., cardiovascular
functioning) health and health behaviors (e.g., substance use) than objective measures (e.g.,
populations (e.g., Brown-Iannuzzi, Payne, Rini, Duhamel, & Redd, 2014; Goodman et al., 2003;
Ostrove, Adler, Kuppermann, & Washington, 2000). One hypothesis regarding the salience of
perceived social class for White, Non-Hispanic individuals relative to ethnic and racial
minorities suggests that instead of the lack of access to resources (i.e., the focus of more
traditional objective measures of social class or status) it is the relative lack of perceived gains
toward, relinquishing of, and/or the unrealized promised potential to climb the social ladder in
the U.S. that is inherent in real or perceived status threats (e.g., Bullock & Limbert, 2003;
Isenberg, 2017; Lott, 2012). In other words, because White, Non-Hispanic individuals likely
experience privilege based on their race and ethnicity, social class may be their most salient
identity that is linked to perceptions or experiences of discrimination or marginalization and,
thus, an important lens through which young, White, non-Hispanic children come to view the
world and their relative place and worth in it (Hershberg & Johnson, 2019; Payne, 2017).
Kunstman and colleagues (2016), for example, reported that White individuals who
identified strongly with their race were more likely to perceive low-SES White individuals as a
greater status threat, associating this group with more social discomfort, and, in turn, engaging in
greater social distancing with them than middle- or low-income Black individuals. Such status
threats and their impact are in fact deeply entrenched in U.S. history and can be traced back to
colonization when low resourced White individuals were recruited by the British Aristocracy to
test the feasibility of transatlantic voyages to the New World (Isenberg, 2017). This perceived
disposability of low-income White individuals is still reflected today in a range of slurs (e.g.,
“White trash”), as well as the relative lack of social mobility linked to hiring, housing, and
lending discrimination, including among those who immigrated from rural to urban areas of the
In addition to our focus on White, Non-Hispanic families, this preliminary work focused on
parent socialization of social class in particular. Consistent with the ecological systems
framework, parents, relative to peers or the broader community, are the primary influence on the
development of young children (Bronfenbrenner, 1977; Harris, 1995). Parental socialization
messages, which are generally measured via parent- and/or child-report, have been linked to
attitude development and convergence in children in a number of domains including gender and
race/ethnicity (e.g., Cunningham, 2001; Glass, Bengston, & Dunham, 1986; Pahlke, Bigler, &
Suizzo, 2012). Thus, current theory and research supports the need for initial work on
socialization of social class to start with a better understanding of the role that parents may play
in this process (Jones et al., 2018; McLoyd, 2019).
Finally, with regard to child age, prior work shows that parents effectively communicate
attitudes and messages to children as young as four years old (Hughes & Chen, 1997); thus, this
preliminary work focuses on parents of young (3 to 7 years old) children. If parents are
conveying implicit or explicit messages about social class and its meaning for value of self and
others, and if such messages can be captured and ultimately replicated in this age range, findings
have the potential to inform early intervention and prevention efforts targeting risk and resilience
factors in vulnerable youth. Informing family-based prevention and intervention opportunities,
however, depends on also knowing if and how patterns of social class socialization are linked to
other variables posited to shape the likelihood and frequency of those messages. For example,
frequency, content, and timing of socialization messages may be linked to other salient
demographic factors, including the parents’ own experiences of discrimination, attitudes, and
Methods Participants and Design
Parents and guardians of children ages 3-7 years old were recruited through Amazon
Mechanical Turk (MTurk) to complete a survey on a broad range of parenting and parent-related
constructs, including those of interest in the current study. Parent-child dyads were excluded
from the current analyses if they lived outside the United States, were not both White and
Non-Hispanic, incorrectly answered attention check questions, failed to complete the survey, or
submitted more than one survey using the same IP address, yielding 227 families for the current
study. Parents ranged from 19 to 57 years old (M = 34) and were mostly women (57%), the
biological parent (92%) of the target child (51% boys), had obtained a bachelors level degree
(45%), and were employed full-time (75%). Most families resided in suburban neighborhoods
(59%) and the mean combined family yearly income was $68,800 with a range from
$100-$380,000 (Table 1). Although the family reporting an annual income of $100 is an outlier
relative to the income for other participating families, we chose to include this family with the
hope of maximizing the range of objective markers of SES and, in turn, the opportunity to
identify patterns of variability in this preliminary work.
Participants were presented with a statement of consent upon accessing the online survey and
were able to complete the study once they agreed to the statement. No identifying information
was collected, and a random numerical code was provided to eligible participants (i.e., parent of
a child ages 3-7 years old) upon completion of the study to facilitate payment procedures for
their participation. Upon confirming eligibility criteria, respondents were asked to select one of
their children in the specified age range to be referred to as the target child throughout the
child. To ensure attention to survey responses, four attention check questions were included
throughout the survey (e.g., “For data quality purposes please select Sometimes”) and were
assessed as part of inclusion criteria.
Measures
Social Class Socialization. For the purposes of this preliminary work, we adapted, rather
than created, an existing measure of socialization: the Parental Racial-Ethnic Socialization
Behaviors Measure (PRESBM; Hughes & Chen, 1997; Hughes & Johnson, 2001; Pahlke et al.,
2012) , a 25-item-scale that measures the frequency with which parents discuss certain topics
regarding race and ethnicity with their children (1 = never to 5 = very often), yielding four
subscales (Egalitarianism; History of Other Groups; Discrimination Against Other Groups; and
Preparation for Bias). The PRESBM has been used previously with White populations making
it potentially useful for capturing broader interactional patterns of socialization related to various
identities (Hughes et al., 2006; Jones et al., 2018; Pahlke et al., 2012).In addition, utilizing the
existing measure of racial and ethnic socialization created an opportunity to compare the
PRESBM items (e.g., “American society is not always fair to all races and ethnicities”) with
those adapted for social class (e.g., “American society is not always fair to all
income/education/social classes”) to assess fit of the factor structure and in turn, serve as a
preliminary assessment of validity. Alphas for the original measure (α = .96) and adapted
Parental Social Class Socialization Measure (PSCSM; α = 0.97) indicated excellent internal
reliability in this sample.
Socioeconomic Status (SES). Parents objective and subjective SES was measured to assess
the relationship between indicators of class and socialization practices. Consistent with various
López, & Reimers, 2013; Jones et al., 2016 ), the current study defined SES as the combination
of the responding parents’ employment status (e.g., employed full-time, unemployed), education
(e.g., high school diploma, Bachelor’s degree), household yearly gross income, and number of
individuals living in the household to assess for poverty based on the federal poverty guidelines.
The MacArthur Scale of Subjective Social Status was used to assess parents’ perceptions of their
social class standing within their community and the larger American society (Adler & Stewart,
2007; Cohen et al., 2008). This measure uses a pictorial format in which two ladders (i.e., SES
ladder, community ladder) are presented where rungs on the ladder indicate social stratification
with one’s position in society in regards to education, occupation, and income increasing with
each relative increase on the rungs (Adler & Stewart, 2007). This measure has demonstrated
established psychometrics for various populations (e.g., Cundiff, Smith, Uchino, & Berg, 2013;
Giatti, Valle Camelo, Castro Rodrigues, & Barreto, 2012; Operario, Adler, & Williams, 2004)
and was reliable in this sample (α = 0.89).
Experiences of Class-based Discrimination. Class-based discrimination was measured to
assess its relationship with parental class socialization practices. The Microaggression Scale
(MIC) (Anderson et al., 2015) is a nine-item measure that assesses parents’ experiences of race
related discrimination and has demonstrated high reliability in past research. An additional two
items assess parents’ perceptions of discrimination occurring against their child in school and/or
the community. For the purpose of this study, the measure was adapted to evaluate parental
experiences of discrimination based on social class (α = 0.91 for this sample), as an exploratory
Results Data Analytic Strategy
Exploratory factor analysis (EFA) and confirmatory factor analysis (CFA) were employed to
examine the factor structure of both the PRESBM and the PSCSM in the sample. Maximum
likelihood (ML) model fitting procedure was used and model fit was evaluated using a
combination of the eigen values, scree plot, root mean square error of approximation (RMSEA),
comparative fit index (CFI), Tucker-Lewis index (TLI), chi-square: degrees of freedom ratio,
and standardized root mean square residual (SRMR; Fabrigar & Wegener, 2011;
Schermelleh-Engel, Moosbrugger, & Müller, 2003; Schreiber, Nora, Stage, Barlow, & King, 2006). Models
with eigen values greater than or close to one as indicated by the scree plot (Figure 1) were
further assessed. Values less than or equal to 0.08 for the RMSEA, greater than or equal to 0.95
for the CFI and TLI, less than three for the χ²/df ratio, and less than or equal to 0.80 for the
SRMR indicated good fit. Values less than 0.90 for weighted root mean residual (WRMR) in
addition to aforementioned indices indicated good fit of the CFA models. Correlational and
robust multiple linear regression analyses were conducted to assess relationships between
parental characteristics and their socialization practices.
Primary Analyses
Using the MPlus 6.12 statistical software package, the PSCSM was assessed using EFA and
the ML model fitting procedure (Fabrigar & Wegener, 2011). Of the nine factors tested, eigen
values and the slope of the curve of the scree plot (Figure 1) estimated an acceptable fit of a
four-factor model. Fit indices indicated an adequate fit for the four-four-factor model in this sample
RMSEA = 0.08, 90% CI [.07, .09]). Results of the EFA for the PRESBM yielded similar fit
indices with the four factor model producing the best fitted results, χ² (206) = 419.70, p < .01,
(CFI = 0.96; TLI = 0.93; SRMR = 0.03; RMSEA = 0.07, 90% CI [.06, .08]). Results of the
PRESBM are not the focus of the current study however, results of oblique rotations of the factor
loading matrix (Table 2) were compared to those of the PSCSM (Table 3) for item level
analyses.
Initial fit indices of the CFA model for the PRESBM suggested a poor model fit, χ² (269) =
1080.04, p < .01, (CFI= 0.95; TLI = 0.94; WRMR = 1.43; RMSEA = 0.11, 90% CI [.10 - .12]).
Modification indices indicated that items 14 and 23 on the PRESBM cross loaded between two
factors and items 5 and 14 contained high residual correlations. Allowing these items to cross
load and correlate resulted in a similar fit for the four-factor model, χ² (266) = 834.58, p < .01,
(CFI= 0.96; TLI = 0.96; WRMR = 1.25; RMSEA = 0.10, 90% CI [.09 - .11]. Similarly, fit
indices of the CFA model for the PSCSM demonstrated poor model fit, χ² (269) = 966.09, p <
.01, (CFI= 0.97; TLI = 0.97, WRMR = 1.49; RMSEA = 0.12, 90% CI [.11, .12]) for the
four-factor model. Modification indices indicated that items 17 and 6 on the PSCSM cross loaded
between two factors and items 16 and 12 contained high residual correlations. Allowing these
items to cross load and correlate resulted in an acceptable fit for the four-factor model, χ² (266) =
654.74, p < .01, (CFI= 0.99; TLI = 0.98; WRMR = 0.94 ; RMSEA = 0.08, 90% CI [.07 - .09].
Results indicated four subscales of the PSCSM: Preparation for Bias and Discrimination, 13
items (α = 0.97); Egalitarianism, 7 items (α = 0.92); History of Other Groups, 4 items (α = 0.94);
Maintenance of Inequality, 3 items (α = 0.69).
Item level comparisons of the PSCSM and PRESBM were conducted to preliminarily
construct of class. Items 5 and 21 loaded on the Preparation for Bias and Discrimination factor
in the PSCSM and the Maintenance of Inequality factor in the PRESBM. Additionally, item 6 of
the PSCSM cross loaded between the Preparation for Bias and Discrimination and
Egalitarianism factors and item 17 cross loaded between the Maintenance of Inequality and
Egalitarianism factors.
Additional Analyses
Robust linear regression and correlational analyses were conducted to assess the
hypothesized relationships between socialization practices and parental characteristics. Bivariate
analyses demonstrated no significant relationships between parent’s level of education,
employment status, or income and their socialization practices for any dimension of socialization
(Table 4). Parental experiences of class-based discrimination were significantly related to
increases in their socialization practices in the Preparation for Bias and Discrimination (r =
.18, p < .01) and History of Other Groups (r = .13, p < .05) but not the Egalitarianism (r =
.04, n.s.) or Maintenance of Inequality (r = .13, n.s.) factors. Parents societal and community
based subjective social class was not significantly related to their socialization practices in any
domains of socialization (Table 4). Bivariate relationships between parental SES, subjective
social class, and experiences of class-based discrimination are reported in Table 4.
Robust multiple linear regression analyses were conducted to assess parental socialization
practices using objective SES (i.e., income, education, job-status), subjective social class (i.e.,
community and society), and class-based discrimination as predictors. For the dimension of
Preparation for Bias and Discrimination, results indicated that the model explained 5% of the
variance in socialization scores (R² =.051, F (6, 220) = 2.41, p < .05). As shown in Table 5,
socialization scores in this dimension. For the dimension of Egalitarianism, the model accounted
for almost no variance in socialization scores (R² = .01, F (6, 220) = .50, p =.81), and no
variables significantly predicted socialization (see Table 5). For the History of Other Groups
dimension, 4% of the variance in socialization scores was accounted for by the model (R² = .04,
(F (6, 220) = 2.35, p < .05) and class-based discrimination significantly predicted parent’s
socialization practices (β = .16, p < .05). For the dimension of Maintenance of Inequality, the
model explained approximately 7% of the variance (R² = .07, F (6, 220) = 3.42, p < .01). Similar
to patterns found in other dimensions of socialization, class-based discrimination significantly
predicted (β = .16, p < .05) parental socialization practices in addition to parental income (β =
-.16, p = .01). Of note, societal based subjective social class was a marginally significant predictor
(β = .22, p = .05) of socialization in this dimension. Additional information regarding each
predictor variable and dimensions of socialization can be found in Table 5.
Discussion
Based on prior research highlighting the importance of social class perceptions, results of
the current study provide some insight into one potential mechanism of social class perceptions
in White, Non-Hispanic families: parental socialization. Results of this study support the
hypothesis that aspects of social class, like race, gender, and ethnicity, are discussed in early
childhood and are associated with parental characteristics. Importantly, this study is exploratory
and is to the authors’ knowledge the first to explore social class socialization using the current or
perceptions of ones’ own social class develop, but emphasis is placed on next steps and future
directions as well.
Findings support the presence of four dimensions in the adapted PSCSM (Hughes &
Johnson, 2001; Pahlke et al., 2012). However, results of the PRESBM indicated that the
four-factor model does not adequately represent the data in this White, Non-Hispanic population.
Unlike the PSCSM, including modifications in the PRESBM did not improve the model fit. This
finding suggests that the four-factor structure specified by the EFA does not account for
covariance between the items, thus, items of the PRESBM likely do not measure specific
dimensions but are each related in complex ways. Although dimensions of each measure are not
analogous, differences in item factor loadings were still assessed at this preliminary stage and
suggest that several items may successfully discriminate between the constructs of interest (i.e.,
racial socialization, class socialization). Specifically, item 5 (i.e., “About the possibility that
some people might treat him/her badly or unfairly because of our income/education/social
class.”) and item 21 (i.e., “People of different income/education/social classes have different
values and beliefs.”) loaded on to the Preparation for Bias and Discrimination factor of the
PSCSM which includes items that discuss the possibility and/or reality that individuals of certain
social classes are or have been subjected to bias and discriminatory treatment based on their
group membership. However, when these items were assessed in relation to the PRESBM, they
loaded on to the Maintenance of Inequality factor which includes items that promote
discriminatory practices or minimize the experiences of others (i.e., racial and ethnic minorities).
Previous research using the PRESBM found that White, Non-Hispanic parents with more
racially biased attitudes were more likely to socialize their children with messages that
the current study’s finding that this item is related to bias and discrimination toward racial and
ethnic minority groups and belongs in the Maintenance of Inequality factor of the PRESBM in
this sample. It is hypothesized that this item loads on to the Preparation for Bias and
Discrimination factor of the PSCSM based on systematic and institutional social hierarchy’s and
class-based stereotypes that promote and exacerbate class differences such as those found in
popular media (Bullock, Fraser Wyche, & Williams, 2001; Streib et al., 2017). Furthermore,
items 6 (i.e., “People of other income/education/social classes are just as trustworthy as people of
our own.”) and 17 (i.e., “American society is fair to all income/education/social classes”) cross
loaded between two factors of the PSCSM which suggests these items may not be valid in
measuring the specified dimension of class socialization and may be further adapted or omitted
from the measure.
Results further support the potential utility of some subscales of the PSCSM as they are
related to previously identified predictors of socialization. Similar to previous work in
discrimination and socialization, the current study demonstrated that parental reports of
class-based discrimination predicted a higher frequency of class socialization in the Preparation for
Bias and Discrimination, History of Other Groups, and Maintenance of Inequality subscales.
Hughes and Johnson (2001) reported that higher levels of parental experiences of discrimination
were positively correlated with socialization messages regarding Preparation for Bias but not
Promotion of Mistrust, a subscale similar to that of the current study’s Maintenance of
Inequality. Further, a study by Saleem and colleagues (2016) demonstrated that parental
experiences of discrimination were related to messages of Preparation for Bias in addition to
Promotion of Mistrust as moderated by parental perceptions of neighborhood cohesion.
characteristics and socialization practices in children ages 3-7 (Hughes et al. 2006; Smith,
Reynolds, Fincham, & Beach; 2016). Thus, the current study adds a unique contribution to
current literature regarding social class socialization practices in young children in particular.
Previous research by Kunstman and colleagues (2016) demonstrated that White individuals
rated lower SES whites as a status threat and socially distanced themselves from these
individuals particularly when they highly identified with their racial in-group. Further, racial and
ethnic socialization literature has demonstrated that stronger ethnic identity is related to more
frequent messages of Preparation for Bias in Latino families (Hughes et al., 2006). Based on
these findings, the current study employed measures of societal and community-based class
identity to assess their relationship with various dimensions of socialization. Results of the
current study did not find any significant relationships between parental subjective social class
and socialization practices; however, societal based subjective social class was a marginally
significant predictor of socialization in the Maintenance of Inequality subscale. One potential
explanation for this discrepancy in findings is the use of the MacArthur Scale of Subjective
Social Status as a measurement of social class identity. While this scale measures parent’s own
ideals of their social class standing as compared to others, it does not measure the salience of
their social class standing as part of their identity. Future studies that explicitly measure parental
social class identity and its salience may better demonstrate any potential relationship between
class identity and class socialization practices. Conversely, income predicted socialization scores
in the Maintenance of Inequality subscale such that a decrease in income was related to an
increase in parental messages that promote the marginalization or distancing of other social class
groups. This finding supports current theory regarding sentiments of disenfranchisement in
Kunstman and colleagues (2016) that demonstrated a similar trend of social distancing in higher
income White individuals.
The findings of this study include several limitations. First, limitations of MTurk have
been identified, including the potential for practice effects based on previous research
responding, attrition, and dishonest responding; however, these issues, as well as the sample
demographics, are similar to face-to-face task administration suggesting added-value of MTurk’s
convenience (e.g., Buhrmester, Talaifar, & Gosling, 2018; Shapiro, Chandler, & Mueller, 2013;
Longo, Coyne, & Joseph, 2018). Next, while the current sample size is in accordance with
suggestions regarding the determination of powered samples for structural equation modeling
(Costello & Osborne, 2005), a larger, more diverse sample may provide more generalizable
results (e.g. Hogarty, Hines, Kromrey, Ferron, & Mumford, 2005; MacCallum, Widaman,
Zhang, & Hong, 1999). For example, the current study did not obtain much variance in family
characteristics including parental education and employment status and families, on average,
were middle-income. Given prior work to suggest that SES may be related to the frequency and
types of parental socialization messages, in addition to the preliminary findings of this study, a
more diverse sample may yield a more nuanced depiction of the relationship between SES and
class socialization in White, Non-Hispanic families (Hughes et al., 2006). Third, although the
current study deliberately focused on White, Non-Hispanic families, the evolution of this
literature must consider the intersectionality of socialization of race and ethnicity, as well as
other socialized aspects of identity (e.g., gender) and class (e.g. Jones et al., 2018; Seaton, Gee,
Neblett, & Spanierman, 2018; Kids Count Data Center, 2018). Additionally, the current study
cannot make definitive conclusions regarding the validity of the PSCSM as it was adapted from a
related to class socialization (Jones et al., 2018; Pahlke et al., 2012). The measure also does not
capture non-explicit forms of socialization including implicit messages that parents may promote
through their own attitudes or behaviors. Finally, while previous research has demonstrated a
relationship between socialization practices and demographic factors such as neighborhood, age,
and gender, the current study did not examine these factors at this stage of investigation due to an
interest in general patterns.
This study examined the variability in and potential correlates of social class socialization in
White, Non-Hispanic parents of young children. Parents who may perceive class as a more
salient part of their lives, through experiences of discrimination or objective measures of their
social standing, engage in more discussions regarding class and its meaning for their family, their
children, and society as a whole. Importantly, the current study does not investigate causal
relationships, thus, future research that more explicitly targets precursors and functions of social
class socialization may provide insight to further inform prevention and intervention techniques
for parents and children. Future research may consider the effects of specific patterns of parental
socialization in addition to other socializing agents (e.g., peers, media) on children’s well-being,
children’s awareness of social class hierarchies, and their own perceptions of their in-group and
out-group memberships. Furthermore, future research may aim to identify potential longitudinal
effects of early parental socialization messages into childhood and adolescence including
educational (e.g., lower engagement) and social behaviors (e.g., social distancing of out-groups)
in White, Non-Hispanic populations (Calarco, 2014; Malat et al., 2018). Further elucidating
parent’s role in shaping young children’s beliefs about social class may be an important step in
further understanding psychosocial pathways through which social class perceptions relate to
Table 1
Demographic Characteristics of the Participating Families
Measure n % M SD Range
Parent sex
Female 129 56.8
Male 98 43.2
Parent Age 34 6.86 19-57
Neighborhood
Urban 45 19.8
Suburban 133 58.6
Rural 49 21.6
Relationship to child
Biological Parent 209 92.1
Step-Parent 4 1.8
Adoptive Parent 6 2.6
Foster Parent 1 0.4
(Great)-/Grandparent 4 1.8
Other legal guardian 3 1.3
Income 68,848 39,221 100-380,000
Federal Poverty Level 11 4.8 Employment Status
Employed-Full Time 171 75.3
Employed-Part Time 32 14.1
Unemployed-Searching 6 2.6
Unemployed 18 7.9
Education
Less than HS/GED 1 0.4
High School or GED 17 7.5
Some College 44 19.4
Associates Degree 41 18.1
Bachelor’s Degree 102 44.9
Master’s Degree 21 9.3
Doctorate Degree 1 0.4
Child Sex
Female 112 49.3
Male 115 50.7
Table 2
Rotated Factor Pattern Matrix and Interfactor Correlations: EFA of the PRESBM
Factor
Item Factor 1 Factor 2 Factor 3 Factor 4
1. People are equal 0.74 0.02 0.05 -0.04
2. Discrimination of other groups in the past
0.05 0.67 0.18 -0.08
3. Important people in history from other groups
0.10 0.12 0.73 -0.02
4. Read about history or traditions of other groups
-0.05 0.06 0.87 -0.01
5. Possibility of experiencing bias 0.01 0.26 0.11 0.47
6. Trustworthiness of other groups 0.59 0.16 0.20 -0.05
7. All people have an equal chance in life
0.64 -0.08 0.14 0.21
8. Make friends with other groups 0.84 0.10 -0.06 0.05
9. Discrimination of our group 0.01 0.56 -0.03 0.28
10. Discrimination of other groups 0.15 0.86 -0.12 0.01
11. Appreciate people of all backgrounds
0.90 0.07 -0.04 -0.01
12. Witness discrimination of other groups
0.02 0.57 0.08 0.27
13. Past discrimination of other groups
-0.01 0.81 0.08 0.03
14. Importance of friends of same group
-0.00 0.13 -0.08 0.76
15. Importance of getting along with all people
0.84 0.02 0.01 -0.05
16. Seeing poor treatment of other groups
-0.02 0.56 0.05 0.34
17. Society is fair to all people 0.47 -0.26 0.05 0.48
18. Other groups are still discriminated against
0.05 0.82 0.04 0.03
19. Learn about history or traditions of other groups
0.10 -0.02 0.84 0.08
20. Our group has better opportunities than others
-0.08 0.57 0.02 0.40
21. People of different groups have different beliefs
0.17 0.10 0.22 0.29
22. Society is not fair to all -0.01 0.82 0.05 -0.03
23. Marrying someone from another group is a bad idea
-0.01 0.01 -0.14 0.82
24. People are treated badly because of their group
0.06 0.82 0.04 0.01
25. History of others groups in our country
0.02 0.25 0.63 0.05
Intercorrelations
Factor 1 ̶
Factor 2 0.56 ̶
Factor 3 0.68 0.72 ̶
Factor 4 0.10 0.42 0.35 ̶
Table 3
Rotated Factor Pattern Matrix and Interfactor Correlations: EFA of the PSCSM
Factor
Item Factor 1 Factor 2 Factor 3 Factor 4
1. People are equal -0.01 0.81 -0.02 0.03
2. Discrimination of other groups in the past
0.82 0.06 0.05 -0.05
3. Important people in history from other groups
0.27 0.11 0.56 -0.04
4. Read about history or traditions of other groups
0.04 0.05 0.80 -0.01
5. Possibility of experiencing bias 0.80 0.01 -0.07 0.12
6. Trustworthiness of other groups 0.32* 0.64 -0.00 -0.10
7. All people have an equal chance in life
0.15 0.56 0.12 0.07
8. Make friends with other groups 0.08 0.78 0.03 0.01
9. Discrimination of our group 0.86 -0.04 -0.01 0.11
10. Discrimination of other groups 0.89 0.02 0.05 -0.07
11. Appreciate people of all backgrounds
0.00 0.87 0.06 0.00
12. Witness discrimination of other groups
0.77 -0.00 -0.01 0.27
13. Past discrimination of other groups
0.83 -0.02 0.13 -0.01
14. Importance of friends of same group
0.50 0.02 -0.16 0.60
15. Importance of getting along with all people
0.01 0.89 -0.01 -0.01
16. Seeing poor treatment of other groups
0.75 -0.04 0.08 0.29
17. Society is fair to all people -0.07 0.28* 0.30 0.50
18. Other groups are still discriminated against
0.89 0.00 0.06 -0.06
19. Learn about history or traditions of other groups
0.04 0.03 0.90 -0.00
20. Our group has better opportunities than others
0.70 0.01 0.07 0.19
21. People of different groups have different beliefs
0.57 0.12 0.14 0.20
22. Society is not fair to all 0.88 0.09 -0.06 -0.06
23. Marrying someone from another group is a bad idea
0.37 -0.13 0.01 0.54
24. People are treated badly because of their group
0.83 0.12 0.02 -0.13
25. History of others groups in our country
0.15 -0.02 0.81 0.04
Intercorrelations
Factor 1 ̶
Factor 2 0.59 ̶
Factor 3 0.77 0.69 ̶
Factor 4 0.10 -0.02 0.12 ̶
Table 4
Correlations of Latent Constructs and Covariates
Variable 1 2 3 4 5 6 7 8 9 10
Construct
1. Societal subjective social class
- .80* -.27* .04 .06 .07 .10 .45* .09 .32*
2. Community subjective social class
.80* - -.20* .03 .07 .05 .07 .35* .01 .24*
3. Class-based discrimination
-.27* -.20* - .18* .04 .13 .13 -.18* -.14* -.08
4. Preparation for discrimination and bias
.04 .03 .18* - .71 *
.82* .54* -.06 .03 .00
5. Egalitarianism .06 .07 .04 .71* - .75* .46* .00 -.01 .03
6. History of other groups .07 .05 .13 .82* .75 *
- .47* -.04 .05 -.00
7. Maintenance of inequality
.10 .07 .13 .54* .46 *
.47* - -.09 .07 .05
Covariates
8. Income .45* .35* -.18* -.06 .00 -.04 -.09 - .15* .37*
9. Job-status .09 .01 -.14* .03 -.01 .05 .07 .15* - .12
10. Education .32* .24* -.08 .00 .03 -.00 .05 .37* .12 -
Table 5
Summary of robust regression analyses for variables predicting socialization practices across dimensions.
Preparation Egalitarianism History Maintenance
Variable B SE B β B SE B β B SE B β B SE B β
Education -.44 1.54 -.02 .39 .77 .04 -.09 .50 -.01 .11 .23 .03 Job-Status 1.08 1.04 .07 -.02 .60 -.00 .45 .37 .08 .32 .17 .11
Income .00 .00 -.09 .00 .00 -.03 .00 .00 -.08 .00 .00
Figure 1. Scree plot of eigen values from exploratory factor analysis of the Parental Social Class
Figure 2. Factor model produced by the confirmatory factor analysis of the Parental Social Class
REFERENCES
Adler, N. E., & Stewart, J. (2007). The MacArthur Scale of Subjective Social Status. In Psychosocial Research Notebook. Retrieved from
http://www.macses.ucsf.edu/research/psychosocial/subjective.php
Anderson, R.E., Hussain, S.B., Wilson, M.N., Shaw, D.S., Dishion, T.J., & Williams, J.L. (2015). Pathways to pain: Racial discrimination relations between parental functioning and child psychosocial well-being. Journal of Black Psychology, 41(6), 491-512. doi: 10.1177/0095798414548511
Bourdieu, P. (1987). What makes a social class? On the theoretical and practical existence of groups. Journal of Sociology, 32, 1-17.
Bronfenbrenner, U. (1977). Toward an experimental ecology of human development. American Psychologist, 32(7), 513-531.
Brown, C.M., Ling, W. (2012). Ethnic-racial socialization has an indirect effect on self-esteem for Asian American emerging adults. Psychology, 3(1), 78-81.
http://dx.doi.org/10.4236/psych.2012.31013
Brown-Iannuzi, J. L., Payne, K. B., Rini, C., Duhamel, K. N., & Redd, W. H. (2014). Objective and subjective status and health symptoms in patients following hematopoietic stem cell transplantation. Psycho-Oncology, 23, 740-748. doi: 10.1002/pon.3473
Buhrmester, M.D., Talaifar, S., & Gosling, S.D. (2018). Evaluation of Amazon’s mechanical turk, it’s rapid rise, and its effective use. Perspectives on Psychological Science, 13(2), 149-154. doi: 10.1177/1745691617706516
Bullock, H. E., Fraser Wyche, K., & Williams, W. R. (2001). Media images of the poor. Journal of Social Issues, 57(2), 229-246.
Bullock, H. E.; Limbert, W. M. (2003). Scaling the Socioeconomic Ladder: Low-Income Women's Perceptions of Class Status and Opportunity. Journal of Social Issues, 59(4), 693-709. http://dx.doi.org/10.1046/j.0022-4537.2003.00085.x
Calarco, J. M. (2014). Coached for the classroom: Parents’ cultural transmission and children’s reproduction of educational inequalities. American Sociological Review, 79, 1015-1037. https://doi.org/10.1177/0003122414546931
Cirino, P.T., Chin, C.E., Sevcik, R.A., Wolf, M., Lovett, M., & Morris, R.D. (2002). Measuring socioeconomic status: Reliability and preliminary validity for different approaches. Assessment, 9(2), 145-155.
Costello, A.B., & Osborne, J.W. (2005). Best practices in exploratory factor analysis: Four recommendation for getting the most from your analysis. Practical Assessment, Research & Evaluation, 10(7), Retrieved from http://pareonline.net/getvn.asp?v=10&n=7
Cundiff, J. M., Smith, T. W., Uchino, B. N., & Berg, C. A. (2013). Subjective social status: Construct validity and associations with psychosocial vulnerability and self-rated health. International Journal of Behavioral Medicine, 20(1), 148–158. doi: 10.1007/s12529-011-9206-1
Cunningham, M. (2001). The influence of parental attitudes and behaviors on children’s
attitudes toward gender and household labor in early adulthood. Journal of Marriage and Family Relations, 63(1), 111-122.
Destin, M., Rheinschmidt-Same, M., & Richeson, J.A. (2017). Status-based identity: A
conceptual approach integrating the social psychological study of socioeconomic status and identity. Perspectives on Psychological Science, 12(2), 270-289.
doi:10.1177/1745691616664424
Diemer, M. A., Mistry, R. S., Wadsworth, M. E., López, I., & Reimers, F. (2013). Best Practices in Conceptualizing and Measuring Social Class in Psychological Research: Social Class Measurement. Analyses of Social Issues and Public Policy, 13(1), 77–113.
https://doi.org/10.1111/asap.12001
Elenbaas, L. (2019). Perceptions of economic inequality are related to children’s judgements about access to opportunities. Developmental Psychology, 55(3), 471-481.
http://dx.doi.org/10.1037/dev0000550
Fabrigar, L. R., & Wegener, D. T. (2011). Exploratory Factor Analysis. Oxford, England: Oxford University Press.
Fuller-Rowell, T.E., Evans, G.W., & Ong, A.D. (2012). Poverty and health: The mediating role of perceived discrimination. Psychological Science, 23(7), 734-739. doi:
10.1177/0956797612439720
García Coll, C., Lamberty, G., Jenkins, R., McAdoo, H.P., Crnic, K., Wasik,, B.H., & Vázquez García, H. (1996). An integrative model for the study of developmental competencies in minority children. Child Development, 67(5), 1891-1914.
http://www.jstor.org/stable/1131600
Giatti, L., Valle Camelo, L., Castro Rodrigues, J.F., & Barreto, S.M. (2012). Reliability of the MacArthur scale of subjective social status-Brazilian longitudinal study of adult health (ELSA-Brasil). BMC Public Health, 12, 1096. doi: 10.1186/1471-2458-12-1096
Goodman, E., Adler, N.E., Daniels, S.R., Morrison, J.A., Slap, G.B., & Dolan, L.M. (2003). Impact of objective and subjective social status on obesity in a biracial cohort of adolescents. Obesity Research, 11(8), 1018-1026.
Harris, J. R. (1995). Where is the child’s environment? A group socialization theory of development. Psychological Review, 102(3), 458–489. https://doi.org/10.1037/0033-295X.102.3.458
Hershberg, R.M., & Johnson, S.K. (2019). Critical reflection about socioeconomic inequalities among white young men from poor and working-class backgrounds. Developmental Psychology, 55(3), 562-573. http://dx.doi.org/10.1037/dev0000587
Hogarty, K.Y., Hines, C.V., Kromrey, J.D., Ferron, J.M., & Mumford, K.R. (2005). The quality of factor solutions in exploratory factor analysis: The influences of sample size,
communality, and overdetermination. Educational and Psychological Measurement, 65(2), 202-226. doi: 10.1177/0013164404267287
Hughes, D., & Chen, L. (1997). When and what parents tell children about race: An examination of race-related socialization among African American families. Applied Developmental Science, 1(4), 200-214.
Hughes, D., & Johnson, D. (2001). Correlates in children’s experiences of parents’ racial socialization behaviors. Journal of Marriage and Family, 63, 981-995.
Hughes, D., Rodriguez, J., Smith, E.P., Johnson, D.J., Stevenson, H.C., & Spicer, P. (2006). Parents’ ethnic-racial socialization practices: A review of research and directions for future study. Developmental Psychology, 42(5), 747-770. doi: 10.1037/0012-1649.42.5.747
Isenberg, N. (2017). White trash: The 400-year untold history of class in America. Penguin.
Jones, D. J., Anton, M., Zachary, C., Pittman, S., Turner, P., Forehand, R., & Khavjou, O. (2016). A review of the key considerations in mental health services research: A focus on low-income children and families. Couple and Family Psychology: Research and Practice, 5(4), 240–257. https://doi.org/10.1037/cfp0000069
Jones, D.J., Loiselle, R., & Highlander, A. (2018). Parent-Adolescent socialization of social class in low income White families: Theory, research, & future directions. Journal of Research on Adolescence, 28(3), 622-636. doi: 10.1111/jora.12392
Kids Count Data Center. (2018). Children in poverty by race and ethnicity in the United States. [Data file]. Retrieved from https://datacenter.kidscount.org/data/tables/44-children-in-poverty-by-race-and-ethnicity
Kunstman, J. W., Plant, E. A., & Deska, J. C. (2016). White ≠ Poor: Whites distance, derogate, and deny low-status ingroup members. Personality and Social Psychology Bulletin, 42(2), 230–243. doi:10.1177/0146167215623270
Longo, Y., Coyne, I., & Joseph, S. (2018). Development of the short version of the scales of general well-being: The 14-item SGWB. Personality and Individual Differences, 124, 31-34. https://doi.org/10.1016/j.paid.2017.11.042
Lott, B. (2012). The social psychology of class and classism. American Psychologist, 67(8), 650–658. doi: 10.1037/a0029369
MacCallum, R. C., Widaman, K. F., Zhang, S., & Hong, S. (1999). Sample size in factor analysis. Psychological Methods, 4(1), 84-99. http://dx.doi.org/10.1037/1082-989X.4.1.84
Malat, J., Mayorga-Gallo, S., & Williams, D. R. (2018). The effects of whiteness on the health of whites in the USA. Social Science & Medicine, 199, 148-156.
http://dx.doi.org/10.1016/j.socscimed.2017.06.034
McLoyd, V.C. (2019). How children and adolescents think about, make sense of, and respond to economic inequality: Why does it matter? Developmental Psychology, 55(3), 592-600. http://dx.doi.org/10.1037/dev0000691
Muscatell, K.A., Dedovic, K., Slavich, G.M., Jarcho, M.R., Breen, E.C., Bower, J.E., … Eisenberger, N.I. (2016). Neural mechanisms linking social status and inflammatory responses to social stress. Social Cognitive and Affective Neuroscience, 11(6), 915-922. doi: 10.1093/scan/nsw025
Neblett, E.W., Jr., Banks, K.H., Cooper, S.M., & Smalls-Glover, C. (2013). Racial identity mediates the association between ethnic-racial socialization and depressive symptoms. Cultural Diversity and Ethnic Minority Psychology, 19(2), 200-207. doi: 10.1037/a0032205
Neblett, E.W., Jr., White, R.L., Ford, K.R., Philip, C.L., Nguyên, H.X., & Sellers, R.M. (2008). Patterns of racial socialization and psychological adjustment: Can parental communications about race reduce the impact of racial discrimination? Journal of Research on Adolescence, 18(3), 477-515.
Operario, D., Adler, N.E., & Williams, D.R. (2004). Subjective social status: Reliability and predictive utility for global health. Psychology and Health, 19(2), 237-246. doi:
10.1080/08870440310001638098
Pahlke, E., Bigler, R.S., & Suizzo, M.A. (2012). Relations between colorblind socialization and children’s racial bias: Evidence from European American mothers and their preschool children. Child Development, 83(4), 1164-1179. doi: 10.1111/j.1467-8624.2012.01770.x
Payne, K. (2017). The broken ladder: How inequality affects the way we think, live, and die. New York: Viking.
Ruck, M.D., Mistry, R.S., & Flanagan, C.A. (2019). Children’s and adolescents’ understanding and experiences of economic inequality: An introduction to the special section.
Developmental Psychology, 55(3), 449-456. http://dx.doi.org/10.1037/dev0000694
Russell, G. (1996). Internalized classism: The role of class in the development of self. Women & Therapy, 18(3-4), 59-71. doi: 10.1300/J015v18n03_07
Saleem, F. T., English, D., Busby, D. R., Lambert, S. F., Harrison, A., Stock, M. L., & Gibbons, F. X. (2016). The impact of African American parents’ racial discrimination experiences and perceived neighborhood cohesion on their racial socialization practices. Journal of Youth and Adolescence, 45, 1338-1349. doi:10.1007/s10964-016-0499-x
Schermelleh-Engel, K., Moosbrugger, H., & Müller, H. (2003). Evaluating the Fit of Structural Equation Models: Tests of Significance and Descriptive Goodness-of-Fit Measures. Methods of Psychological Research, 8(2), 23-74.
Schreiber, J. B., Nora, A., Stage, F. K., Barlow, E. A., & King, J. (2006). Reporting structural equation modeling and confirmatory factor analysis results: A review. The Journal of Educational Research, 99, 323-338. https://doi.org/10.3200/JOER.99.6.323-338.
Seaton, E. K., Gee, C. G., Neblett, E., & Spanierman, L. (2018). New direction for racial
discrimination research as inspired by the integrative model. American Psychologist, 73(6), 768-780. http://dx.doi.org.libproxy.lib.unc.edu/10.1037/amp0000315
Seider, S., Clark, S., Graves, D., Kelly, L.L., Soutter, M., El-Amin, A., & Jennett, P. (2019). Black and Latinx adolescents' developing beliefs about poverty and associations with their awareness of racism. Developmental Psychology, 55(3), 509-524.
http://dx.doi.org/10.1037/dev0000585
Shapiro, D. N., Chandler, J., & Mueller, P. A. (2013). Using Mechanical Turk to study clinical populations. Clinical Psychological Science, 1(2), 213–220. doi:
10.1177/2167702612469015
Smith, S. M., Reynolds, J. E., Fincham, F. D., & Beach, S. R. H. (2016). Parental experiences of racial discrimination and youth racial socialization in two-parent African American
families. Cultural Diversity and Ethnic Minority Psychology, 22 (2), 268-276. http://dx.doi.org/10.1037/cdp0000064
Stephens, N.M., Markus, H.R., & Phillips, L.T. (2014). Social class culture cycles: How three gateway contexts shape selves and fuel inequality. Annual Review of Psychology, 65, 611-634. doi: 10.1146/annurev-psych-010213-115143
Streib, J., Ayala, M., & Wixted, C. (2017). Benign Inequality: Frames of Poverty and Social Class Inequality in Children’s Movies. Journal of Poverty, 21, 1-19.
Thomas, V., & Azmitia, M. (2014). Does class matter? The centrality and meaning of social class identity in emerging adulthood. Identity: An International Journal of Theory and Research, 14(3), 195-213. doi: 10.1080/15283488.2014.921171
Thomas, A.J., Speight, S.L., & Witherspoon, K.M. (2010). Racial socialization, racial identity, and race-related stress of African American parents. The Family Journal: Counseling and Therapy for Couples and Families, 18(4), 407-412.
Vance, J. D. (2016). Hillbilly elegy. New York, NY: HarperCollins.