The Impact of Childcare Provider Behaviors and the Outdoor Environment on Preschool Children’s Physical Activity
by Justin Barnes
Honors Thesis Department of Nutrition University of North Carolina
2015
Approved:
______________________________ Advisor
ABSTRACT
Background: Preschool children’s physical activity (PA) opportunities at child care centers present an opportunity to reduce the obesity epidemic’s spread into the youngest generation. Through interactions with outdoor learning environments and their teachers, children’s PA levels may be affected. This study investigated how the outdoor environment and teacher behaviors may influence children’s PA.
Methods: Participants included 3-5 year olds and teachers from 49 child care centers in North Carolina. Classrooms were observed for four days, and children wore accelerometers to measure PA. Teachers completed questionnaires examining PA-supportive behaviors. Seven outdoor environment features and five PA-supportive teacher behaviors were studied.
Results: Across all centers, children averaged 10.5 minutes of moderate to vigorous physical activity per hour spent at child care. None of the outdoor environment features or teacher
behaviors exhibited clear associations with children’s PA when examined individually or within comprehensive multivariable models.
TABLE OF CONTENTS
ABSTRACT ... i
BACKGROUND ... 1
METHODS ... 7
RESULTS... 16
DISCUSSION ... 27
BACKGROUND
Obesity and overweight is an ever-growing burden on the health of the American population, with 68.8% of adults classified as overweight or obese.1 Obesity is maintaining its position as the second leading preventable cause of disease and death in the United States, second only to tobacco use,2 and its rise in prevalence is not restricted to the adult population: in 2011-2012, the overweight and obesity rate among youth (ages 2-19 years) reached 31.8%, and even preschool age children (2-5 years) experienced a staggering overweight/obesity rate of 22.8%.3 Unfortunately, many of these overweight and obese preschool children will maintain their weight status through their adolescent years and into maturity, as studies have demonstrated that childhood weight status tends to track into adulthood.4 The overall prevalence of overweight and obesity in children has more than doubled since the 1970’s, and the prevalence of obesity among all children and adolescents aged 2 years and older has increased by an average of 0.5% annually since 1980.5 Although obesity and overweight levels in younger children have stabilized recently, the prevalence remains high.3
Body weight management is always a matter of energy balance,7 but the specific contributors to positive energy balance (which can result in obesity) in any individual are complex and include genes, the food environment and physical activity (PA) environment, poor dietary choices, and low energy expenditure.8 The role of genes is a complex and continuing area of study; studies have demonstrated that the American genotype has not significantly changed over the course of recent history, yet the role of genes cannot be completely ignored because of complex gene-environment interactions. The American environment has indeed become more obesity-promoting, as energy-dense foods have become more pervasive and portion sizes have increased. Observations of immigrants have found that the risk of obesity increases upon migration from Hispanic to more affluent countries,9 and the adoption of a Western dietary pattern is believed to be the major contributor to immigrant obesity.10 These observations support the proposal that obesity may result when an obesity-promoting environment interacts with the innate gene pool, triggering the phenotypic expression of obesity.11 The food available in the American food environment certainly includes foods high in fat and sugar, but the available research does not directly link the simple consumption of these specific macronutrients to obesity; they may, however, be linked to a higher likelihood of overeating, which may in turn lead to obesity.8
Some of the strongest explanatory clues concerning the recent obesity epidemic have pointed to decreased energy expenditure. Cross-sectional and population studies have
demonstrated a negative correlation between PA, a major component of energy expenditure,7 and indices of obesity, such as BMI.8 PA has also been shown to be protective against the
has occurred in a growing number of individuals that has not been matched by a decrease in energy intake.8 Furthermore, unlike genes or the environment, PA is a behavior and may be more easily modified. Thus, interventions targeting PA may be an effective way to halt the spread of obesity among preschool children.
Child care centers may provide the most opportune setting for children to accumulate PA because of the number of children enrolled in care outside of home. As of 2012, about 60% of America’s children aged 0-5 who were not yet in kindergarten were enrolled in some form of weekly nonparental care,13 where they spent a significant portion of their day; for instance, 3-5 year old children enrolled in center-based child care spend an average of 22.5 hours/week in nonparental care.14 Because of the significant amount of time spent in child care and the
importance of PA in weight management, children’s PA during child care is critical. The current NASPE recommendation for 3-5 year olds is at least 120 minutes of PA daily,15 but despite this recommendation, the amount of PA that children receive while in child care varies greatly and is directly associated with the particular preschool in which he or she is enrolled.16
The PA disparity among child care centers suggests that center-specific factors may work to facilitate or hinder children’s PA, and the quality of a center’s outdoor environment for active play and the association of this quality with children’s PA levels has been an emerging area of interest.17 A small amount of pioneering work has been done to examine which aspects of the outdoor environment seem to stimulate higher levels of PA in preschool-age children.
have inspected individual items in the outdoor environment, such as particular pieces of portable or fixed play equipment, have either found no association with PA, conflicted with other studies’ results, or lacked the methodological quality to present the evidence as conclusive.18
The outdoor environment may not be the only factor associated with children’s PA, however; teachers that accompany children outside are responsible for the coordination of structured active play, monitoring to ensure safety, active participation with children during unstructured play, the provision of play equipment, and similar duties that may foster, facilitate, and promote active play. As a result, teachers may serve as “gatekeepers” to children’s PA while in child care and hold an extraordinarily influential role.19
A very small body of literature exists on the role of teacher behaviors, but the available data suggest that teachers can powerfully influence children’s PA. For example, one study noted that, while portable play equipment is included in some rating scales for outdoor environment quality, it is the responsibility of the teacher to bring out the portable play equipment and
encourage its use. Furthermore, when teachers engaged children in any type of interaction during play, children’s play was interrupted and PA decreased.20
In fact, one study even showed that the mere presence of teachers on the playground, regardless of child-teacher interactions, decreased girls’ PA due to their wanting to stay close to teachers, who are mainly stationary.21
On the other hand, interviews with child care staff have also revealed that teachers at child care centers feel immense pressure from parents to prioritize academic matters over PA at child care and to guarantee above all else the safety of children during active play; teachers themselves also experience frustration when expected to use play spaces they feel are
inadequate.24 Many claim that children need to be taught to sit still in preparation for school, that staffing limitations hinder the supervision required for vigorous PA, and that there is not enough time to provide more opportunities for PA.25 Other obstacles noted include: the idea that children will become sick in wet weather, teachers’ personal preferences and beliefs about optimal
weather conditions (such as what is too hot, too cold, too wet, etc.), the time and hassle required to set up and stow away portable play equipment, allergies, dislike for the “chaos” of outdoor play, and a dislike for becoming sweaty.19 Because of these obstacles, teachers sometimes choose to withhold outdoor active play altogether or close off certain sections of the play area due to personal preferences or safety concerns.19
Clearly, the authority and influence vested in the gatekeeper role held by teachers in the outdoor environment can be used either for the facilitation or the suppression of PA in a unique and powerful way that is independent of the quality of the surrounding outdoor environment. Differences in personal frustrations, experiences, and preferences among teachers may result in behaviors that either foster or suppress children’s PA in the outdoor environment.
teacher behaviors influence preschool-age children’s PA while in child care. This study has three specific aims:
Aim 1: Identify which aspects of preschool children’s outdoor environments are associated with children’s PA.
Aim 2: Determine how various PA-supportive teacher behaviors relate to children’s PA.
METHODS
Data for this study were obtained from a study funded by the Robert Wood Johnson Foundation’s Healthy Eating Research and Active Living Research programs and conducted by researchers at the UNC Center for Health Promotion and Disease Prevention. This original study was designed to assess the reliability and validity of a self-administered version of the
Environment and Policy Assessment and Observation (EPAO) instrument in child care centers. The EPAO is a day-long, observation-based instrument that provides a comprehensive measure of nutrition and PA environments at child care centers. The EPAO relies on direct observation by trained observers; because the training process can be cost-prohibitive and onerous, the original study was designed to transform the EPAO into a version that can be completed by child care center staff without the need for trained observers. By creating a self-administered version of the EPAO and confirming its reliability against the original (observational) form, the burdens
associated with direct observation at child care could be mitigated.
children, a Staff General Questionnaire completed on two non-consecutive days by teachers of 3-5 year old classrooms, and observational data on classes of 3-3-5 year olds collected by trained observers on all four days. The Staff General Questionnaire aimed to survey all 3-5 year old classroom teachers at each participating center, so additional teachers were included for centers with multiple teachers for 3-5 year old classrooms or multiple 3-5 year old classrooms per center.
Data collected from each center were grouped into three categories that reflect the focus of this paper: outdoor environment quality, PA-supportive teacher behaviors, and children’s PA. Items from the outdoor environment and teacher behavior categories were then scored so that an overall outdoor environment score and an overall teacher behavior score could be created for each center using these items. These overall scores were intended to provide a holistic
assessment of outdoor environment quality and PA-supportive teacher behaviors for each center, so that the outdoor environment quality – PA relationship and teacher behavior – PA relationship could be analyzed.
Children’s PA was measured by accelerometers, and the specific outcome of interest was minutes of moderate to vigorous physical activity (MVPA) per hour at child care. For the
accelerometers used, MVPA cut-points corresponded to step counts of at least 2000 counts per minute.
and playground density. Playground density was reported as square feet available per child and was calculated using the number of 3-5 year old children enrolled and square footage of the outdoor space. Items measuring “variety” in the outdoor environment measured the number of different types of features present, without regard to the frequency of each type. Data on outdoor environment items were collected on each observation day and were averaged over all
observation days, yielding an average frequency of the observation of the outdoor environment items.
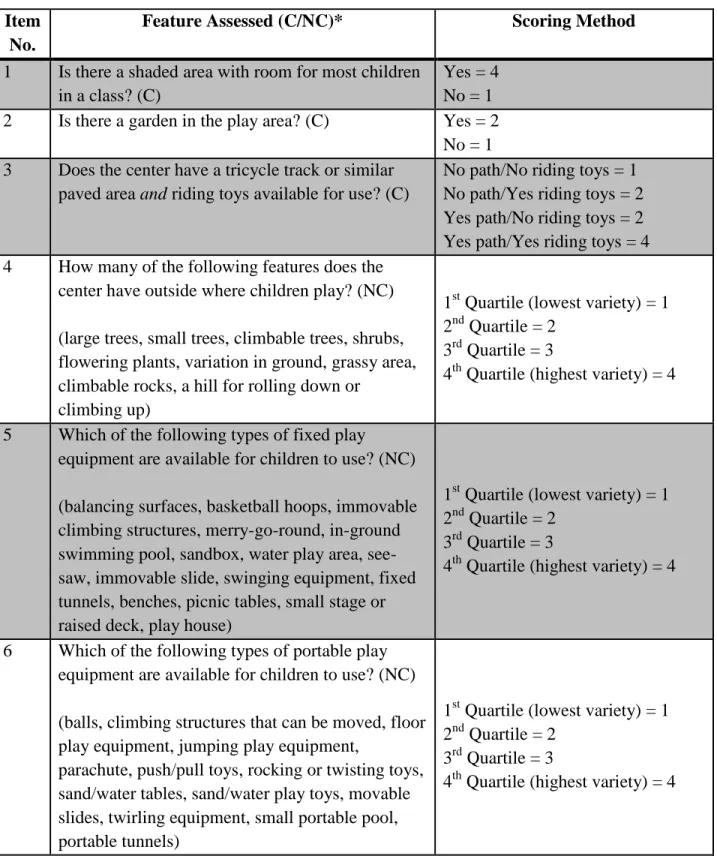
A scoring system was created for each item in the outdoor environment category to allow for the incorporation of each item into the overall outdoor environment score. Higher numerical values in the scoring system represented higher quality. For the four outdoor environment items that did not have strict categorical outcomes (variety of portable play equipment, variety of fixed play equipment, variety of natural features, and playground density), centers were scored from 1 to 4 based on the quartile within which that center fell when compared to all 49 participating centers. For example, a score of 4 on the item measuring the variety of natural features indicated that the center was in the top quartile for providing a wide variety of natural features in the outdoor environment. Because low playground density has been linked to higher PA,21 it followed a reversed scoring, with the centers in the quartile representing the highest playground density receiving a 1 and centers in the quartile representing the lowest playground density receiving a 4.
literature exists that supports the notion that an outdoor environment with a great variety of natural features, including vegetation, is associated with increased PA among children,26 the garden is a less-studied feature. While a garden adds natural variety, the activity of gardening may not contribute appreciably to MVPA due to a lower potential for movement. In addition, gardens take up physical space that may otherwise be used for open areas conducive to running and other, more vigorous PA opportunities. The tricycle/track question followed a unique
scoring, as well: having neither a track nor riding equipment corresponded to a score of 1, having one item but not the other corresponded to 2, and having both corresponded to a 4; this is based on literature highlighting the importance of riding toys for fostering children’s PA.27
Table 1: Outdoor environment category organization Item
No.
Feature Assessed (C/NC)* Scoring Method
1 Is there a shaded area with room for most children in a class? (C)
Yes = 4 No = 1 2 Is there a garden in the play area? (C) Yes = 2
No = 1 3 Does the center have a tricycle track or similar
paved area and riding toys available for use? (C)
No path/No riding toys = 1 No path/Yes riding toys = 2 Yes path/No riding toys = 2 Yes path/Yes riding toys = 4 4 How many of the following features does the
center have outside where children play? (NC) (large trees, small trees, climbable trees, shrubs, flowering plants, variation in ground, grassy area, climbable rocks, a hill for rolling down or
climbing up)
1st Quartile (lowest variety) = 1 2nd Quartile = 2
3rd Quartile = 3
4th Quartile (highest variety) = 4
5 Which of the following types of fixed play equipment are available for children to use? (NC) (balancing surfaces, basketball hoops, immovable climbing structures, merry-go-round, in-ground swimming pool, sandbox, water play area, see-saw, immovable slide, swinging equipment, fixed tunnels, benches, picnic tables, small stage or raised deck, play house)
1st Quartile (lowest variety) = 1 2nd Quartile = 2
3rd Quartile = 3
4th Quartile (highest variety) = 4
6 Which of the following types of portable play equipment are available for children to use? (NC) (balls, climbing structures that can be moved, floor play equipment, jumping play equipment,
parachute, push/pull toys, rocking or twisting toys, sand/water tables, sand/water play toys, movable slides, twirling equipment, small portable pool, portable tunnels)
1st Quartile (lowest variety) = 1 2nd Quartile = 2
3rd Quartile = 3
7 What is the density of the playground (in square feet/3-5 year old enrolled)? (NC) 1
st
Quartile (highest density) = 1 2nd Quartile = 2
3rd Quartile = 3
4th Quartile (lowest density) = 4 Overall Outdoor Environment Score Quartile rank of the sum of all
seven outdoor environment item scores
1st Quartile = 1 (lowest overall outdoor environment quality) 2nd Quartile = 2
3rd Quartile = 3
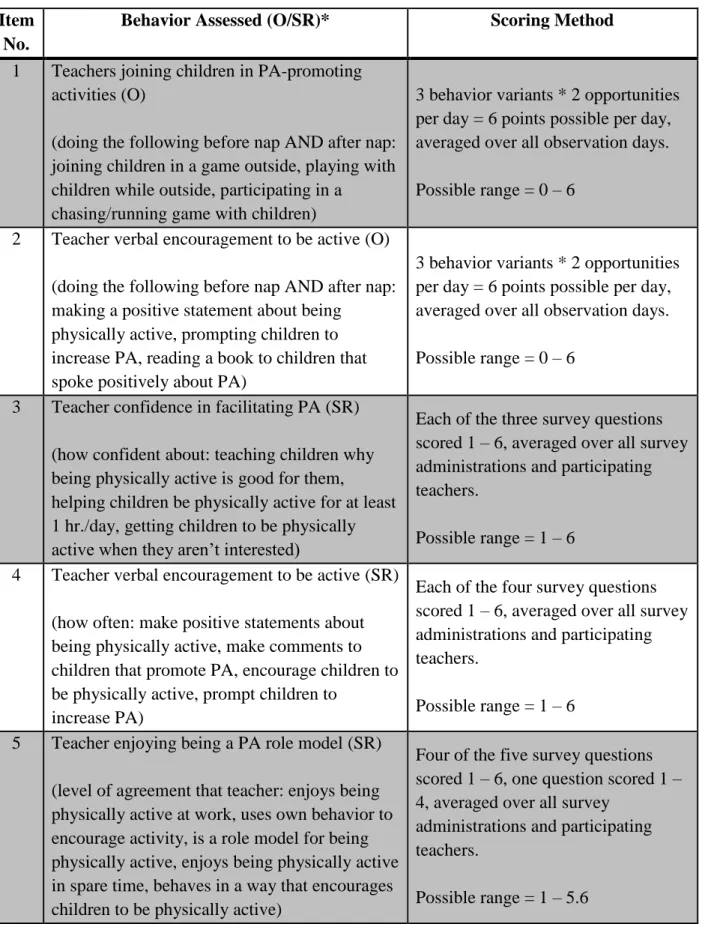
The teacher behavior category (Table 2) included five behaviors that teachers may exhibit to promote PA; two of these behaviors were observed, and three were self-reported via the staff questionnaire. The two observed behaviors were: teachers joining children in activities that promote PA and teachers verbally encouraging children to be physically active. The three
behaviors that were self-reported consisted of: teacher confidence in his or her ability to facilitate children’s PA, giving verbal encouragement to be physically active, and enjoying being a role model for children with respect to PA. Note that verbal encouragement to be physically active was measured both observationally and via self-report.
For the two observed behaviors, trained observers watched for the occurrence of 3 variants of each behavior, with an opportunity to exhibit those behaviors both before and after the children nap, for a maximum of 6 points. The three self-reported behaviors were scored by averaging all relevant survey questions for each behavior, most of which were answered on a Likert scale from 1-6; for the “enjoying being a PA role model” behavior, the survey item
concerning how often teachers use their own behavior to encourage activity was scored from 1-4, leading to a maximum of 5.6 points for that particular self-reported behavior. Observations were averaged across all observation days, and survey responses were averaged across all survey administrations to calculate the score for each behavior at each center.
Table 2: Teacher behavior category organization Item
No.
Behavior Assessed (O/SR)* Scoring Method
1 Teachers joining children in PA-promoting activities (O)
(doing the following before nap AND after nap: joining children in a game outside, playing with children while outside, participating in a
chasing/running game with children)
3 behavior variants * 2 opportunities per day = 6 points possible per day, averaged over all observation days. Possible range = 0 – 6
2 Teacher verbal encouragement to be active (O) (doing the following before nap AND after nap: making a positive statement about being
physically active, prompting children to increase PA, reading a book to children that spoke positively about PA)
3 behavior variants * 2 opportunities per day = 6 points possible per day, averaged over all observation days. Possible range = 0 – 6
3 Teacher confidence in facilitating PA (SR) (how confident about: teaching children why being physically active is good for them,
helping children be physically active for at least 1 hr./day, getting children to be physically active when they aren’t interested)
Each of the three survey questions scored 1 – 6, averaged over all survey administrations and participating teachers.
Possible range = 1 – 6 4 Teacher verbal encouragement to be active (SR)
(how often: make positive statements about being physically active, make comments to children that promote PA, encourage children to be physically active, prompt children to
increase PA)
Each of the four survey questions scored 1 – 6, averaged over all survey administrations and participating teachers.
Possible range = 1 – 6 5 Teacher enjoying being a PA role model (SR)
(level of agreement that teacher: enjoys being physically active at work, uses own behavior to encourage activity, is a role model for being physically active, enjoys being physically active in spare time, behaves in a way that encourages children to be physically active)
Four of the five survey questions scored 1 – 6, one question scored 1 – 4, averaged over all survey
administrations and participating teachers.
Overall Teacher Behavior Score Quartile rank of the sum of all five teacher behavior scores
1st Quartile = 1 (lowest level of PA-promoting teacher behaviors) 2nd Quartile = 2
3rd Quartile = 3
4th Quartile = 4 (highest level of PA-promoting teacher behaviors) *O = directly observed behaviors; SR = self-reported behaviors
Covariates measured included: the average age of observed children in each center, staff BMI, staff education level, percentage of the observed days during which the outdoor
RESULTS
Demographic data for participating teachers are presented in Table 3. Half of the 122 teachers held an associate degree or higher, and all were female. On average, teachers had 10 years of teaching experience, were about 37 years old, and had an average BMI of 28.
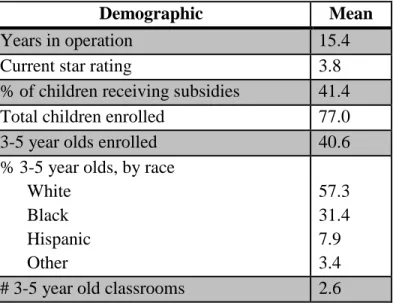
Demographic data for the 49 participating child care centers are presented in Table 4. Centers had been open for about 15 years and the average star rating (based on quality) was 3.8 out of 5 possible stars. Almost 40% of all children at the centers received child care subsidies, and about 41 3-5 year olds were enrolled at each center. Centers had an average of between two and three classrooms for 3-5 year olds.
Table 3: Demographic data for 122 participating teachers of 3-5 year old classrooms
Demographic Mean
Education (%)
No College Degree College Degree
50.0 50.0 Race (%)
White Black Other
52.3 38.7 9.0 Gender (%)
Female 100.0
Years as a teacher 10.0
Age 37.4
Table 4: Demographic data for 49 participating child care centers
Demographic Mean
Years in operation 15.4
Current star rating 3.8
% of children receiving subsidies 41.4
Total children enrolled 77.0
3-5 year olds enrolled 40.6
% 3-5 year olds, by race White
Black Hispanic Other
57.3 31.4 7.9 3.4
# 3-5 year old classrooms 2.6
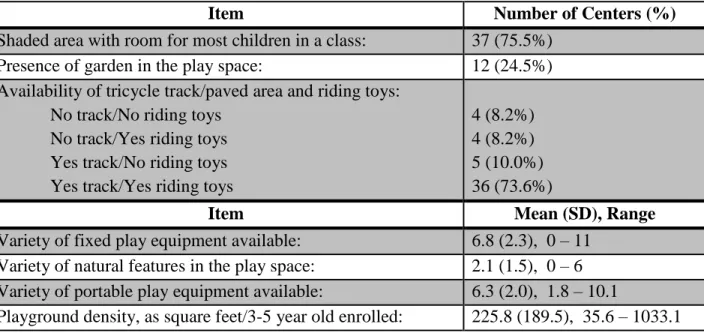
Table 5: Outdoor environment characteristics
Item Number of Centers (%)
Shaded area with room for most children in a class: 37 (75.5%)
Presence of garden in the play space: 12 (24.5%)
Availability of tricycle track/paved area and riding toys: No track/No riding toys
No track/Yes riding toys Yes track/No riding toys Yes track/Yes riding toys
4 (8.2%) 4 (8.2%) 5 (10.0%) 36 (73.6%)
Item Mean (SD), Range
Variety of fixed play equipment available: 6.8 (2.3), 0 – 11 Variety of natural features in the play space: 2.1 (1.5), 0 – 6 Variety of portable play equipment available: 6.3 (2.0), 1.8 – 10.1
Playground density, as square feet/3-5 year old enrolled: 225.8 (189.5), 35.6 – 1033.1
Table 6 lists data on teacher behaviors. Both of the observed (as opposed to the self-reported) teacher behaviors received average scores below 2. The data suggest that teachers took, on average, one to two opportunities per day to join children in PA-promoting activities.
Table 6: Teacher behavior characteristics
Item (O/SR)* Mean (SD), Range
Teacher joining children in PA-promoting activities (O): 1.6 (1.1), 0 – 5.25 Teacher verbal encouragement to be active (O): 1.9 (0.7), 0.5 – 3.5 Teacher confidence in facilitating PA (SR): 5.0 (0.5), 3.7 – 6.0 Teacher verbal encouragement to be active (SR): 4.2 (0.7), 3.0 – 5.6 Teacher enjoying being a PA role model (SR): 3.9 (0.6), 2.7 – 5.4 *O = directly observed behaviors; SR = self-reported behaviors
Table 7: Effects of individual outdoor environment items on children’s MVPA
Item Mean MVPA (minutes/hour)
Shaded area with room for most children in a class No (n=11)
Yes (n=37)
10.34 10.51 Presence of garden in the play space
No (n=37) Yes (n=12)
10.56 10.34 Variety of natural features in the play space
1st quartile (response range: 0 – 1.00) 2nd quartile (response range: 1.01 – 2.00) 3rd quartile (response range: 2.01 – 3.00) 4th quartile (response range: 3.01 – 6.00)
10.37 11.34 10.02 10.66 Variety of fixed play equipment available
1st quartile (response range: 0.00 – 5.52) 2nd quartile (response range: 5.53 – 6.80) 3rd quartile (response range: 6.81 – 8.50) 4th quartile (response range: 8.51 – 11.00)
10.30 9.91 10.40 11.42 Variety of portable play equipment available
1st quartile (response range: 1.80 – 4.90) 2nd quartile (response range: 4.91 – 5.95) 3rd quartile (response range: 5.96 – 7.60) 4th quartile (response range: 7.61 – 10.10)
10.61 10.04 10.63 10.74 Playground density
4th quartile (response range: 263.25 – 1033.09) 3rd quartile (response range: 168.88 – 263.24) 2nd quartile (response range: 101.50 – 168.87) 1st quartile (response range: 35.63 – 101.49)
10.34 10.66 10.39 10.63
Lower 50%: 10.64 Upper 50%: 10.32
Lower 50%: 10.12 Upper 50%: 10.91
Lower 50%: 10.32 Upper 50%: 10.68
Table 8: Effects of individual teacher behaviors on children’s MVPA
Item (O/SR)* Mean MVPA (minutes/hour)
Teachers joining children in PA-promoting activities (O): 0 – 1 (n=17)
1.25 – 2 (n=17) 2.25 – 3.0 (n=10) 3.25 – 5.25 (n=5)
10.12 10.39 11.27 10.68 Teacher verbal encouragement to be active (O):
0.5 – 1 (n=7) 1.25 – 1.75 (n=14) 2 – 2.5 (n=22) 2.75 – 3.5 (n=6)
10.70 9.52 11.06 10.56 Teacher confidence in facilitating PA (SR):
3.67 – 4.5 (n=8) 4.58 – 5 (n=21) 5.06 – 5.42 (n=13) 5.5 – 6.0 (n=7)
9.87 10.75 10.46 10.60 Teacher verbal encouragement to be active (SR):
3 – 3.75 (n=14) 3.81 – 4.21 (n=13) 4.33 – 4.88 (n=17) 5 – 5.63 (n=5)
10.75 10.87 9.92 10.87 Teacher enjoying being a PA role model (SR):
2.65 – 3.25 (n=9) 3.37 – 4.0 (n=20) 4.1 – 4.7 (n=16) 4.8 – 5.4 (n=4)
10.08 10.71 10.43 10.73 *O = directly observed behaviors; SR = self-reported behaviors
Lower ranges: 10.25 Upper ranges: 11.08
Lower ranges: 9.91 Upper ranges: 10.95
Lower ranges: 10.51 Upper ranges: 10.51
Lower ranges: 10.81 Upper ranges: 10.13
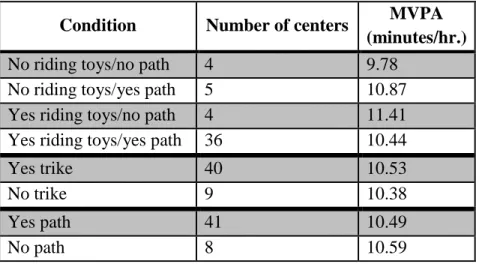
Table 9: The effect of riding toys and riding paths on children’s MVPA per hour
Condition Number of centers MVPA
(minutes/hr.)
No riding toys/no path 4 9.78
No riding toys/yes path 5 10.87
Yes riding toys/no path 4 11.41
Yes riding toys/yes path 36 10.44
Yes trike 40 10.53
No trike 9 10.38
Yes path 41 10.49
No path 8 10.59
The categorical outdoor environment items showed minimal influence on MVPA, and none of the non-categorical outdoor environment items or teacher behaviors exhibited clear relationships with PA; however, there is evidence of effect thresholds or low-high cut points in some cases. In the self-reported teacher confidence in their ability to promote children’s PA, for instance, average MVPA per hour increases dramatically after the first response range; the same occurs in the self-reported question concerning teachers enjoying being a PA role model. In other cases, trends are evident in three of the quartiles or response ranges but are interrupted by the fourth; this is evident with variety of fixed play equipment, variety of portable play equipment, self-reported teacher verbal encouragement to be physically active, and teachers joining children in PA-promoting activities. Furthermore, upper- vs. lower-range comparisons in some cases highlight sharp differences that are not clear from the trend observed by moving across all four response ranges. Thus, clear patterns of association were not observed.
neither riding toys nor paths for riding had the lowest levels of MVPA, on average, while those with riding toys yet no paths or other paved area for using these riding toys demonstrated the highest levels of MVPA per hour. A two-factor ANOVA demonstrated that neither the path condition nor the trike condition led to significant differences in minutes of MVPA per hour, however. Regardless of path availability, centers with riding toys had marginally more MVPA per hour than those without riding toys; regardless of riding toy availability, centers without paths had marginally more MVPA per hour than those with paths. Neither difference was significant according to the Wilcoxon Rank-Sum test.
Table 10: Prediction of children’s MVPA using aspects of the outdoor environment
Item Coefficient P-value 95% CI
Intercept 8.88 0.013 (1.98, 15.78)
Shade -0.14 0.51 (-0.57, 0.29)
Variety: Natural Features -0.07 0.74 (-0.50, 0.36)
Garden -0.15 0.84 (-1.62, 1.32)
Variety: Fixed Play Equipment 0.35 0.14 (-0.13, 0.83)
Riding Toys/Path -0.04 0.87 (-0.51, 0.43)
Variety: Portable Play Equipment 0.05 0.82 (-0.41, 0.51)
Density 0.10 0.45 (-0.35, 0.54)
Age of Children Measured 0.35 0.57 (-0.88, 1.59) % Days >60 Degrees F 0.009 0.20 (-0.005, 0.02)
Staff Education 0.17 0.61 (-0.52, 0.86)
Staff BMI -0.03 0.31 (-0.10, 0.03)
% Girls -0.02 0.24 (-0.05, 0.01)
Time Outside 0.01 0.21 (-0.007, 0.03)
Regression Statistic Value
R 0.50
R2 0.25
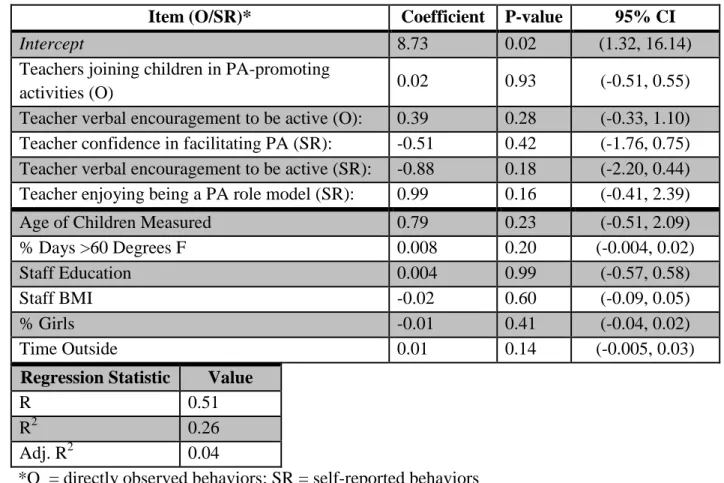
Table 11: Prediction of children’s MVPA using PA-supportive teacher behaviors
Item (O/SR)* Coefficient P-value 95% CI
Intercept 8.73 0.02 (1.32, 16.14)
Teachers joining children in PA-promoting
activities (O) 0.02 0.93 (-0.51, 0.55)
Teacher verbal encouragement to be active (O): 0.39 0.28 (-0.33, 1.10) Teacher confidence in facilitating PA (SR): -0.51 0.42 (-1.76, 0.75) Teacher verbal encouragement to be active (SR): -0.88 0.18 (-2.20, 0.44) Teacher enjoying being a PA role model (SR): 0.99 0.16 (-0.41, 2.39)
Age of Children Measured 0.79 0.23 (-0.51, 2.09)
% Days >60 Degrees F 0.008 0.20 (-0.004, 0.02)
Staff Education 0.004 0.99 (-0.57, 0.58)
Staff BMI -0.02 0.60 (-0.09, 0.05)
% Girls -0.01 0.41 (-0.04, 0.02)
Time Outside 0.01 0.14 (-0.005, 0.03)
Regression Statistic Value
R 0.51
R2 0.26
Adj. R2 0.04
*O = directly observed behaviors; SR = self-reported behaviors
Both models were poor fits to the data. Residual plots for each predictor were examined and confirmed homoscedasticity. Adjusted R2 values were -0.03 and 0.04 for the outdoor
environment model and teacher behaviors model, respectively. None of the outdoor environment items or teacher behaviors achieved statistical significance as part of these multiple regression models, and most had wide confidence intervals, suggesting that high variance within most of the predictors produced imprecise models. Since no individual items from either the outdoor
composed of these items would also be unreliable predictors of PA. For this reason, overall scores for the quality of the outdoor environment and teacher behaviors were not analyzed. To investigate the reliability of the self-reported teacher behaviors in measuring the degree to which teachers foster children’s PA, correlations between self-reported and observed behaviors were examined. The correlation coefficient between the average score of all three self-reported behaviors and the average score of both observed behaviors was 0.29. Teacher verbal encouragement for children to be active was the only teacher behavior that was both observed by research staff and reported by teachers: the correlation between the observed and
DISCUSSION
Overall, the data failed to show that higher overall outdoor environment quality or a greater overall degree of PA-supportive teacher behaviors is associated with increased MVPA in children at child care centers, due to a lack of significant associations between children’s PA and any outdoor environment items or teacher behaviors. While none of the associations were
statistically significant in the multivariable models, some findings from other, more focused analyses do hold practical significance and suggest topics for future studies.
There was little difference in children’s PA between centers with and without a shaded area for most children in a class, but these data do not immediately suggest that shade is an unimportant factor in children’s PA. Because the highest average temperature over all
Children in centers with gardens exhibited 0.22 fewer minutes (about 13 seconds) of MVPA per hour. While this effect is small, it may be indicative of concerns mentioned earlier about the garden taking up space that could otherwise be used for MVPA and eliciting activities that are not conducive to MVPA. This feature deserves further investigation, as a garden that children are allowed to interact with may elicit different levels of MVPA than other types of vegetation.
Natural features in the play space may have a significant effect on children’s PA in ways that were not captured by these data. Observers captured the simple presence of at least one instance of a feature from the list on the EPAO, but there is potential for extreme variability beyond the single instance of a feature. For example, instead of a single tall tree, a center may have an entire wooded area conducive to certain high-intensity activities that children may especially enjoy in the presence of many tall trees. In addition, the various natural features themselves may elicit different levels of physical activity. A tall, unclimbable tree may not elicit nearly as much MVPA as a shorter tree that children can actively climb, for instance. Thus, natural features may vary in both degrees of their presence and in the kind of responses they can elicit. The nature of the data from this study do not allow for the disentanglement of PA
attributable to each type of natural feature, however, but a future study with such an analysis may highlight an important role for natural features.
accelerometers were worn) due to the sitting posture may have prevented the accelerometer from detecting the appropriate vigor of this activity.
Previous work by Parish et al.22 and similar studies have suggested an increase in children’s PA when teachers join children in structured activities designed to increase PA, but this study’s observations suggest that this teacher behavior rarely occurs and, when it does occur, is ineffective at increasing children’s PA. Table 6 suggests that the average teacher in this study used fewer than two opportunities to join children in PA-promoting activities; given the data in Table 11, this behavior had almost no effect on activity even when it did occur. This result is unexpected, but the EPAO questions used to capture this behavior may not have been specific enough: only the EPAO item specifying that the activity is a chasing or running game mandates that the activity involved be PA-promoting.
This study has several limitations in addition to those mentioned previously. First of all, the creation of reliable models to predict children’s MVPA in this study was heavily dependent on the accurate incorporation of each individual item into multivariable models, and the
simplification of centers’ outdoor environment items with non-categorical outcomes into quartiles likely affected the precision of the data. Secondly, social interactions among children were not observed in this study, and this has been shown to be influential on children’s PA.29
Also, questions measuring variety of portable play equipment and fixed play equipment may not have accurately reflected the availability of items for children to use: the presence of at least one of each type of item was recorded, but the quantities of items were not. As a result, centers with large amounts of children on the playground may have a high variety of portable play equipment or fixed play equipment, yet not enough available for most children to use at any given time, causing children to wait for equipment to become available. Likewise, because the two observed teacher behaviors each represented the occurrence of three behavioral variants during two parts of the day (both before and after the children nap), teachers may have performed a PA-promoting behavior multiple times in a single part of the day but would have received credit for only one occurrence, since the behavior was not performed in the other part of the day. In this way, the “variety” of teacher behaviors performed was recorded rather than the quantity. Finally, the total number of children in the outdoor environment during outdoor play was not measured, so density was estimated by using each center’s total enrollment of 3-5 year olds. Depending on how
centers divide outdoor play time among all classes, this may not be an accurate estimator of the number of children on the playground.
examined teacher behaviors have tended to examine overall quality only, this analysis went further by investigating the differential impacts of various types of teacher behaviors.
Furthermore, the analysis included data collected both observationally and via teacher-completed questionnaires, allowing for a more complete characterization of teacher behaviors as well as insight into the validity of self-reported data on this subject. In the outdoor environment, a wide variety of features were examined, including both tangible and intangible features. Finally, the amount of data used in this analysis was extensive, comprised of four consecutive
administrations of the EPAO instrument, two questionnaire administrations, and four days of accelerometer data. The compilation of these numerous objective measurements yielded an amount of data that few studies of this type have matched.
REFERENCES
1. Flegal, K. M., Carroll, M. D., Kit, B. K., & Ogden, C. L. (2012). Prevalence of obesity and trends in the distribution of body mass index among US adults, 1999-2010. JAMA, 307(5), 491–497. doi: 10.1001/jama.2012.39
2. US Department of Health and Human Services. (2001). The Surgeon General’s call to action to prevent and decrease overweight and obesity. Rockville, MD: Office of the Surgeon General. Retrieved from http://www.surgeongeneral.gov/library/calls
3. Ogden, C. L., Carroll, M. D., Kit, B. K., & Flegal, K. M. (2014). Prevalence of childhood and adult obesity in the United States, 2011-2012. JAMA, 311(8), 806-814.
doi:10.1001/jama.2014.732
4. Guo, S. S., Wu, W., Chumlea, W. C., & Roche, A. F. (2002). Predicting overweight and obesity in adulthood from body mass index values in childhood and adolescence. American Journal of Clinical Nutrition, 76(3), 653-658.
5. Wang, Y., & Beydoun, M. A. (2007). The obesity epidemic in the United States—gender, age, socioeconomic, racial/ethnic, and geographic characteristics: a systematic review and meta-regression analysis. Epidemiologic Reviews, 29(1), 6-28. doi:10.1093/epirev/mxm007 6. Dietz, W. H. (1998). Health consequences of obesity in youth: childhood predictors of adult
disease. Pediatrics, 101(1), 518-525. Retrieved from
http://pediatrics.aappublications.org/content/101/Supplement_2/518.full.html
7. Dietz, W. H., & Robinson, T. N. (2005). Overweight children and adolescents. N Engl J Med, 352, 2100-2109. doi:10.1056/NEJMcp043052
8. Hill, J. O., & Melanson, E. L. (1999). Overview of the determinants of overweight and obesity: Current evidence and research issues. Medicine & Science in Sports & Exercise, 31(11), 515-521.
9. Kaplan, M. S., Huguet, N., & McFarland, B. H. (2004). The association between length of residence and obesity among Hispanic immigrants. American Journal of Preventive Medicine, 27(4), 323-326. doi:http://dx.doi.org/10.1016/j.amepre.2004.07.005
10.Ferreira, S., Lerario, D., Gimeno, S., & Sanudo, A. (2002). Obesity and central adiposity in Japanese immigrants: role of the western dietary pattern. Journal of Epidemiology, 12(6), 431-438. doi:http://dx.doi.org/10.2188/jea.12.431
12.Brown, T., Kelly, S., & Summerbell, C. (2007). Prevention of obesity: a review of interventions. Obesity Reviews, 8(1), 127-130. doi:10.1111/j.1467-789X.2007.00331.x. 13.Mamedova, S., & Redford, J. (2013). Early childhood program participation, from the
national household education surveys program of 2012. National Center for Education Statistics, Institute of Education Sciences, U.S. Department of Education. Retrieved from http://nces.ed.gov/pubs2013/2013029.pdf
14.Iruka, I. U., & Carver, P. R. (2006). Initial results from the 2005 NEHS early childhood program participation survey. National Center for Education Statistics, U.S. Department of Education. Retrieved from http://nces.ed.gov/pubs2006/2006075.pdf
15.Beets, M. W., Bornstein, D., Dowda, M., & Pate, R. R. (2011). Compliance with national guidelines for physical activity in u.s. preschoolers: measurement and interpretation. American Academy of Pediatrics, 127(4), 658-664. doi:10.1542/peds.2010-2021
16.Gubbels, J. S., Kremers, S. P., Van Kann, D. H., Stafleu, A., Candel, M. J., Dagnelie, P. C., Thijs, C., De Vries, N. K. (2011). Interaction between physical environment, social
environment, and child characteristics in determining physical activity at child care. Health Psychology, 30(1), 84-90. doi:10.1037/a0021586
17.Trost, S. G., Ward, D. S., & Senso, M. (2010). Effects of child care policy and environment of physical activity. Medicine & Science in Sports & Exercise, 42(3), 520-525.
doi:10.1249/MSS.0b013e3181cea3ef
18.Broekhuizen, K., Scholten, A. M., & de Vries, S. (2014). The value of (pre)school
playgrounds for children’s physical activity level: a systematic review. Int J Behav Nutr Phys Act, 11(59). doi:10.1186/1479-5868-11-59
19.Copeland, K. A., Kendeigh, C. A., Saelens, B. E., Kalkwarf, H. J., & Sherman, S. N. (2012). Physical activity in child-care centers: do teachers hold the key to the playground? Health Education Research, 27(1), 81-100. doi:10.1093/her/cyr038
20.Cosco, N. G., Moore, R. C., & Smith, W. R. (2014). Childcare outdoor renovation as a built environment health promotion strategy: evaluating the preventing obesity by design
intervention. American Journal of Health Promotion, 28(3), 27-32. doi:10.4278/ajhp.130430-QUAN-208.
21.Cardon, G., Van Cauwenberghe, E., Labarque, V., Haerens, L., & De Bourdeaudhuij, I. (2008). The contribution of preschool playground factors in explaining children's physical activity during recess. International Journal of Behavioral Nutrition and Physical Activity, 5(11). doi:10.1186/1479-5868-5-11
22.Parish, L. E., Rudisill, M. E., & St. Onge, P. M. (2007). Mastery motivational climate: influence on physical play and heart rate in African American toddlers. Research Quarterly for Exercise and Sport, 78(3), 171–178. doi:10.1080/02701367.2007.10599414
24.Copeland, K. A., Sherman, S. N., Kendeigh, C. A., Kalkwarf, H. J., & Saelens, B. E. (2012). Societal values and policies may curtail preschool children’s physical activity in child care centers. Pediatrics, 1-10. doi:10.1542/peds.2011-2102
25.De Craemer, M., De Decker, E., De Bourdeaudhuij, I., Deforche, B., Vereecken, C.,
Duvinage, K., Grammatikaki, E., Iotova, V., Fernandez-Alvira, J. M., Zych, K., Manios, Y., Cardon, G. (2013). Physical activity and beverage consumption in preschoolers: focus groups with parents and teachers. BMC Public Health, 13(278). doi:10.1186/1471-2458-13-278 26.Fjørtoft, I. (2001). The natural environment as a playground for children: the impact of
outdoor play activities in pre-primary school children. Early Childhood Education Journal, 29(2), 111–117. doi:10.1023/A:1012576913074
27.Nicaise, V., Kahan, D., & Sallis, J. F. (2011). Correlates of moderate-to-vigorous physical activity among preschoolers during unstructured outdoor play periods. Preventive Medicine, 53(4-5), 309–315. doi:10.1016/j.ypmed.2011.08.018
28.Boldemann, C., Blennow, M., Dal, H., Martensson, F., Raustorp, A., Yuen, K. , & Wester, U. (2006). Impact of preschool environment upon children's physical activity and sun exposure. Preventive Medicine, 42(4), 301-308. doi:10.1016/j.ypmed.2005.12.006