INTERSECTIONAL STEREOTYPES IN POLICING: AN ANALYSIS OF TRAFFIC STOP OUTCOMES
Leah R. Christiani
A thesis submitted to the faculty of the University of North Carolina at Chapel Hill in partial fulfillment of the requirements for the degree of Master of Arts in the Department of Political Science, concentration in American Politics.
Chapel Hill 2017
Approved by:
ABSTRACT
LEAH R. CHRISTIANI: Intersectional Stereotypes in Policing: An Analysis of Traffic Stop Outcomes
(Under the direction of Frank R. Baumgartner.)
TABLE OF CONTENTS
LIST OF TABLES . . . v
LIST OF FIGURES . . . vii
INTRODUCTION . . . 1
APPENDIX . . . 31
Appendix A: Descriptive Statistics . . . 31
Appendix B: Predicted Probabilities . . . 34
Appendix C: Ohio Robustness Checks . . . 38
Appendix D: Difference of Means Tests . . . 41
LIST OF TABLES
Table
1 States and Years Included in Analysis . . . 9
2 Search Rates across States . . . 11
3 Contraband Hit Rates across States . . . 12
4 Logistic Regression Results for Searches . . . 13
5 Logistic Regression Results for Searches, with Interaction Term . . . 14
6 Predicted Probabilities of Search, Point Estimates . . . 15
7 Logistic Regression Results for Fruitless Searches . . . 23
8 Predicted Probabilities of Fruitless Search, Point Estimates . . . 24
9 Connecticut Descriptive Statistics . . . 31
10 Illinois Descriptive Statistics . . . 31
11 Maryland Descriptive Statistics . . . 32
12 North Carolina Descriptive Statistics . . . 32
13 Ohio Descriptive Statistics . . . 33
14 Texas Descriptive Statistics . . . 33
15 Connecticut Predicted Probability of Search . . . 34
16 Illinois Predicted Probability of Search . . . 34
17 Maryland Predicted Probability of Search . . . 35
18 North Carolina Predicted Probability of Search . . . 35
19 Ohio Predicted Probability of Search . . . 35
20 Texas Predicted Probability of Search . . . 36
21 Connecticut Predicted Probability of Fruitless Search . . . 36
22 Maryland Predicted Probability of Fruitless Search . . . 36
23 North Carolina Predicted Probability of Fruitless Search . . . 37
25 Texas Predicted Probability of Fruitless Search . . . 37
26 Ohio: Logistic Regressions Estimating Searches . . . 39
27 Ohio: Logistic Regressions Estimating Fruitless Searches . . . 40
28 Difference in Means Tests for Predicted Probabilities of Search . . . 41
LIST OF FIGURES
Figure
1 Predicted Probabilities of Search . . . 18
2 Illinois 2014: Predicted Probabilities of Search over Vehicle Age . . . 20
3 Texas 2016: Predicted Probabilities of Search over Vehicle Age . . . 21
INTRODUCTION
Law enforcement has increasingly come under scrutiny amidst charges of police vio-lence, racial profiling, and implicit bias. The organization Black Lives Matter has spear-headed a mass movement against these practices. In response, the term “Blue Lives Matter” has emerged to indicate support of law enforcement. In such a politically charged environ-ment, it can be difficult to assess the validity of claims that the police treat individuals differently, in a racially-biased way.
In this paper, I argue that outcomes of police-citizen interactions, when analyzed through an intersectional framework, can highlight a variety of stereotypes that are preva-lent in society and operate to produce different outcomes for individuals, based on their perceived identities. Rather than a simple White/Black or White/minority dichotomy that charges of racial profiling typically take, I explore outcomes that individuals experience from their interactions with police based on multiple identities. Further, I seek to attribute this phenomenon to widely held stereotypes about groups, rather than to individually racist police officers. Social groups that are viewed as more suspicious will receive the harshest treatment from police, while those who are not considered suspicious will receive lighter treatment, in the aggregate.
contraband hits should be equal across racial groups. However, as we will see, this is not the case in any state.
I argue that the variance observed in vehicle searches that result from traffic stops, when controlling for a variety of situational factors, demonstrates the concrete consequences that result from the multiplicity of group stereotypes that exist in our society. Drivers who be-long to groups that are seen as more suspicious, such as poor Black males, will receive harsher dispositions from traffic stops, without the comparable contraband hit rates that some argue would justify such treatment. Asian and female drivers with newer cars, mem-bers of groups stereotyped as more law-abiding and less suspicious, will be less likely to be searched when they are stopped, and more likely to be found with contraband when they are searched, because the threshold of suspicion required to conduct that search is higher. Considering intersectional identities, Black females, who belong to a non-suspicious group (female) and a suspicious group (Black) will experience harsher treatment than White fe-males, who belong to two non-suspicious groups, but will receive lighter treatment than their Black males. Socioeconomic class will then complicate this relationship further.
Previous studies that have focused on racial profiling have typically examined a White/Black or White/minority dichotomy when analyzing the outcomes that drivers experience. In this paper, I extend that analysis to multiple racial, gender, and class-based groups for a more comprehensive examination of prejudice and group positioning in American society.
Applying Intersectionality to Traffic Stops
Group Position
this paper, I conceive of racial prejudice as a result of the structure of race relations in our society that positions some groups as more advantaged and other groups as less advantaged, rather than a collection of individual racist attitudes (Blumer 1958; Kim 2003; Bobo and Hutchings 1996).
Claire Jean Kim further argues that society is not organized as a linear hierarchy, such that minority groups are lined up by their varying degrees of privilege and subjugation. It would not be possible to construct a linear representation of the position of groups be-cause race and group position are not static and bebe-cause the advantages, disadvantages, and stereotypes that groups face are multiplicative and multi-dimensional. This is not to say that the position of groups is random - there are groups that are consistently privileged and those that are consistently subjugated. But, the manner and degree of those privileges and subjugations can vary based on situational factors. Instead of a linear hierarchy, Kim ar-gues that the racial structure of our society is better represented as a plane structured by two axes: that of inferior versus superior and that of insider versus outsider, as opposed to most models which only consider the inferior-superior dimension. This allows Kim to analyze relations between minority groups and account for the variety of ways that privilege and subjugation operate in society (Kim 2003).
1991; Harris-Perry 2011; Hancock 2004).
Applying intersectionality to Kim’s plane, then, allows identities like gender and class to impact the position of groups on the plane, in addition to race. For example, Whites who are poor would not experience the same kind of privilege that Whites who are wealthy would. This application of class would mediate the position of this particular group of Whites on the plane, as it would depress their position on the inferior-superior axis of the plane. Gender would similarly mediate the position of groups on the plane and thus the relative advantages or disadvantages experienced. The intersectional identities of individuals, I argue, influence concrete realities that they experience, including outcomes of police-citizen interactions.
Stereotypes of Suspicion
While we cannot know the factors that influence the decision of a police officer to search a car, we can assume that suspicion plays a role. When a car or driver is perceived as suspicious, the officer may be more likely to search that car. However, from research on stereotyping, we also know that certain groups are stereotyped to possess characteristics that invoke suspicion more readily than others.
African Americans, for example, have been stereotyped as linked with crime and crimi-nality (Gilliam Jr and Iyengar 2000; Welch 2007). Welch (2007) argues that the pervasion of such stereotyping often results in the use of “criminal predator” as a euphemism for “young Black male” (Welch 2007). This stereotype would invoke suspicion, as it is the police offi-cer’s role to seek out and eradicate crime. In fact, previous studies on racial profiling have shown that there is bias against African Americans, especially African American males, in policing (Gross and Livingston 2002; Harris 1999, 2003; Meehan and Ponder 2002; Welch 2007). Stereotypes of criminality may be playing a role in this targeting. Studies have dis-proportionately focused on the treatment of African American males by police, likely due to their harsher treatment than other groups. However, I argue that intersectionality can point our focus to the effect that stereotypes can have on other racial, gender, and class groups as well, in their interactions with the police.
The studies that do exist suggest that police-citizen interactions within the Hispanic com-munities are tense and that police do use aggressive tactics and targetted practices against these communities (Solis, Portillos and Brunson 2009; Larrabee 1997). The social psychol-ogy literature on stereotypes of Hispanics suggests that stereotypes often center on the low competence of the group and a low warmth toward them. Further, individuals from His-panic backgrounds may be stereotyped as migrant workers or undocumented immigrants (Lee and Fiske 2006). This affiliation of all Hispanics with undocumented immigrants may evoke suspicion for police officers. While Blacks may be presumed to be criminals, Hispan-ics may be presumed to be undocumented immigrants. Both stereotypes result in suspicion and may lead to a desire to search the car.
Intersectionally, there are also gender stereotypes to consider. Women are more likely to be thought of as gentle, caretaking, warm, and motherly than men (Fineman 1995; Luker 1984; Huddy and Terkildsen 1993; Lee and Fiske 2006). Women are generally stereotyped in ways associated with the homemaker trope (Lee and Fiske 2006). While these stereotypes are harmful and produce negative consequences in a variety of contexts, they do not evoke suspicion. Thus, I expect that female drivers will be less likely to be targetted for searches than their male counterparts, within racial groups.
Of course, considering the intersectional identities of Black and Hispanic women, it may be expected that Black and Hispanic women will not receive the same treatment as White women. White women have largely been stereotyped as victims in a way that Black and Hispanic women have not (Harris-Perry 2011; Moraga and Anzald´ua 2015). Black and Hispanic women are more likely to experience negative stereotyping than White women, due to their race. Further, it has even been demonstrated that women with lighter skin tones are more likely to experience lenient treatment in the criminal justice system than those with darker skin (Viglione, Hannon and DeFina 2011). As a result, I expect that Black and Hispanic female drivers will experience harsher treatment, more searches, than White females.
a way that justifies the individualistic notion that if you work hard, you can be successful in America (Kim 2003; Wong, Lai, Nagasawa and Lin 1998; Taylor and Stern 1997; Lee and Fiske 2006). While this stereotype is damaging and, like all stereotypes, reduces the narra-tive about a group to a single story, this stereotype does not evoke suspicion. As a model minority, Asian Americans are seen as a group that works hard and plays by the rules, espe-cially compared to other racial minority groups like Blacks and Hispanics. Further, Asian American men in particular tend to be emasculated and stereotyped as feminine (Eng 2001; Chua and Fujino 1999). This positioning of Asian American men as anti-masculine, thus puts Asian Americans, men and women alike, into a non-suspicious category, and as a re-sult I expect that Asian Americans will receive more lenient treatment, in the aggregate, than other minority groups.
Finally, there are class-based stereotypes to consider. Stereotypes are often not solely dependent on race or national origin, but socioeconomic status as well (Lee and Fiske 2006). Fiske, Cuddy, Glick, and Xu demonstrate that stereotypes about wealthy Blacks and poor Blacks, for example, differ dramatically (Fiske, Cuddy, Glick and Xu 2002). Stereotypes of poverty are often linked with race, as Blacks are seen as impoverished, and vice versa. Me-dia portrayals of the lower class often associate it with criminality, drug use, and pathologi-cal behavior (Clawson and Trice 2000). Such stereotypes evoke suspicion, as individuals in the lower class are thought to be involved with illicit activity. For this project, I use vehicle age as a proxy for class. While not a perfect measure, I expect individuals with greater wealth to possess newer cars than those with less wealth, on average. So, I expect individ-uals in older cars to be perceived as more suspicious and thus more likely to be searched than those in newer cars. Intersectionally, I do not have expectations about how class will interact with race and gender. It is possible that because Blacks and Hispanics are already perceived as suspicious, class may not play a large role in generating suspicion, as such suspicion is already present. However, it is also possible that class compounds race in a way that results in even harsher treatment by police.
driver:
H1: Black and Hispanic male drivers are more likely to be searched during traffic stops,
compared with other races and genders
H2: Female drivers are less likely to be searched during traffic stops, as compared with
their male, within-race counterparts
H3: Black and Hispanic female drivers are more likely to be searched during traffic stops,
compared to White females
H4: Asians are less likely to be searched during traffic stops, compared with other
minori-ties
H5: Drivers with older cars are more likely to be searched during traffic stops, compared
to those with newer cars
Analyzing the outcome of the search may allow for a better understanding of the mech-anism operating in the decision of whether or not to search an individual. Because I argue that certain groups are more likely to be targeted due to stereotypes about their group rather than warranted suspicion, the outcome of the search may shed light on whether dispropor-tionate search rates are warranted or not. If Blacks and Hispanics are searched at higher rates, for example, but their contraband hit rates are similar to those of other groups, then the higher search rates are warranted: the police are right to be suspicious as contraband is frequently found. However, if those searches are solely based on group stereotypes, the contraband hit rates should be lower than those of other groups. Thus, the next set of hy-potheses mirror the first set. Those groups that are more likely to be searched are also less likely to be found with contraband. I use the term “fruitless searches” to refer to searches that do not result in contraband.
H6: Black and Hispanic male drivers are more likely to experience fruitless searches during
traffic stops, compared with other races and genders
H7: Female drivers are less likely to experience fruitless searches during traffic stops, as
compared with their male, within-race counterparts
during traffic stops, compared to White females
H9: Asian Americans are less likely to experience fruitless searches during traffic stops,
compared with other minorities
H10: Drivers with older cars are more likely to experience fruitless searches during traffic
stops, compared to those with newer cars
Data and Methods
To answer these questions, I turn to an original dataset of police traffic stops collected with the support of Frank Baumgartner. For this particular project, I focus on datasets we received from Connecticut, Illinois, Maryland, North Carolina, Ohio, and Texas.1 The
states, years, and agencies included are listed in Table 1. These datasets are composed of every individual traffic stop that occurred in the timeframe listed. The Ohio and Texas data come from their state highway patrol units, and thus do not include every agency like the other states. The datasets from Illinois, North Carolina, and Texas include more years than those listed in Table 1. I am working on extending my analysis to every year as well, but experienced computational issues due to the size of the datasets. As a result, only a subset is included in this paper. While the full size is not yet there, Table 1 demonstrates that my sample size is large, at over 15 million stops, allowing for robust tests of my hypotheses. Further, the states included in my analysis range in size and geographic location, providing a comprehensive analysis of traffic stops in the United States.
Every dataset includes, at a minimum, the race and gender of the driver stopped and whether or not the driver was searched. Beyond that, there is variation in what is recorded. Every state except Texas records the stop purpose, which allows me to control for why the driver was stopped. These reasons vary from state to state, but are aggregated into registration, equipment, or moving violations. Connecticut, Maryland, and Texas include whether or not the driver was from out of state, allowing me to control for explanations that
1I exclude the dataset from Vermont due to the small sample size of minority stops. I also exclude the
the driver was suspicious because they were perceived as an outsider. Every dataset except Ohio and Texas allow me to control for the age of the driver stopped. Every dataset allows me to control for hour of the day, day of the week, and year.
Table 1:States and Years Included in Analysis
State Agency Years Sample Size
Connecticut All 10/1/2013 - 9/30/2015 857,923
Illinois All 2014 2,043,247
Maryland All 2012-2016 (complete after 2012) 2,854,963
North Carolina All 2015-2016 2,803,230
Ohio Highway Patrol 2011-2015 5,201,818
Texas DPS 2016 1,853,474
Total N 15,614,655
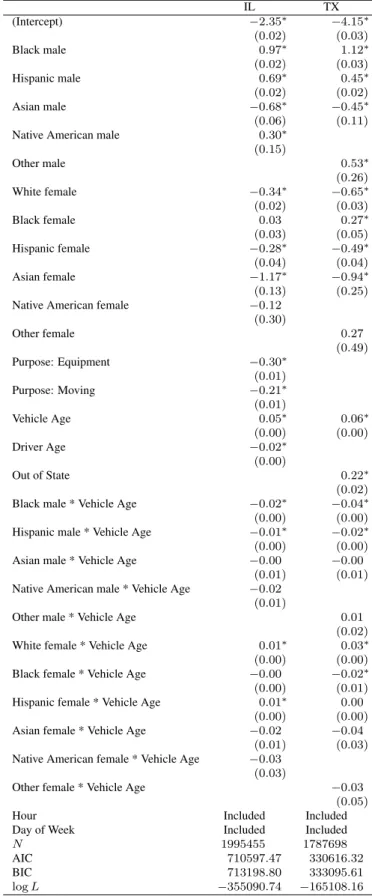
For my independent variables, I use the race and gender of the driver in every analysis. While the type of racial groups vary from state to state, every one includes the categories of White, Black, Hispanic, and Asian. Connecticut additionally includes Middle Eastern as a category. Every state also collects data on Native Americans but in Texas, this category had to be collapsed into the racial group “Other” because the sample size was too low and as a result, the model was overfitting the data. Texas and Illinois collect data on the age of the vehicle stopped, so I am able to use vehicle age as a proxy for class in those analyses. I interact vehicle age with race and gender, following my intersectional hypotheses.
My dependent variable is whether or not the vehicle was searched, which is a binary variable coded 0,1. For my fruitless search hypotheses, I created a variable that is coded 1 if the driver is searched and there is no contraband found. It is coded 0 if the driver is not searched or if the driver is searched and contraband is found. Illinois is exempted from this analysis because in 2014, they had stopped collecting data on contraband found during traffic stops.
bias that may emerge from the fact that some demographic groups drive more frequently and populate certain areas more than others. The analysis in this paper focuses on the resulting outcome for drivers once a stop is made, controlling for a variety of situational factors. I contend that bias in policing emerges once the officer stops an individual, and that the resulting outcome will demonstrate stereotypes about suspicion that are prevalent in society.
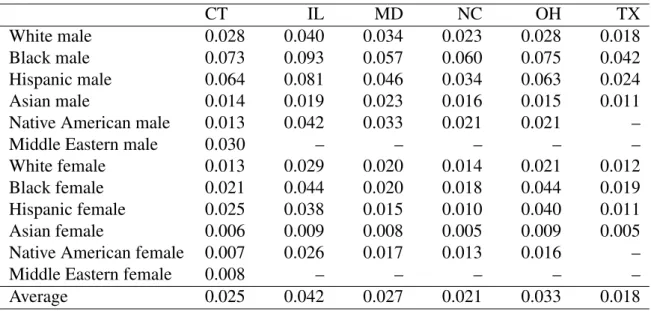
Before I present results from my regression, Table 2 and 3 report search rates and con-traband hit rates across race/gender categories for every state. These are just the rates, but here we do see trends emerge. The average search rate is about 3%. Searches are not common. However, within that, we do see meaningful differences across race/gender cate-gories. While the search rate for White males ranges from 1.8% - 4.0%, the average search rate for Black males ranges from 4.2%-9.3%, a dramatically higher upper and lower bound. Hispanic males have more variance in their search rates, ranging from 2.4% to 8.1%. Black and Hispanic males are searched much more frequently than White males. Asian males have even lower search rates than Whites, ranging from 1.1%-2.3%. Females have lower average search rates than males, but race mediates these rates and a similar pattern emerges. Black females (1.8-4.4%) and Hispanic females (1.0-4.0%) have higher search rates, on av-erage, than Whites (1.2-2.9%) and Asian (0.5-0.9%), with Asian females searched the least frequently.
Hispanics, that of Asians, suggesting that Blacks and Hispanics may be perceived as more suspicious on average, without a corresponding increase in the rate of contraband found. Females have higher contraband hit rates than males, with White females having higher rates (31.8-56.9%) than Black (27.4-53.9%) or Hispanic females (24.1-41.8%). Asian fe-males frequently could not be analyzed as a result of their low sample size. Female drivers tend to have higher contraband hit rates than males, suggesting the threshold for searching females is higher than that for males. The higher contraband hit rates for White females indicates that their search threshold is higher than that of Blacks or Hispanics, who may be perceived as more suspicious due to their race.
From the search and contraband hit rates presented in their raw form, there is suggestion that my hypotheses about identity and suspicion may have some merit. However, further analysis follows that models these processes and controls for a variety of situational factors.
Table 2:Search Rates across States
CT IL MD NC OH TX
White male 0.028 0.040 0.034 0.023 0.028 0.018
Black male 0.073 0.093 0.057 0.060 0.075 0.042
Hispanic male 0.064 0.081 0.046 0.034 0.063 0.024
Asian male 0.014 0.019 0.023 0.016 0.015 0.011
Native American male 0.013 0.042 0.033 0.021 0.021 –
Middle Eastern male 0.030 – – – – –
White female 0.013 0.029 0.020 0.014 0.021 0.012
Black female 0.021 0.044 0.020 0.018 0.044 0.019
Hispanic female 0.025 0.038 0.015 0.010 0.040 0.011
Asian female 0.006 0.009 0.008 0.005 0.009 0.005
Native American female 0.007 0.026 0.017 0.013 0.016 –
Middle Eastern female 0.008 – – – – –
Average 0.025 0.042 0.027 0.021 0.033 0.018
Table 3:Contraband Hit Rates across States
CT MD NC OH TX
White male 0.420 0.353 0.401 0.001 0.549
Black male 0.327 0.311 0.401 0.001 0.540
Hispanic male 0.298 0.227 0.330 0.001 0.399
Asian male 0.417 0.291 0.352 0.001 0.493
Native American male – 0.239 0.383 – –
Middle Eastern male 0.305 – – – –
White female 0.372 0.345 0.318 0.001 0.569
Black female 0.274 0.291 0.378 0.001 0.539
Hispanic female 0.290 0.241 0.362 0.000 0.418
Asian female – 0.252 – 0.000 –
Native American female – – 0.377 – –
Middle Eastern female 0.261 – 0.377 – –
Average 0.330 0.283 0.368 0.001 0.501
Note:Contraband hit rates only calculated for race/gender categories in which there were at least 100 total searches. Illinois excluded because it does not collect data on contraband in 2014.
Analysis and Findings
Searches
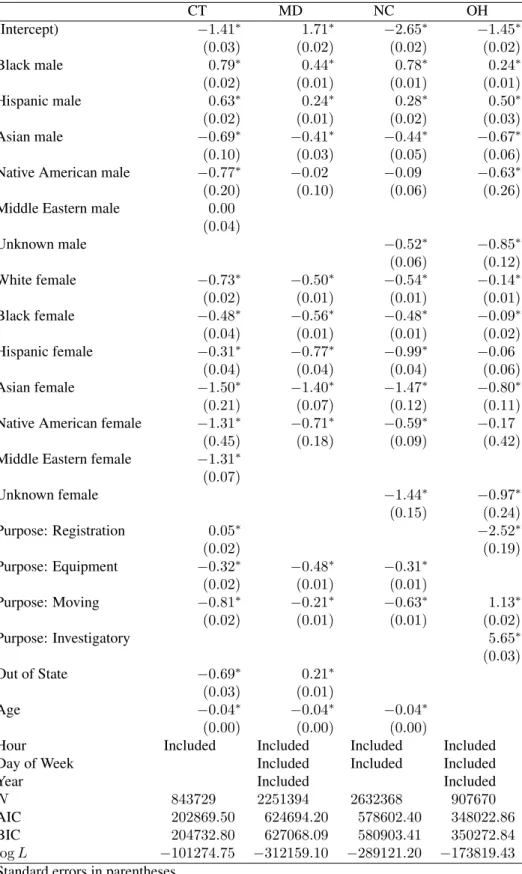
I first analyze searches by estimating logistic regressions for each state. My dependent variable is an indicator for whether or not a driver’s car was searched. Every state collects different data and as a result, has a different logistic regression that is specific to the data collected. When possible, the following model is estimated:
Search∼race gender + stop purpose + vehicle age + race gender*vehicle age + out of state + driver age + hour of day + day of week + year +i
Table 4:Logistic Regression Results for Searches
CT MD NC OH
(Intercept) −1.41∗ 1.71∗ −2.65∗ −1.45∗
(0.03) (0.02) (0.02) (0.02)
Black male 0.79∗ 0.44∗ 0.78∗ 0.24∗
(0.02) (0.01) (0.01) (0.01)
Hispanic male 0.63∗ 0.24∗ 0.28∗ 0.50∗
(0.02) (0.01) (0.02) (0.03)
Asian male −0.69∗ −0.41∗ −0.44∗ −0.67∗
(0.10) (0.03) (0.05) (0.06)
Native American male −0.77∗ −0.02 −0.09 −0.63∗ (0.20) (0.10) (0.06) (0.26)
Middle Eastern male 0.00 (0.04)
Unknown male −0.52∗ −0.85∗
(0.06) (0.12)
White female −0.73∗ −0.50∗ −0.54∗ −0.14∗ (0.02) (0.01) (0.01) (0.01)
Black female −0.48∗ −0.56∗ −0.48∗ −0.09∗ (0.04) (0.01) (0.01) (0.02)
Hispanic female −0.31∗ −0.77∗ −0.99∗ −0.06 (0.04) (0.04) (0.04) (0.06)
Asian female −1.50∗ −1.40∗ −1.47∗ −0.80∗ (0.21) (0.07) (0.12) (0.11)
Native American female −1.31∗ −0.71∗ −0.59∗ −0.17 (0.45) (0.18) (0.09) (0.42)
Middle Eastern female −1.31∗ (0.07)
Unknown female −1.44∗ −0.97∗
(0.15) (0.24)
Purpose: Registration 0.05∗ −2.52∗
(0.02) (0.19)
Purpose: Equipment −0.32∗ −0.48∗ −0.31∗ (0.02) (0.01) (0.01)
Purpose: Moving −0.81∗ −0.21∗ −0.63∗ 1.13∗ (0.02) (0.01) (0.01) (0.02)
Purpose: Investigatory 5.65∗
(0.03)
Out of State −0.69∗ 0.21∗
(0.03) (0.01)
Age −0.04∗ −0.04∗ −0.04∗
(0.00) (0.00) (0.00)
Hour Included Included Included Included
Day of Week Included Included Included
Year Included Included
N 843729 2251394 2632368 907670
AIC 202869.50 624694.20 578602.40 348022.86
BIC 204732.80 627068.09 580903.41 350272.84 logL −101274.75 −312159.10 −289121.20 −173819.43
Standard errors in parentheses
Table 5:Logistic Regression Results for Searches, with Interaction Term
IL TX
(Intercept) −2.35∗ −4.15∗
(0.02) (0.03)
Black male 0.97∗ 1.12∗
(0.02) (0.03)
Hispanic male 0.69∗ 0.45∗
(0.02) (0.02)
Asian male −0.68∗ −0.45∗
(0.06) (0.11)
Native American male 0.30∗
(0.15)
Other male 0.53∗
(0.26)
White female −0.34∗ −0.65∗
(0.02) (0.03)
Black female 0.03 0.27∗
(0.03) (0.05)
Hispanic female −0.28∗ −0.49∗
(0.04) (0.04)
Asian female −1.17∗ −0.94∗
(0.13) (0.25)
Native American female −0.12
(0.30)
Other female 0.27
(0.49)
Purpose: Equipment −0.30∗
(0.01)
Purpose: Moving −0.21∗
(0.01)
Vehicle Age 0.05∗ 0.06∗
(0.00) (0.00)
Driver Age −0.02∗
(0.00)
Out of State 0.22∗
(0.02) Black male * Vehicle Age −0.02∗ −0.04∗
(0.00) (0.00)
Hispanic male * Vehicle Age −0.01∗ −0.02∗
(0.00) (0.00)
Asian male * Vehicle Age −0.00 −0.00
(0.01) (0.01)
Native American male * Vehicle Age −0.02 (0.01)
Other male * Vehicle Age 0.01
(0.02)
White female * Vehicle Age 0.01∗ 0.03∗
(0.00) (0.00)
Black female * Vehicle Age −0.00 −0.02∗
(0.00) (0.01)
Hispanic female * Vehicle Age 0.01∗ 0.00
(0.00) (0.00)
Asian female * Vehicle Age −0.02 −0.04
(0.01) (0.03)
Native American female * Vehicle Age −0.03 (0.03)
Other female * Vehicle Age −0.03
(0.05)
Hour Included Included
Day of Week Included Included
N 1995455 1787698
AIC 710597.47 330616.32
BIC 713198.80 333095.61
logL −355090.74 −165108.16
Standard errors in parentheses
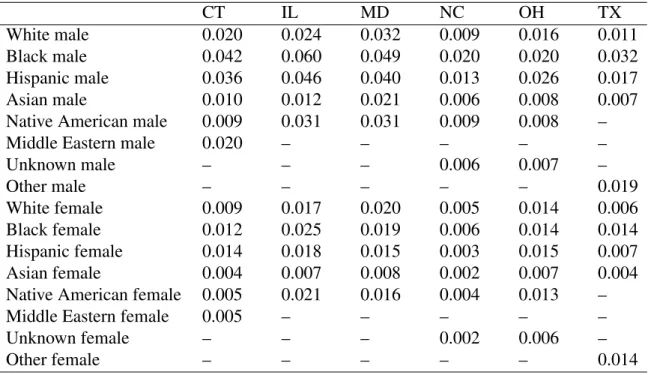
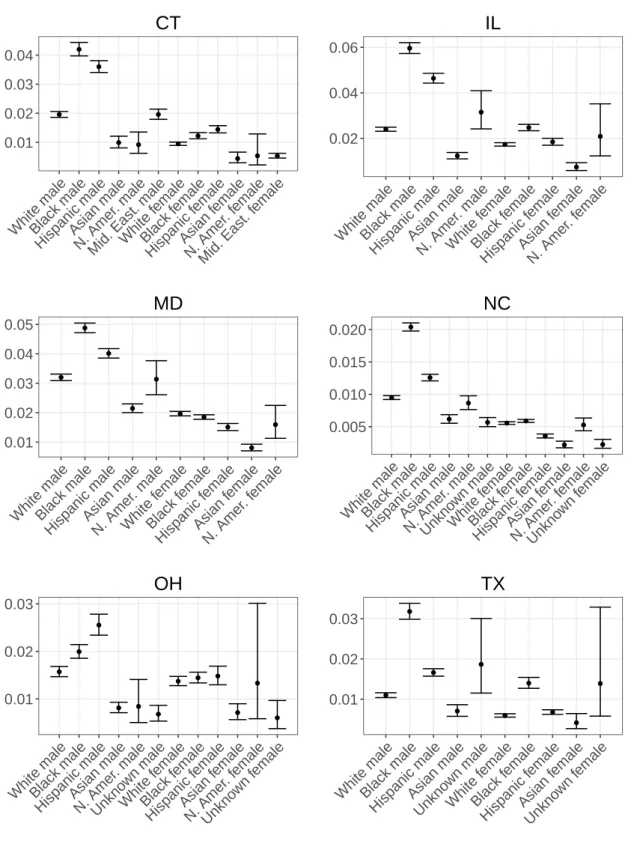
The baseline comparison group for each regression is White males. For every state, the coefficient for Black males and Hispanic males is positive and significant, indicating that Black and Hispanic males are searched at higher rates than their White counterparts. The coefficients for Asian males and Asian females are always negative and significant. White females are always less likely to be searched than White males, as the coefficient on that term is consistently negative and significant. To examine these results in more detail and to better evaluate my hypotheses, I calculate the predicted probabilities for every race/gender group, and present the results graphically in Figure 1 and the point estimates in Table 6. Predicted probabilities for each race and gender combination for each state are reported in Appendix B. When confidence intervals overlap, difference of means tests are conducted in order to determine the statistical significance of differences between the predicted probabilities and are reported in Appendix D.
Table 6:Predicted Probabilities of Search, Point Estimates
CT IL MD NC OH TX
White male 0.020 0.024 0.032 0.009 0.016 0.011
Black male 0.042 0.060 0.049 0.020 0.020 0.032
Hispanic male 0.036 0.046 0.040 0.013 0.026 0.017
Asian male 0.010 0.012 0.021 0.006 0.008 0.007
Native American male 0.009 0.031 0.031 0.009 0.008 –
Middle Eastern male 0.020 – – – – –
Unknown male – – – 0.006 0.007 –
Other male – – – – – 0.019
White female 0.009 0.017 0.020 0.005 0.014 0.006
Black female 0.012 0.025 0.019 0.006 0.014 0.014
Hispanic female 0.014 0.018 0.015 0.003 0.015 0.007
Asian female 0.004 0.007 0.008 0.002 0.007 0.004
Native American female 0.005 0.021 0.016 0.004 0.013 –
Middle Eastern female 0.005 – – – – –
Unknown female – – – 0.002 0.006 –
Other female – – – – – 0.014
male, after controlling for a variety of situational factors, is between 0.020-0.060. For Hispanic males, it is 0.013-0.046. Contrast this with White males, for example, whose predicted probabilities range from 0.009-0.032. Further, Black males typically have the highest probability of search, with the exception of Ohio, in which Hispanic males have the highest rate. This explains previous research’s focus on Black males, who appear to be the most highly targetted intersectional group. When we examine the treatment of other intersectional identities, though, we obtain a broader picture of stereotyping.
Within racial groups, female drivers always have a lower predicted probability of search than their male counterparts, lending evidence for hypothesis two. For Whites, females range from 0.005-0.020 and males range from 0.009-0.032. For Blacks, females range from 0.006-0.025 while males range from 0.020-0.060. Hispanics display the same trend, as females range from 0.003-0.018 and males range from 0.013-0.046. Even though I did not originally posit a difference for Asian females and males, Asian males do always have a higher predicted probability of search than their female counterparts, with a probability of 0.006-0.021 compared to 0.002-0.008. These probabilities demonstrate that females are less likely to be searched than their male counterparts, when examined within racial groups, suggesting that stereotypes associated with females are less likely to provoke suspicion.
When it comes to hypothesis three, that Black and Hispanic female drivers would have a higher likelihood of search than their White female counterparts, there is clear evidence for the difference between Blacks and Whites, but mixed evidence for the difference between Hispanics and Whites. In five of the six states analyzed, Black females have higher pre-dicted probabilities of search than White females. Only Maryland produces a statistically insignificant difference between these groups. Connecticut, Texas, Illinois, North Carolina, and Ohio all produce the same relationship: Black females have a statistically significantly higher probability of search than White females. In some states, like Texas, this difference is dramatic: Black females have more than twice the probability of search than their White counterparts (0.014 versus 0.006). In other states, the difference is less pronounced but still distinguishable and significant.
Con-necticut and Texas, Hispanics females have a higher predicted probability of search than White females. In Illinois and Ohio, the difference between these groups is statistically indistinguishable. In Maryland and North Carolina, interestingly, Hispanic females have a lower predicted probability of search than White females, counter to my original hypothesis. Further research is required to understand the particular racial dynamics of these contexts to better assess the causal mechanisms that produce these results.
Fig. 1:Predicted Probabilities of Search
0.01 0.02 0.03 0.04
White maleBlack male Hispanic maleAsian maleN. Amer
. male
Mid. East. maleWhite f emale Black f emale Hispanic f emale Asian f emale N. Amer . female
Mid. East. f emale
CT
0.02 0.04 0.06
White maleBlack male Hispanic maleAsian maleN. Amer
. male White f emale Black f emale Hispanic f emale Asian f emale N. Amer . female
IL
0.01 0.02 0.03 0.04 0.05White maleBlack male Hispanic maleAsian maleN. Amer
. male White f emale Black f emale Hispanic f emale Asian f emale N. Amer . female
MD
0.005 0.010 0.015 0.020
White maleBlack male Hispanic maleAsian maleN. Amer
. male Unkno wn male White f emale Black f emale Hispanic f emale Asian f emale N. Amer . female
Unkno wn f emale
NC
0.01 0.02 0.03White maleBlack male Hispanic maleAsian maleN. Amer
. male Unkno wn male White f emale Black f emale Hispanic f emale Asian f emale N. Amer . female
Unkno wn f emale
OH
0.01 0.02 0.03White maleBlack male Hispanic maleAsian maleUnkno
wn male White f emale Black f emale Hispanic f emale Asian f emale Unkno wn f emale
TX
that this is indeed the case, for every race/gender group. Drivers with older cars are always more likely to be searched than those with newer cars. As a proxy for class, this lends support to the notion that individuals that belong to lower classes are often stereotyped as criminals involved with illegal activity, thus warranting suspicion for searches.
Intersectionally, the interaction of race and gender with vehicle age provides mixed results. In Texas, vehicle age seems to have a bigger effect on Whites than any other racial group, indicating that class may have a stronger effect when racial bias is absent. However, the results from Illinois do not confirm this finding. More work is necessary to determine whether there is a pattern in the differential effect of class and race on police targetting.
Overall, the results from every state in my analysis provide justification for the need to analyze police-citizen interactions intersectionally. Blacks are not always searched more than Whites, it also depends on gender. Males are not always searched more than females, it also depends on race. In Illinois and Ohio, for example, Black females are searched at statistically insignificantly different rates from White males, demonstrating the need for intersectional understandings of perceived identity.
Fig. 2:Illinois 2014: Predicted Probabilities of Search over Vehicle Age
0.00 0.04 0.08 0.12
0 5 10 15 20
vehicle age White Male 0.00 0.04 0.08 0.12
0 5 10 15 20
vehicle age White female 0.00 0.04 0.08 0.12
0 5 10 15 20
vehicle age Black Male 0.00 0.04 0.08 0.12
0 5 10 15 20
vehicle age Black female 0.00 0.04 0.08 0.12
0 5 10 15 20
vehicle age Hispanic Male 0.00 0.04 0.08 0.12
0 5 10 15 20
vehicle age Hispanic female 0.00 0.04 0.08 0.12
0 5 10 15 20
vehicle age Asian Male 0.00 0.04 0.08 0.12
0 5 10 15 20
Fig. 3:Texas 2016: Predicted Probabilities of Search over Vehicle Age
0.00 0.02 0.04 0.06
0 5 10 15 20
vehicle age White Male 0.00 0.02 0.04 0.06
0 5 10 15 20
vehicle age White Female 0.00 0.02 0.04 0.06
0 5 10 15 20
vehicle age Black Male 0.00 0.02 0.04 0.06
0 5 10 15 20
vehicle age Black Female 0.00 0.02 0.04 0.06
0 5 10 15 20
vehicle age Hispanic Male 0.00 0.02 0.04 0.06
0 5 10 15 20
vehicle age Hispanic Female 0.00 0.02 0.04 0.06
0 5 10 15 20
vehicle age Asian Male 0.00 0.02 0.04 0.06
0 5 10 15 20
Fruitless Searches
Fruitless searches are searches that do not result in contraband. The dependent variable is constructed to compare stops that result in searches that do not result in contraband with stops that either do not result in searches or result in searches that lead to contraband. Illinois was exempted because it did not collect data on contraband during 2014. When possible, the same model that was estimated for searches is also used for fruitless searches.
Fruitless Search∼racegender + stop purpose + vehicle age + racegender*vehicle age + out of state + driver age + hour of day + day of week + year +i
Table 7 reports the results from five logistic regressions estimated with this dependent variable, again with White males as the baseline. Many observations are missing on stop purpose for Ohio, so robustness checks are reported in Appendix C.
These searches provide one way of trying to understand whether the disproportionate search rates that different identity groups experience are warranted. If Black and Hispanic males are searched more frequently because they are more likely to possess contraband, then these searches would be warranted. If Asians are searched less frequently because they are less likely to have contraband, then such low rates rates justified.
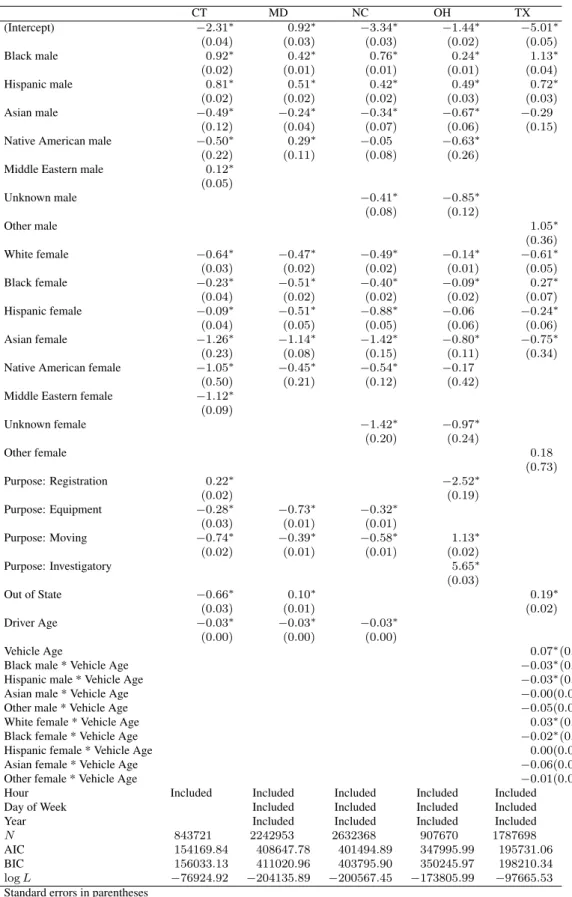
Table 7:Logistic Regression Results for Fruitless Searches
CT MD NC OH TX
(Intercept) −2.31∗ 0.92∗ −3.34∗ −1.44∗ −5.01∗
(0.04) (0.03) (0.03) (0.02) (0.05)
Black male 0.92∗ 0.42∗ 0.76∗ 0.24∗ 1.13∗
(0.02) (0.01) (0.01) (0.01) (0.04)
Hispanic male 0.81∗ 0.51∗ 0.42∗ 0.49∗ 0.72∗
(0.02) (0.02) (0.02) (0.03) (0.03)
Asian male −0.49∗ −0.24∗ −0.34∗ −0.67∗ −0.29
(0.12) (0.04) (0.07) (0.06) (0.15)
Native American male −0.50∗ 0.29∗ −0.05 −0.63∗
(0.22) (0.11) (0.08) (0.26)
Middle Eastern male 0.12∗
(0.05)
Unknown male −0.41∗ −0.85∗
(0.08) (0.12)
Other male 1.05∗
(0.36)
White female −0.64∗ −0.47∗ −0.49∗ −0.14∗ −0.61∗
(0.03) (0.02) (0.02) (0.01) (0.05)
Black female −0.23∗ −0.51∗ −0.40∗ −0.09∗ 0.27∗
(0.04) (0.02) (0.02) (0.02) (0.07)
Hispanic female −0.09∗ −0.51∗ −0.88∗ −0.06 −0.24∗
(0.04) (0.05) (0.05) (0.06) (0.06)
Asian female −1.26∗ −1.14∗ −1.42∗ −0.80∗ −0.75∗
(0.23) (0.08) (0.15) (0.11) (0.34)
Native American female −1.05∗ −0.45∗ −0.54∗ −0.17
(0.50) (0.21) (0.12) (0.42)
Middle Eastern female −1.12∗ (0.09)
Unknown female −1.42∗ −0.97∗
(0.20) (0.24)
Other female 0.18
(0.73)
Purpose: Registration 0.22∗ −2.52∗
(0.02) (0.19)
Purpose: Equipment −0.28∗ −0.73∗ −0.32∗
(0.03) (0.01) (0.01)
Purpose: Moving −0.74∗ −0.39∗ −0.58∗ 1.13∗
(0.02) (0.01) (0.01) (0.02)
Purpose: Investigatory 5.65∗
(0.03)
Out of State −0.66∗ 0.10∗ 0.19∗
(0.03) (0.01) (0.02)
Driver Age −0.03∗ −0.03∗ −0.03∗
(0.00) (0.00) (0.00)
Vehicle Age 0.07∗(0.00)
Black male * Vehicle Age −0.03∗(0.00)
Hispanic male * Vehicle Age −0.03∗(0.00)
Asian male * Vehicle Age −0.00(0.02)
Other male * Vehicle Age −0.05(0.04)
White female * Vehicle Age 0.03∗(0.00)
Black female * Vehicle Age −0.02∗(0.01)
Hispanic female * Vehicle Age 0.00(0.00)
Asian female * Vehicle Age −0.06(0.05)
Other female * Vehicle Age −0.01(0.07)
Hour Included Included Included Included Included
Day of Week Included Included Included Included
Year Included Included Included Included
N 843721 2242953 2632368 907670 1787698
AIC 154169.84 408647.78 401494.89 347995.99 195731.06
BIC 156033.13 411020.96 403795.90 350245.97 198210.34
logL −76924.92 −204135.89 −200567.45 −173805.99 −97665.53
Standard errors in parentheses
∗indicates significance atp <0.05
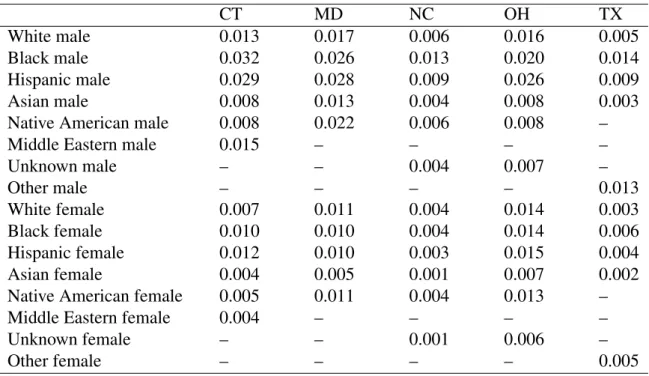
and they are reported as point estimates in Table 8 and plotted in Figure 4. Predicted probabilities with their 95% confidence intervals for each state are reported in Appendix B. When confidence intervals for predicted probabilities overlap, difference of means tests were conducted to determine the statistical significance of each pairwise comparison and these results are reported in Appendix D.
Table 8:Predicted Probabilities of Fruitless Search, Point Estimates
CT MD NC OH TX
White male 0.013 0.017 0.006 0.016 0.005
Black male 0.032 0.026 0.013 0.020 0.014
Hispanic male 0.029 0.028 0.009 0.026 0.009
Asian male 0.008 0.013 0.004 0.008 0.003
Native American male 0.008 0.022 0.006 0.008 –
Middle Eastern male 0.015 – – – –
Unknown male – – 0.004 0.007 –
Other male – – – – 0.013
White female 0.007 0.011 0.004 0.014 0.003
Black female 0.010 0.010 0.004 0.014 0.006
Hispanic female 0.012 0.010 0.003 0.015 0.004
Asian female 0.004 0.005 0.001 0.007 0.002
Native American female 0.005 0.011 0.004 0.013 –
Middle Eastern female 0.004 – – – –
Unknown female – – 0.001 0.006 –
Other female – – – – 0.005
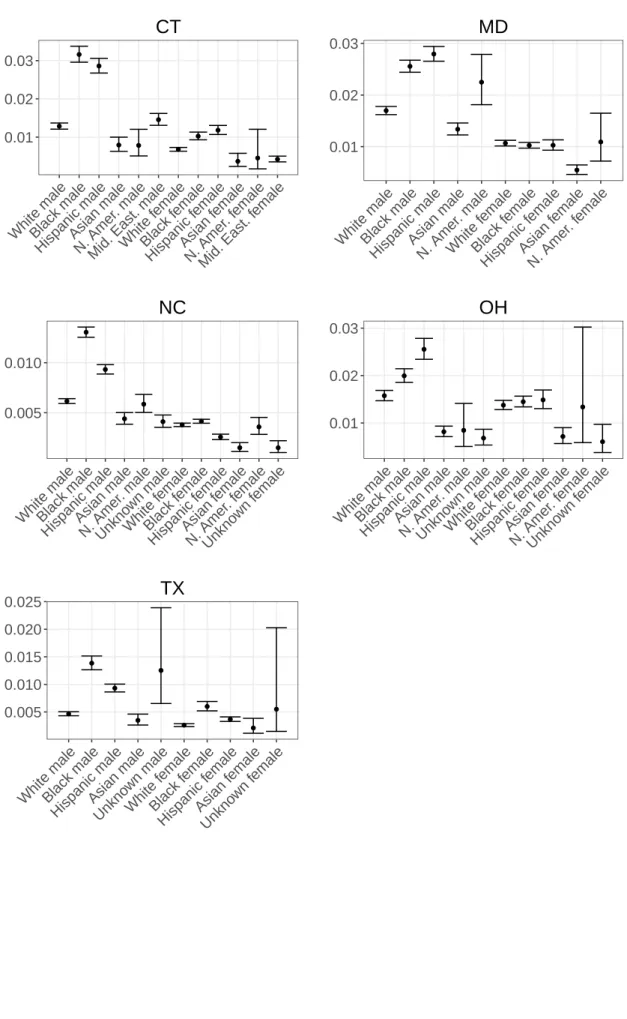
The predicted probabilities of fruitless search illustrate the relative success or failure of the searches performed. As is clear, Black and Hispanic males are most likely to experi-ence fruitless searches, confirming hypothesis six. Black males’ predicted probabilities of fruitless search range from 0.013-0.032, Hispanics’ from 0.009-0.029, compared to Whites, whose range from 0.005-0.017. Black and Hispanic males are more likely to be searched without the discovery of contraband than any other race/gender group analyzed. This sug-gests that their disproportionately high search rates cannot be justified by the argument that they are more likely to possess contraband because indeed, they are not.
reached before the officer decides to search the vehicle. When they do end up searching cars belonging to female drivers, the probability of finding contraband is greater than that of males. Within Whites, females have predicted probabilities of fruitless search that range from 0.003-0.014 while males’ range from 0.005-0.017. Within Blacks, females’ predicted probabilities range from 0.004-0.014 and males’ from 0.009-0.029. For Hispanics, the same trend holds (females from 0.003-0.015 and males from 0.009-0.029) and Asians (females from 0.001-0.007 and males from 0.003-0.013).
Hypothesis eight posited that Black and Hispanic females would be more likely to ex-perience fruitless search than White females. Similar to searches, the relationship between Black and White females is clearer than that of White and Hispanic females. In four of the five states, Black females have higher predicted probabilities of fruitless search than White females. In the fifth state, Maryland, no racial group of female drivers is statistically significantly different. In Connecticut, Texas, North Carolina, and Ohio, Black females are more likely to be searched without the discovery of contraband than White females. The threshold for the degree of suspicion required to search a car seems to be lower for Black female drivers than for White female drivers. Non-suspicious stereotypes of gentleness and warmth that apply to females are mediated by race and seem to apply less strongly to Black females than to Whites.
However, the relationship is more mixed when it comes to White and Hispanic female drivers. In Connecticut and Texas, Hispanic females are more likely to experience fruitless searches than White females. In Ohio and Maryland, there is no difference in the prob-abilities of experiencing fruitless searches. In North Carolina, Hispanics are less likely to experience fruitless searches than White females. Again, more research is required to understand the specificity of the White-Hispanic relationships that produce these results.
Fig. 4:Predicted Probabilities of Fruitless Search
0.01 0.02 0.03
White maleBlack male Hispanic maleAsian maleN. Amer
. male
Mid. East. maleWhite f emale Black f emale Hispanic f emale Asian f emale N. Amer . female
Mid. East. f emale
CT
0.01 0.02 0.03
White maleBlack male Hispanic maleAsian maleN. Amer
. male White f emale Black f emale Hispanic f emale Asian f emale N. Amer . female
MD
0.005 0.010
White maleBlack male Hispanic maleAsian maleN. Amer
. male Unkno wn male White f emale Black f emale Hispanic f emale Asian f emale N. Amer . female
Unkno wn f emale
NC
0.01 0.02 0.03White maleBlack male Hispanic maleAsian maleN. Amer
. male Unkno wn male White f emale Black f emale Hispanic f emale Asian f emale N. Amer . female
Unkno wn f emale
OH
0.005 0.010 0.015 0.020 0.025White maleBlack male Hispanic maleAsian maleUnkno
Fig. 5:Texas 2016: Predicted Probabilities of Fruitless Search over Vehicle Age
0.00 0.01 0.02 0.03
0 5 10 15 20
vehicle age White Male 0.00 0.01 0.02 0.03
0 5 10 15 20
vehicle age White Female 0.00 0.01 0.02 0.03
0 5 10 15 20
vehicle age Black Male 0.00 0.01 0.02 0.03
0 5 10 15 20
vehicle age Black Female 0.00 0.01 0.02 0.03
0 5 10 15 20
vehicle age Hispanic Male 0.00 0.01 0.02 0.03
0 5 10 15 20
vehicle age Hispanic Female 0.00 0.01 0.02 0.03
0 5 10 15 20
vehicle age Asian Male 0.00 0.01 0.02 0.03
0 5 10 15 20
Conclusion
Police-citizen interactions are affected by the perceived identities of the citizens in-volved. Not only is it important to consider the racial identity of the individual interacting with the police, but it is also important to analyze the way that gender and class mediate that interaction. Through a group positioning framework that adopts an intersectional approach, the outcomes that citizens experience from their interactions with law enforcement can be understood as constitutive of aggregated stereotypes that produce concrete outcomes.
This study has confirmed that Black males are targetted most heavily by police, on average. This group is consistently searched the most, and most likely to be found without contraband. Hispanic males are similarly targetted, and this study provides some basis on which further research that seeks to understand police-Hispanic relations can build.
Not only can punitive, harsh treatment by the police reveal bias, but lenient treatment can also reveal the role of implicit stereotypes. Females are less likely than males to en-counter harsh treatment by the police, within racial categories. However, intersectionally, the notion that men are targetted more than women, as a whole, breaks down. In many cases, Black female drivers are searched at rates equal to White males. A simple gender-based understanding of policing fails to capture the nuances of the relationship in the same way that a solely race-based one does.
Black females always have a higher likelihood of both search and fruitless search than White females, but the relationship between White and Hispanic females is more mixed than I originally anticipated. Further research is required to untangle the stereotypes that operate to produce these outcomes. It is possible that the context in which the policing oc-curs matters more for an understanding of White-Hispanic divides. White-Black relations may be more uniform than White-Hispanic relations, which may depend more heavily on the presence or absence of Hispanic immigrant communities. However, this is conjecture. Research specifically dedicated to understanding this divide in policing is required to un-tangle these results.
vehicle age on the likelihood of searches and fruitless searches. Class had a clear effect on the likelihood of search – drivers in older cars are more likely to be searched and more likely to experience fruitless searches than those in newer cars. When research fails to rec-ognize the importance of class, it misses a meaningful indicator in the likelihood of vehicle searches by the police. Here, more should be done to understand the intersectionality of race, gender,and class. This study produced mixed results: in Texas, class mattered more for Whites than other racial groups, but in Illinois, this finding was not replicated.
APPENDIX
Appendix A: Descriptive Statistics
Table 9:Connecticut Descriptive Statistics
Race Gender Stop Search Coxntraband Search Rate Hit Rate
White male 367,638 10,362 4,355 0.028 0.420
Black male 74,413 5,422 1,775 0.073 0.327
Hispanic male 71,832 4,633 1,382 0.064 0.298
Asian male 7,627 103 43 0.014 0.417
Native American male 2,029 26 10 0.013 –
Middle Eastern male 22,956 695 212 0.030 0.305
White female 214,409 2,828 1,053 0.013 0.372
Black female 38,551 799 219 0.021 0.274
Hispanic female 30,887 772 224 0.025 0.290
Asian female 4,158 24 7 0.006 –
Native American female 698 5 1 0.007 –
Middle Eastern female 22,686 184 48 0.008 0.261
Missing 39 0 0 – –
Total, non-missing 857,884 25,853 9,329 – –
Average rate, non-missing – – – 0.025 0.320
Table 10:Illinois Descriptive Statistics
Race Gender Stop Search Contraband Search Rate
White male 819,532 33,030 – 0.040
Black male 232,170 21,612 – 0.093
Hispanic male 184,091 14,917 – 0.081
Asian male 43,512 832 – 0.019
Native American male 3,633 153 – 0.042
White female 510,042 14,809 – 0.029
Black female 150,858 6,672 – 0.044
Hispanic female 76,902 2943 – 0.038
Asian female 21,030 187 – 0.009
Native American female 1,468 38 – 0.026
Missing 9 0 – –
Total, non-missing 2,043,247 95,193 – –
Table 11:Maryland Descriptive Statistics
Race Gender Stop Search Contraband Search Rate Hit Rate
White male 884,193 30,346 10,726 0.034 0.353
Black male 638,612 36,399 11,329 0.057 0.311
Hispanic male 172,754 7,976 1,814 0.046 0.227
Asian male 51,812 1,186 345 0.023 0.291
Native American male 4,239 138 33 0.033 0.239
White female 533,021 10,746 3,711 0.020 0.345
Black female 385,976 7,791 2,264 0.020 0.291
Hispanic female 53,695 825 199 0.015 0.241
Asian female 29,604 242 61 0.008 0.252
Native American female 2,380 41 8 0.017 –
Missing 98,677 1,842 584 0.019 0.317
Total, non-missing 2,756,286 95,690 30,490 – –
Average rate, non-missing – – – 0.027 0.283
Table 12:North Carolina Descriptive Statistics
Race Gender Stop Search Contraband Search Rate Hit Rate
White male 935,189 21,182 8,495 0.023 0.401
Black male 566,778 34,098 13,664 0.060 0.401
Hispanic male 151,895 5,188 1,710 0.034 0.330
Asian male 24,421 383 135 0.016 0.352
Native American male 15,472 326 125 0.021 0.383
Unknown male 24,157 283 90 0.012 0.318
White female 590,878 8,149 3,081 0.014 0.378
Black female 393,671 6,987 2,532 0.018 0.362
Hispanic female 65,548 651 218 0.010 0.335
Asian female 14,142 77 29 0.005 –
Native American female 10,329 130 49 0.013 0.377
Unknown female 9,284 48 21 0.005 –
Missing 1,466 – – 0 –
Total, non-missing 2801764 77502 30149 – –
Table 13:Ohio Descriptive Statistics
Race Gender Stop Search Contraband Search Rate Hit Rate
White male 2,650,921 73,007 85 0.028 0.001
Black male 405,234 30,334 44 0.075 0.001
Hispanic male 81,426 5,163 5 0.063 0.001
Asian male 47,931 698 1 0.015 0.001
Native American male 2,225 46 0 0.021 –
Unknown male 14,950 193 0 0.013 0.000
White female 1,297,815 27,456 27 0.021 0.001
Black female 198,760 8,754 6 0.044 0.001
Hispanic female 21,769 860 0 0.040 0.000
Asian female 16,382 152 0 0.009 0.000
Native American female 815 13 0 0.016 –
Unknown female 3,640 43 0 0.012 –
Missing 459,950 17,889 172 0.039 0.010
Total, non-missing 4,741,868 146,719 168 – –
Average, non-missing – – – 0.030 0.001
Table 14:Texas Descriptive Statistics
Race Gender Stop Search Contraband Search Rate Hit Rate
White male 574,367 10,545 5,794 0.018 0.549
Black male 123,816 5,206 2,813 0.042 0.540
Hispanic male 502,929 11,962 4,772 0.024 0.399
Asian male 20,085 217 107 0.011 0.493
Other male 1,181 39 21 0.033 –
White female 324,462 3,750 2,134 0.012 0.569
Black female 67,859 1,282 691 0.019 0.539
Hispanic female 212,051 2,296 960 0.011 0.418
Asian female 8,263 42 21 0.005 –
Other female 593 11 6 0.019 –
Missing 17,868 149 61 0.008 0.409
Total, non-missing 1,835,606 35,350 17,319 – –
Appendix B: Predicted Probabilities
Table 15:Connecticut Predicted Probability of Search
Lower CI Estimate Upper CI
White male 0.0186 0.0196 0.0206
Black male 0.0397 0.0420 0.0444
Hispanic male 0.0340 0.0360 0.0381
Asian male 0.0081 0.0099 0.0121
Native American male 0.0062 0.0092 0.0135
Middle Eastern male 0.0179 0.0196 0.0214
White female 0.0089 0.0095 0.0101
Black female 0.0112 0.0122 0.0133
Hispanic female 0.0133 0.0144 0.0157
Asian female 0.0030 0.0044 0.0066
Native American female 0.0022 0.0054 0.0129
Middle Eastern female 0.0046 0.0054 0.0062
Table 16:Illinois Predicted Probability of Search
Lower CI Estimate Upper CI
White male 0.0231 0.0240 0.0249
Black male 0.0573 0.0596 0.0621
Hispanic male 0.0443 0.0464 0.0486
Asian male 0.0110 0.0123 0.0138
Native American male 0.0242 0.0315 0.0410
White female 0.0166 0.0173 0.0181
Black female 0.0234 0.0247 0.0262
Hispanic female 0.0170 0.0184 0.0200
Asian female 0.0059 0.0074 0.0093
Table 17:Maryland Predicted Probability of Search
Lower CI Estimate Upper CI
White male 0.0309 0.0320 0.0331
Black male 0.0472 0.0488 0.0505
Hispanic male 0.0386 0.0401 0.0418
Asian male 0.0200 0.0215 0.0230
Native American male 0.0261 0.0314 0.0376
White female 0.0189 0.0197 0.0204
Black female 0.0178 0.0185 0.0193
Hispanic female 0.0139 0.0151 0.0163
Asian female 0.0070 0.0081 0.0093
Native American female 0.0113 0.0159 0.0225
Table 18:North Carolina Predicted Probability of Search
Lower CI Estimate Upper CI
White male 0.0092 0.0095 0.0098
Black male 0.0198 0.0204 0.0210
Hispanic male 0.0121 0.0126 0.0131
Asian male 0.0055 0.0062 0.0069
Native American male 0.0076 0.0086 0.0098
Unknown male 0.0050 0.0057 0.0064
White female 0.0054 0.0056 0.0058
Black female 0.0057 0.0059 0.0061
Hispanic female 0.0033 0.0036 0.0039
Asian female 0.0017 0.0022 0.0028
Native American female 0.0044 0.0053 0.0063
Unknown female 0.0017 0.0023 0.0030
Table 19:Ohio Predicted Probability of Search
Lower CI Estimate Upper CI
White male 0.0147 0.0157 0.0168
Black male 0.0185 0.0199 0.0214
Hispanic male 0.0234 0.0255 0.0278
Asian male 0.0071 0.0081 0.0093
Native American male 0.0050 0.0084 0.0141
Unknown male 0.0053 0.0068 0.0086
White female 0.0128 0.0137 0.0147
Black female 0.0134 0.0144 0.0156
Hispanic female 0.0130 0.0148 0.0169
Asian female 0.0056 0.0071 0.0090
Native American female 0.0058 0.0133 0.0301
Table 20:Texas Predicted Probability of Search
Lower CI Estimate Upper CI
White male 0.0104 0.0110 0.0116
Black male 0.0299 0.0318 0.0338
Hispanic male 0.0157 0.0166 0.0176
Asian male 0.0058 0.0071 0.0086
Other male 0.0115 0.0187 0.0301
White female 0.0055 0.0059 0.0064
Black female 0.0127 0.0140 0.0154
Hispanic female 0.0062 0.0068 0.0074
Asian female 0.0027 0.0042 0.0064
Other female 0.0058 0.0139 0.0329
Table 21:Connecticut Predicted Probability of Fruitless Search
Lower CI Estimate Upper CI
White male 0.01 0.01 0.01
Black male 0.03 0.03 0.03
Hispanic male 0.03 0.03 0.03
Asian male 0.01 0.01 0.01
Native American male 0.01 0.01 0.01
Middle Eastern male 0.01 0.01 0.02
White female 0.01 0.01 0.01
Black female 0.01 0.01 0.01
Hispanic female 0.01 0.01 0.01
Asian female 0.00 0.00 0.01
Native American female 0.00 0.00 0.01
Middle Eastern female 0.00 0.00 0.01
Table 22:Maryland Predicted Probability of Fruitless Search
Lower CI Estimate Upper CI
White male 0.02 0.02 0.02
Black male 0.02 0.03 0.03
Hispanic male 0.03 0.03 0.03
Asian male 0.01 0.01 0.01
Native American male 0.02 0.02 0.03
White female 0.01 0.01 0.01
Black female 0.01 0.01 0.01
Hispanic female 0.01 0.01 0.01
Asian female 0.00 0.01 0.01
Table 23:North Carolina Predicted Probability of Fruitless Search
Lower CI Estimate Upper CI
White male 0.0059 0.0062 0.0064
Black male 0.0126 0.0131 0.0136
Hispanic male 0.0089 0.0093 0.0098
Asian male 0.0039 0.0044 0.0050
Native American male 0.0050 0.0059 0.0068
Unknown male 0.0035 0.0041 0.0048
White female 0.0036 0.0038 0.0040
Black female 0.0039 0.0041 0.0043
Hispanic female 0.0023 0.0026 0.0029
Asian female 0.0011 0.0015 0.0020
Native American female 0.0028 0.0036 0.0045
Unknown female 0.0010 0.0015 0.0022
Table 24:Ohio Predicted Probability of Fruitless Search
Lower CI Estimate Upper CI
White male 0.01 0.02 0.02
Black male 0.02 0.02 0.02
Hispanic male 0.02 0.03 0.03
Asian male 0.01 0.01 0.01
Native American male 0.01 0.01 0.01
Unknown male 0.01 0.01 0.01
White female 0.01 0.01 0.01
Black female 0.01 0.01 0.02
Hispanic female 0.01 0.01 0.02
Asian female 0.01 0.01 0.01
Native American female 0.01 0.01 0.03
Unknown female 0.00 0.01 0.01
Table 25:Texas Predicted Probability of Fruitless Search
Lower CI Estimate Upper CI
White male 0.0043 0.0047 0.0050
Black male 0.0127 0.0138 0.0151
Hispanic male 0.0086 0.0093 0.0101
Asian male 0.0026 0.0035 0.0046
Other male 0.0065 0.0125 0.0239
White female 0.0024 0.0026 0.0029
Black female 0.0052 0.0060 0.0069
Hispanic female 0.0033 0.0037 0.0041
Asian female 0.0011 0.0021 0.0038
Appendix C: Ohio Robustness Checks
Table 26 reports results from two models that test the robustness of the Ohio findings, given the large missingness problems on the stop purpose variable. Model 1 is the complete model as presented in the paper. Model 2 presents the same model without the stop purpose variable, and as a result preserves a larger sample size. Model 3 estimates the same logistic regression but only on the variables in the Ohio data that arenotmissing on the stop purpose variable.
There is no change in the direction or significance of coefficients for Black males, His-panic males, Asian males, Native American males, White females, or Asian females. The coefficients for Black and Hispanic females do change when the model is run without stop purpose. They both become positive and significant, indicating that they have a greater like-lihood of search than the baseline category, White males. However, this does not change any of the hypothesis tests presented in the paper. Black and Hispanic females are still searched at higher rates than White females, who maintain a statistically significantly neg-ative relationship to the baseline, White males.
Table 27 presents the same three models for the logistic regressions estimating fruitless searches. Again, we see a similar result. In fact, Ohio has a very low contraband hit rate, as reported in Table 3 and as a result, the logistic regressions for searches and fruitless searches are almost identical, because almost every search is a fruitless search.
Table 26:Ohio: Logistic Regressions Estimating Searches
Model 1 Model 2 Model 3
(Intercept) −1.45∗ −2.68∗ −0.61∗
(0.02) (0.01) (0.02)
Black male 0.24∗ 0.83∗ 0.49∗
(0.01) (0.01) (0.01)
Hispanic male 0.50∗ 0.78∗ 0.45∗
(0.03) (0.02) (0.03)
Asian male −0.67∗ −0.73∗ −0.70∗
(0.06) (0.04) (0.06)
Native American male −0.63∗ −0.41∗ −0.68∗
(0.26) (0.15) (0.24)
Unknown male −0.85∗ −0.73∗ −0.77∗
(0.12) (0.07) (0.11)
White female −0.14∗ −0.32∗ −0.20∗
(0.01) (0.01) (0.01)
Black female −0.09∗ 0.23∗ −0.03
(0.02) (0.01) (0.02)
Hispanic female −0.06 0.12∗ −0.15∗
(0.06) (0.04) (0.05)
Asian female −0.80∗ −1.23∗ −0.90∗
(0.11) (0.08) (0.11)
Native American female −0.17 −0.63∗ −0.22
(0.42) (0.28) (0.40)
Unknown female −0.97∗ −0.78∗ −1.02∗
(0.24) (0.15) (0.23)
Purpose: Registration −2.52∗ (0.19)
Purpose: Moving 1.13∗
(0.02)
Purpose: Investigatory 5.65∗ (0.03)
Hour of Day Included Included Included
Day of Week Included Included Included
Year Included Included Included
N 907670 4741868 907670
AIC 348022.86 1144585.92 411611.05
BIC 350272.84 1146992.87 413720.41
logL −173819.43 −572112.96 −205625.53
Standard errors in parentheses
Table 27:Ohio: Logistic Regressions Estimating Fruitless Searches
Model 1 Model 2 Model 3
(Intercept) −1.44∗ −2.68∗ −0.61∗
(0.02) (0.01) (0.02)
Black male 0.24∗ 0.82∗ 0.49∗
(0.01) (0.01) (0.01)
Hispanic male 0.49∗ 0.78∗ 0.45∗
(0.03) (0.02) (0.03)
Asian male −0.67∗ −0.73∗ −0.70∗
(0.06) (0.04) (0.06)
Native American male −0.63∗ −0.41∗ −0.68∗
(0.26) (0.15) (0.24)
Unknown male −0.85∗ −0.73∗ −0.77∗
(0.12) (0.07) (0.11)
White female −0.14∗ −0.32∗ −0.20∗
(0.01) (0.01) (0.01)
Black female −0.09∗ 0.23∗ −0.03
(0.02) (0.01) (0.02)
Hispanic female −0.06 0.12∗ −0.15∗
(0.06) (0.04) (0.05)
Asian female −0.80∗ −1.23∗ −0.90∗
(0.11) (0.08) (0.11)
Native American female −0.17 −0.63∗ −0.22
(0.42) (0.28) (0.40)
Unknown female −0.97∗ −0.78∗ −1.01∗
(0.24) (0.15) (0.23)
Purpose: Registration −2.52∗ (0.19)
Purpose: Moving 1.13∗
(0.02)
Purpose: Investigatory 5.65∗ (0.03)
Hour of Day Included Included Included
Day of Week Included Included Included
Year Included Included Included
N 907670 4741868 907670
AIC 347995.99 1144207.00 411625.08
BIC 350245.97 1146613.95 413734.44
logL −173805.99 −571923.50 −205632.54
Standard errors in parentheses
Appendix D: Difference of Means Tests
In order to test whether the difference between predicted probabilities is statistically significant, when confidence intervals overlap, I employ the simulation method. I simulate 1,000 predicted probabilities, take the difference between these probabilities, and then cal-culate 95% confidence intervals around that difference. If these confidence intervals include zero, the difference is not statistically significant. If the pairwise comparison is not included in this Appendix, then the difference between the predicted probabilities is not statistically significant at the 0.05 level.
Table 28:Difference in Means Tests for Predicted Probabilities of Search
State TX NC OH
White female predicted probability 0.0059 0.0056 0.0137
Black female predicted probability – 0.0059 0.0145
Hispanic female predicted probability 0.0068 – –
Difference -0.0008 -0.0003 -0.0007
Lower CI -0.0014 -0.0005 -0.0014
Upper CI -0.0003 -0.0001 -0.0001
Significant? Yes Yes Yes
Table 29:Difference in Means Tests for Predicted Probabilities of Fruitless Search
State NC OH
White female predicted probability 0.0038 0.0138
Black female predicted probability 0.0041 0.0145
Hispanic female predicted probability – –
Difference -0.0004 -0.0007
Lower CI -0.0005 -0.0013
Upper CI -0.0002 -0.0001
REFERENCES
Blumer, Herbert. 1955. “Attitudes and the social act.”Social Problems3(2):59–65.
Blumer, Herbert. 1958. “Race relations as a sense of group position.”Pacific Sociological Review1:3–7.
Bobo, Lawrence and Vincent L Hutchings. 1996. “Perceptions of racial group competition: Extending Blumer’s theory of group position to a multiracial social context.”American Sociological Reviewpp. 951–972.
Chua, Peter and Dune C Fujino. 1999. “Negotiating new Asian-American masculinities: Attitudes and gender expectations.”The Journal of Men’s Studies7(3):391–413.
Clawson, Rosalee A and Rakuya Trice. 2000. “Poverty as we know it: Media portrayals of the poor.”The Public Opinion Quarterly64(1):53–64.
Crenshaw, Kimberle. 1989. “Demarginalizing the intersection of race and sex: A black feminist critique of antidiscrimination doctrine, feminist theory and antiracist politics.” U. Chi. Legal F.p. 139.
Crenshaw, Kimberle. 1991. “Mapping the margins: Intersectionality, identity politics, and violence against women of color.”Stanford law reviewpp. 1241–1299.
Eng, David L. 2001. Racial castration: managing masculinity in Asian America. Duke University Press.
Fields, Barbara Jeanne. 1990. “Slavery, race and ideology in the United States of America.” New Left Review(181):95.
Fineman, Martha. 1995.The neutered mother, the sexual family, and other twentieth century tragedies. Psychology Press.
Fiske, Susan T, Amy JC Cuddy, Peter Glick and Jun Xu. 2002. “A model of (often mixed) stereotype content: competence and warmth respectively follow from perceived status and competition.”Journal of personality and social psychology82(6):878.
Gross, Samuel R and Debra Livingston. 2002. “Racial profiling under attack.”Columbia Law Reviewpp. 1413–1438.
Hancock, Ange-Marie. 2004. The politics of disgust: The public identity of the welfare queen. NYU Press.
Harris, David A. 1999. Driving while Black: Racial profiling on our nation’s highways. American Civil Liberties Union New York.
Harris, David A. 2003. Profiles in injustice: Why racial profiling cannot work. The New Press.
Harris-Perry, Melissa V. 2011. Sister citizen: Shame, stereotypes, and Black women in America. Yale University Press.
Huddy, Leonie and Nayda Terkildsen. 1993. “The consequences of gender stereotypes for women candidates at different levels and types of office.” Political Research Quarterly 46(3):503–525.
Kim, Claire Jean. 2003. Bitter fruit: The politics of black-Korean conflict in New York City. Yale University Press.
Larrabee, Jennifer A. 1997. “DWB (Driving While Black) and Equal Protection: The Realitites of an Unconstitutional Police Practice.”JL & Pol’y6:291.
Lee, Tiane L and Susan T Fiske. 2006. “Not an outgroup, not yet an ingroup: Immi-grants in the stereotype content model.”International Journal of Intercultural Relations 30(6):751–768.
Luker, Kristin. 1984. Abortion and the Politics of Motherhood. Vol. 3 Duke Univ Press.
Martinez, Ramiro. 2007. “Incorporating Latinos and immigrants into policing research.” Criminology & Public Policy6(1):57–64.
Meehan, Albert J and Michael C Ponder. 2002. “Race and place: The ecology of racial profiling African American motorists.”Justice Quarterly19(3):399–430.
Omi, Michael and Howard Winant. 2014.Racial formation in the United States. Routledge.
Roediger, David. 1991. “The Wages of Whiteness: Race and the Making of the American.” Working Classpp. 1790–1860.
Solis, Carmen, Edwardo L Portillos and Rod K Brunson. 2009. “Latino youths’ experi-ences with and perceptions of involuntary police encounters.”The Annals of the Ameri-can Academy of Political and Social Science623(1):39–51.
Taylor, Charles R and Barbara B Stern. 1997. “Asian-Americans: Television advertising and the model minority stereotype.”Journal of advertising26(2):47–61.
Viglione, Jill, Lance Hannon and Robert DeFina. 2011. “The impact of light skin on prison time for black female offenders.”The Social Science Journal48(1):250–258.
Welch, Kelly. 2007. “Black criminal stereotypes and racial profiling.”Journal of Contem-porary Criminal Justice23(3):276–288.