A Comparison of Benefit Limits in Mental Health
William Joseph Olesiuk, Ph.D.,
Cecil G. Sheps Center for Health Services Research, University of North Carolina at Chapel Hill Helen Anne Sweeney, M.S.,
The Ohio Department of Mental Health and Addiction Services
Eric E. Seiber, Ph.D.,
The Ohio State University College of Public Health Hong Zhu, Ph.D.,
University of Texas Southwestern Medical Center Sharon B. Schweikhart, Ph.D.,
The Ohio State University College of Public Health Abigail B. Shoben, Ph.D., and
The Ohio State University College of Public Health Kwok Kwan Tam, M. Soc.Sc.
The Ohio Department of Mental Health and Addiction Services
William Joseph Olesiuk: [email protected]; Helen Anne Sweeney: [email protected]; Eric E. Seiber: [email protected]; Hong Zhu: [email protected]; Sharon B. Schweikhart:
[email protected]; Abigail B. Shoben: [email protected]; Kwok Kwan Tam: [email protected]
Abstract
This study provides insight to policy makers and stakeholders on how three types of benefits limits on Medicaid-covered mental health services might affect access for consumers diagnosed with severe mental illness. The study used a retrospective cohort design with data for Medicaid-covered, community-based mental health services provided in Ohio during fiscal year 2010. Log-binomial regression was used for the analysis. Results indicate that limits compared have
significant, varying consequences based on Medicaid coverage and diagnoses. When constraining Medicaid costs, policy makers should consider how limits will disrupt care and include clinicians in discussions prior to implementation
Utilization limits on publicly financed community based mental health services (CBMHs) can provide a way for the State Mental Health Authority (SMHAs) and local communities to allocate scarce resources when demand for these services is increasing. However, limits have the potential of creating access barriers for individuals who have been diagnosed with serious mental illness and who have treatment needs that exceed the service limit. Therefore, it is important for policymakers to understand the relationship between individual service needs and the probability of individuals having their CBMH services limited as a result of changes within the publicly financed CBMH system.
HHS Public Access
Author manuscript
Adm Policy Ment Health
. Author manuscript; available in PMC 2017 July 01.Published in final edited form as:
Adm Policy Ment Health. 2016 July ; 43(4): 524–534. doi:10.1007/s10488-015-0656-7.
A
uthor Man
uscr
ipt
A
uthor Man
uscr
ipt
A
uthor Man
uscr
ipt
A
uthor Man
uscr
Background
Prior to July 2012 in Ohio, state subsidy was allocated to the local community mental health boards (Boards) to pay for the state's share of Medicaid-covered CBMH services. The The Boards offset any shortages incurred when state subsidy was inadequate to cover Ohio's share of the Medicaid match. In order to offset any shortfall, the Board would reallocate local revenue from non-Medicaid services to Medicaid-covered services. As in other states, Medicaid-covered adults who accessed CBMH services and the Medicaid expenditures associated with these services increased between 2002 and 2007. In Ohio, Medicaid-covered adults who were under the age of 65 and accessed CBMH services increased in Ohio between 2002 and 2007 by 31.5%. Fiscal Year (FY) 2007 Medicaid expenditures for CBMH services for this age cohort in Ohio grew by 16.5%. (The Ohio Department of Mental Health, n.d.)
During the Great Recession, which lasted between December 2007 and June 2009 (National Bureau of Economic Research, 2010), the number of adults who were under the age of 65 and who accessed Medicaid-covered services continued to increase. By June 2010, the number of adults who were under the age of 65 and who accessed Medicaid-covered CBMH services increased by 22.5% from 2007 levels (The Ohio Department of Mental Health, 2012).
Due to budget shortfalls that were primarily the result of the economic downturn, Ohio reduced state subsidy for non-Medicaid covered CBMH services. However, the SMHA and the Boards were able to continue to meet demand for Medicaid-covered CBMH services due to expanded federal funding, which increased the federal share by about 15 percentage points between 2007 and 2010 (Petersen, 2010). To assist with the financial pressures of Medicaid covering more people during the Great Recession under the provisions of the American Recovery and Reinvestment Act, the federal government assumed a greater portion of the Medicaid total costs if states did not restrict eligibility and service offerings (Kaiser Commission on Medicaid and the Uninsured, 2009). This additional federal funding began in October 2008 and expired in June 2010. In Ohio, the enhanced federal share was approximately 75%, rather than 60%, while the SMHA and the Boards were responsible for about 25% (Petersen, 2010). As a consequence, the SMHA/ Board's share of Medicaid costs for CBMH services for adults under the age of 65 was less between October 2008 and June 2010 than the period prior to October 2008.
After the enhanced Medicaid federal funding expired, states, such as Ohio, continued to experience financial pressures to pay for Medicaid-covered services. Consequently, states developed various strategies to manage these pressures (Smith, Gifford, Ellis, Rudowitz, & Snyder, 2011). In Ohio, the General Assembly passed legislation to allow the SMHA to assume responsibility for the state share of Medicaid expenditures for CBMH services. In order to cover the state's share of Medicaid expenditures, state subsidy was reduced to Boards. However, under this new financial arrangement between the SMHA and the Boards, Boards were no longer required to pay for any Medicaid-covered CBMH services and assist with offsetting any Medicaid expenditures shortages. In addition to diverting state subsidy from the Boards, the legislation allowed the SMHA to contain the costs of delivering
A
uthor Man
uscr
ipt
A
uthor Man
uscr
ipt
A
uthor Man
uscr
ipt
A
uthor Man
uscr
Medicaid-covered CBMH services to an expanding Medicaid population. Essentially, the legislation granted the SMHA administrators the authority to develop a cost containment strategy. This strategy would limit the amount of Medicaid-covered CBMH services that an enrollee could access through a certified CBMH organization during a FY (Olesiuk, Sweeney, Seiber, Tanenbaum, & Tam, 2013). Savings realized from the cost containment strategy would offset Medicaid funding shortages that Boards previously covered.
It should be noted that Medicaid-covered mental health services delivered by non-certified CBMH providers, such as primary care physicians, were not subject to the limits. Also, the parity requirements of the Mental Health Parity and Addiction Equity Act of did not inhibit Ohio from implementing these limits in their Medicaid State Plan (Mann, 2013). Utilization limits on Medicaid reimbursement for CBMH services were implemented in Ohio in November 2011 and were not in place at any point during the study period (Plouck, 2011).
Aims
This study's purpose is to identify groups of Medicaid enrollees who are between the ages of 18 and 64 and who will likely be affected by the cost containments policies that limit Medicaid-covered CBMH service utilization in one state, Ohio. This study will simulate the cost containment provisions to determine the policy's effects with relationship to individual characteristics of Medicaid enrollees who have mental illness and have utilized covered CBMH services. (Refer to Table 1 for a summary of limits per specific Medicaid-covered CBMH service).
This simulation is undertaken by using Andersen & Newman's (1973) framework, which was adapted for mental health by Leaf et al. (1988). The framework classifies individual characteristics into three categories: “need,” “predisposition,” and “enabling” factors. This study further explores the effects of two hypothetical expenditure based limits with regard to these factors One hypothetical annual expenditure limit scenario is uniformly set for all study participants. The other hypothetical scenario will have different expenditure limits based on a participant's primary mental health diagnosis. Ultimately, study results will provide policymakers with a better understanding of the effects of the cost containment policy on different groups of Medicaid-covered enrollees. The specific aims to be addressed by the study are described below.
Aim One
This study determines the effect of the cost containment policy on Medicaid-covered enrollees who have serious mental illness (SMI) and who accessed CBMH services. This policy may have the greatest impact on individuals who diagnosed with SMI illness and have the greatest need for treatment since limits on mental health benefits shift the risk of SMI from the insurer to the individual (Hodgkin, Horgan, Garnick, & Merrick, 2009; Zuvekas, Banthin, & Selden, 1998). Without limits on insurance coverage, no matter how many services individuals access, the insurer must pay for the service usage. However, when insurance limits the quantity of services, an individual who requires services in excess of a limit may not have access. Therefore, individuals diagnosed with SMI are potentially placed at risk since they may require additional mental health services above the threshold. To
A
uthor Man
uscr
ipt
A
uthor Man
uscr
ipt
A
uthor Man
uscr
ipt
A
uthor Man
uscr
understand whether this possibility is likely, the factors associated with service need must be distilled away from other factors that facilitate an individual accessing service. Need variables are associated with an individual's health state, (i.e. disability status and diagnosis) (Andersen & Newman, 1973; Leaf et al., 1988). “Predisposition” variables included demographics which may influence the type of health services and providers that a client seeks (Andersen & Newman, 1973; Leaf et al., 1988). Finally “enabling” factors are associated with an individual's ability to access certain services, such as region where the individual resides (Andersen & Newman, 1973; Leaf et al., 1988).
Aim 2
The study compares hypothetical expenditure and utilization limits. Benefit limits have been used since insurance coverage was extended to include mental health services (R. G. Frank & McGuire, 1997; Hodgkin et al., 2009; Salkever, Shinogle, & Goldman, 1999). These limits have either been in the form of expenditure limits or in the form of utilization limits (R. G. Frank & McGuire, 1997; Hodgkin et al., 2009; Salkever et al., 1999). To date, research has not addressed whether a utilization limit or expenditure limit has a greater effect on vulnerable populations served by public community mental health systems. While a utilization limit allows the insurer to define specific services types and allowable quantities that a client can receive, an expenditure limit allows the provider more latitude to develop a treatment plan based on services available within a community. Previous research has shown that the amount and quality of public financed CBMH services available varies among communities (Hogan, 1999; Human & Wasem, 1991). Therefore, a policy that limits particular CBMH services may have the unintended consequence of altering treatment for individuals whose total CBMH expenditures are low but may need to access a specific service above the limit.
Aim 3
This study examines the way simple risk-adjustment in the design of benefit limits reduces the relationship between an individual's need for services and their risk of having services limited. With this specific aim we consider whether controlling for diagnosis results in individuals enrolled in Medicaid through the Aged, Blind and Disabled (ABD) program being at an increased risk of encountering a benefit limit relative to the Medicaid population enrolled through the state's Covered Families and Children (CFC) program. The ABD Medicaid population in general has higher per-capita CBMH expenditures than the CFC Medicaid population. Therefore, it is important to understand whether a diagnosis
adjustment addresses this disparity as well. A detailed description of the study methodology is provided below.
Methods
Data
Ohio's FY 2010 CBMH Medicaid claims were the primary data source and were extracted from Ohio's Multi-Agency Community Services Information System (MACSIS). MACSIS serves as the billing system for public financed CBMH services. It includes both Medicaid and non-Medicaid services (Ohio Department of Mental Health and Addiction Services,
A
uthor Man
uscr
ipt
A
uthor Man
uscr
ipt
A
uthor Man
uscr
ipt
A
uthor Man
uscr
n.d.). Data were extracted from this system for all FY 2010 Medicaid-reimbursed claims. Claims data were only compiled for individuals with a birth year indicating age between 19 and 64. Extracted data included: the individual's year of birth, a flag to indicate if the individuals was continuously enrolled in Medicaid or only part year of the year, Medicaid program enrollment, Board of residence (roughly equivalent to county of residence), and a unique identifier. For each service visit, the date of service, service type, amount of service, cost of service, whether the claim was reimbursed by Medicaid, and an agency level code for the utilized provider was extracted. Data analysis was restricted to individuals who were between the ages of 19 and 64, who were enrolled in Medicaid for at least part of the year, and who accessed at least one Medicaid-covered CBMH service in FY 2010. Analysis of data was conducted using Stata version 11 (StataCorp, 2009).
Measures
Study participants—The way in which we classified and measured the data obtained from MACSIS is described below. The data on Medicaid program enrollment described whether the Medicaid-covered client was enrolled as ABD Medicaid, which only includes those with a Social Security Agency (SSA) disability, whether the client was enrolled in the CFC Medicaid, and whether the client was not covered by Medicaid (non-Medicaid). We excluded non-Medicaid enrollees as they were not covered by the policy change. For each enrollment category, it was noted whether a client was enrolled for a full year or only part of the year, as well as whether or not the client was enrolled in more than one Medicaid program during the year (e.g., clients enrolled in CFC Medicaid in the beginning of the year may have switched to ABD Medicaid for the remainder of the year). It is important to distinguish length of Medicaid eligibility into the categories of partial year and full year. If an individual is only Medicaid eligible for part of the year, then it is possible that not all of their service utilization is captured in our dependent variable, Medicaid reimbursed CBMH services. Therefore, we utilized a binary indicator of whether or not an individual was enrolled in Medicaid for the full year. We also separate individuals that obtain Medicaid eligibility for only one Medicaid program in FY 2010 (e.g., CFC) from those that during the same year are enrolled in both Medicaid programs (CFC and ABD). We believe that individuals that obtain eligibility for both programs may have distinct underlying characteristics, and we control for this factor in our analysis. Based on these different Medicaid permutations, we created the following eight categorical variables for Medicaid status: 1) Full-year ABD, 2) Full-year CFC, 3) Full-year ABD or CFC (where an individual was on each type of Medicaid for a portion of the year), 4) Full-year Unknown (where the administrative data is incomplete regarding which Medicaid program the individual was enrolled in), 5) Part-year ABD, 6) Part-year CFC, 7) Part-year ABD or CFC, 8) Part-year Unknown
Geographic classification—The Board of residence was sub-classified into three categories; urban, mid-size, and rural. Boards classified as urban are located in counties that had populations of more than 300,000 individuals and were located in a Standard
Metropolitan Statistical Area (SMSA) (Office of Management and Budget, 2013). Rural boards' service areas only include counties located outside of SMSAs. Board areas that encompass counties which that have populations less than 300,000 people and are located
A
uthor Man
uscr
ipt
A
uthor Man
uscr
ipt
A
uthor Man
uscr
ipt
A
uthor Man
uscr
within an SMSA were classified as mid-size. In Ohio, some Boards served more than one county. If a Board served both a rural and mid-size county, the board would be classified as mid-sized.
Diagnostic categories—Diagnostic categories were classified into eight groups based on the ICD-9 diagnosis code of an individual's last service visit in the fiscal year. For each individual, only the primary diagnosis most frequently found on the individual's claims was used. For the purposes of this study, we created the following diagnostic categories: 1) schizophrenia and other psychotic disorders; 2) bipolar disorder; 3) depressive disorders; 4) attention-deficit, conduct, oppositional defiant, and disruptive behavior disorder; 5) Anxiety disorders; 6) adjustment disorders; 7) other mood disorders; and 8) other disorders not otherwise classified. Diagnostic category classifications were in accordance with the SMHA procedures and were similar, though not identical, to those included in the U.S. Agency for Health Care Research and Quality's Clinical Classification's Software (U.S. Agency for Health Care Research and Quality, 2013). The categories for types of service and units of service were community psychiatric supportive treatment (CPST for both group or individual in fifteen minute intervals, behavioral health counseling (group or individual) in fifteen minute intervals, diagnostic assessment by a physician in hours, diagnostic
assessment by a non-physician in hours, partial hospitalization in days, and pharmacy management in hours.
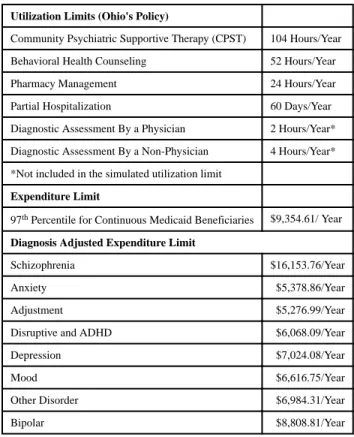
Benefit Limits Compared
This study compares three limit types: service utilization limits, expenditure limits which set uniform limits on Medicaid reimbursable costs for all Medicaid enrollees, and Medicaid reimbursable cost limits that are set based on the enrollee's primary diagnosis. Service utilization limits are modeled on Ohio's policy effective in FY 2012. This policy placed limits on the amount of certain Medicaid-covered CBMH services that Medicaid enrollee could access annually. Table 1 specifies the limits for each of the Medicaid-covered CBMH services. The other two limits are hypothetical expenditure-based limits which cap an enrollee's total CBMH service costs that Medicaid will reimburse in a FY. The first
expenditure limit considered capped costs for all Medicaid-covered clients at the same level. The second expenditure limit set different caps based on each Medicaid-covered client's primary diagnosis.
This study will examine expenditures and utilization of six categories of CBMH services in Ohio in FY 2010, in comparison to the utilization limits enacted by the state in FY 2012 and two hypothetical expenditure limits. The services under consideration in this study are described below. Two of the limited services considered in the study are classified under the rubric of behavioral health counseling which can either be delivered in a group or provided as individual counseling. A licensed counselor or social worker must provide any behavioral health counseling service. Two other limited services included in the study fall in the CPST category. CPST, like behavioral health counseling, can either be provided in a group or an individual setting. Unlike behavioral health counseling, CPST does not require a licensed counselor or social worker to provide the service. CPST service examples include skill building, monitoring, care coordination, and advocacy. A fifth service limited under the
A
uthor Man
uscr
ipt
A
uthor Man
uscr
ipt
A
uthor Man
uscr
ipt
A
uthor Man
uscr
policy and included in the study analysis is pharmacy management, which is concerned with prescription-based treatments. A sixth limited service included in the analysis is partial hospitalization, which is an ambulatory day-treatment service offered to
non-institutionalized individuals in need of CBMH services. There are also limits on two diagnostic services: diagnostic assessment by a physician and diagnostic assessment by a non-physician. Ohio's limits on the two diagnostic-assessments were not included in the utilization limit variable, as the study sought to evaluate the effects of limits on treatment. Based on an examination of FY 2010 Medicaid claims data, it was possible to simulate which enrollees would most likely experience the effects of utilization and expenditure limits on Medicaid-covered CBMH services.
Hypothetical expenditure limits were chosen such that a similar number of Medicaid enrollees would be affected by each of the three limits. This approach enables direct comparisons between the relative probabilities of exceeding each of the limits because the baseline amount is approximately equal. The unadjusted expenditure limit was constructed by computing the 97th percentile of Medicaid expenditures for all full-year Medicaid enrollees and creating a binary variable indicating whether each individual was above or below that threshold. Similarly the diagnosis-adjusted expenditure limit was constructed by computing the 97th percentile of Medicaid expenditures for all full-year enrollees in each diagnostic category and creating a binary variable indicating whether each individual was above or below that threshold. The 97th percentile was used because approximately 3% of all full-year Ohio Medicaid enrollees in FY 2010 would have exceeded the FY 2012 utilization limits. Thus, hypothetical expenditure limits were created such that approximately 3% of full-year Medicaid enrollees would exceed the limits (Refer to Table 1). Limits were not-prorated based on the length of time an individual was enrolled in Medicaid during a given year in either the state's utilization limit policy or in the artificial expenditure limits simulated in this analysis.
Analysis
In order to identify factors associated with an individual exceeding each of the three limits, we used alog-binomial generalized linear model (glm) (McNutt, Wu, Xue, & Hafner, 2003) to calculate the distinct influence of each of many variables on a binary outcome --whether or not an individual's FY 2010 utilization exceeded the limit. Results are reported as a relative probability, which is a more intuitive measure of association compared to the relative odds that would be obtained from multiple logistic regression model (Cohen, Cohen, West, & Aiken, 2003; McNutt et al., 2003; Pagano & Gauvreau, 2000). From these results, three regression models, which are the differences in the effects of key need factors, diagnosis, and ABD Medicaid status, were constructed so that the three effects can be compared across limits.
Results
Table 2 results display the demographic, diagnostic, and Medicaid-enrollment characteristics of the study population. According to Table 2 results, Medicaid enrollees diagnosed with depressive disorders represent the largest share of the sample. Only 35% of the study
A
uthor Man
uscr
ipt
A
uthor Man
uscr
ipt
A
uthor Man
uscr
ipt
A
uthor Man
uscr
population was male, as compared to more than 48% of all Ohioans. Also, only 72% of the study population was white compared to 80% of all Ohioans (US Census Bureau, 2013). The composition of the study population means that, relative to the total population of Ohio, those Medicaid-recipients accessing CBMH services have a disproportionately higher share of females and minorities. Individuals residing in urban Boards represented 42% of the sample. Of note is the fact that over 43% of the study population was enrolled in Medicaid through the ABD program for the entirety of FY 2010.
Table 3 results show the relationship between a Medicaid enrollees' diagnosis and their risk of encountering each benefit limit. What is particularly obvious is the risk posed to Medicaid enrollees who have a primary diagnosis of either schizophrenia or bipolar disorder for both the utilization limit and the expenditure limit without diagnosis adjustment. Medicaid enrollees with a diagnosis of schizophrenia have relative risk of more than seven times that of enrollees with adjustment disorders of encountering a utilization limit and more than 11 times that of enrollees with adjustment disorders of encountering the expenditure limit. The diagnosis adjusted limit ensures that each enrollee, regardless of diagnosis, has
approximately the same probability of encountering his/her respective limit, which explains why none of the relative risks for any other diagnosis is significantly different than
adjustment disorder.
Table 4 results show the expenditures above the limit in FY 2010 of the utilization limits and the two expenditure limits. It also shows the number of individuals affected by each limit had the limits been in place in FY 2010. The results indicate that expenditures above the limit and number of individuals exceeding a limit were comparable for all three policies. It also shows that unadjusted expenditure limit approach had the greatest amount of
expenditures above the limit.
Based on the results from both Table 3 and Table 4, we can also infer that the care patterns for individuals diagnosed with schizophrenia would be affected the most when the limit did not consider an individual's diagnosis. However, under the diagnosis-adjusted expenditure limit we find that individuals with less severe diagnoses contribute more to cost savings than when diagnosis is not taken into account. It is very important to note that Table 4 results are no more than upper bound on estimated savings in FY 2010. The analysis assumes that providers would not use their excess capacity to serve other clients or substitute alternative services.
Table 5 results examine the relative risk of exceeding a utilization or expenditure threshold based on diagnosis and disability status, adjusting for other variables. Table 5 results show that Medicaid enrollees with a primary diagnosis of either schizophrenia or bipolar disorder still have a significantly increased probability of exceeding the utilization and general expenditure limits than individuals with adjustment disorders, controlling for other variables. Also, when other factors, such as race and disability are considered, diagnosis-adjusted expenditure limits actually place individuals diagnosed with adjustment disorders at a relatively greater risk of exceeding a benefit limit than individuals diagnosed with
schizophrenia. Further, Table 5 results indicate that for the three limits simulated, controlling for gender, diagnosis, Board of residence, and Medicaid status, white individuals and older
A
uthor Man
uscr
ipt
A
uthor Man
uscr
ipt
A
uthor Man
uscr
ipt
A
uthor Man
uscr
individuals have a significantly increased risk of encountering a benefit limit than African-Americans and younger individuals.
Discussion
This study had three specific aims all related to understanding who is most likely to be affected by benefit limits: 1) to evaluate the state's policy of utilization limits, 2) to compare utilization limits to expenditure limits, 3) to contrast expenditure limits that adjust for diagnosis to those that do not. Our findings indicate that the state's policy does result in more care disruption for individuals diagnosed with SMI, schizophrenia in particular, than for those with less severe illnesses. We also find that the hypothetical expenditure limits that do not control for diagnosis had a greater disparity in consequences for those diagnosed with SMI. A more complete discussion is provided below.
For each of the three aims, we sought to understand the relationship between service needs and risk of encountering a benefit limit. For all three aims, we found that an individual's primary mental health diagnosis plays a significant role in influencing whether a Medicaid enrollee who accesses Medicaid-covered CBMH services is likely to exceed a benefit limit. Results in Table 3 are used to evaluate the state's utilization limit policy, as specified in Aim 1, and to compare utilization limits to the general expenditure limits, as specified in Aim 2. According to Table 3, a policy that uniformly caps expenditures or utilization of certain CBMH services poses a significant risk to individuals who are diagnosed either with schizophrenia or bipolar disorder.
To address Aim 3, we assessed the adequacy of diagnosis-adjustment in mitigating the relationship between need and the risk of encountering a benefit limit. This analysis is important and informative because it tells us whether the problem, that benefit limits achieve savings primarily from reducing care to those with greatest need, can be solved by the simple and straightforward strategy of setting the limits based on an individual's primary mental health diagnosis. Table 5 results show us that discrimination based on need still exists even when diagnosis is adjusted for in the setting of limits. Table 5 also shows that when controlling for Medicaid eligibility status (i.e., ABD vs. CFC), access, and demographic variables, the relationship between diagnosis and the risk of encountering a benefit limit is statistically significant. ABD Medicaid enrollment is found to be a positive predictor of encountering a benefit limit, but diagnosis-adjustment alone does not account for this. The study team did not control for this confounding in the construction of the diagnosis-adjusted limit because the goal was to test whether ABD risk was still significant when diagnosis was adjusted for. The results indicate that it was. If Medicaid status had been controlled for, it is possible that some other, unmeasured source of risk would still be present. However, the unmeasured source of risk would not be detectable based on the data used in the study.
It is of note that when these non-diagnosis factors are controlled for, schizophrenia alone appears to be negatively associated with encountering a diagnosis adjusted benefit limit. However, this result should not be taken to mean that Medicaid enrollees diagnosed with schizophrenia are at reduced risks of encountering a diagnosis-adjusted benefit limit. Table 3 clearly shows that the risk without control variables is almost identical among all diagnoses.
A
uthor Man
uscr
ipt
A
uthor Man
uscr
ipt
A
uthor Man
uscr
ipt
A
uthor Man
uscr
Rather, the relationship between schizophrenia and the risk of exceeding the diagnosis-adjusted limit in Table 5 is understandable due to the statistical confounding (Cohen et al., 2003; Pagano & Gauvreau, 2000) between having a primary diagnosis of schizophrenia and being enrolled in ABD Medicaid which is the result of an Social Security Administration-approved disability.
Diagnosis adjustment alone does not appear to eliminate the relationship between need and the risk of exceeding a benefit limit. The diagnosis adjusted expenditure limit still places ABD enrollees at increased risk of exceeding a benefit limit, relative to CFC enrollees. Therefore, diagnostic severity by itself is not a predictor of whether or not an enrollee will encounter a diagnosis adjusted limit, but other need factors still are. Until all measures of need can be adequately controlled for, benefit limits create the potential for some Medicaid enrollee sub-groups to be denied necessary care.
More generally, our analysis indicates that the structure of a benefit limit has a significant effect on which Medicaid enrollees will be likely affected. While utilization limits that cap, different Medicaid-covered CBMH services at different levels appear to be less
discriminatory based on diagnosis and disability status than general expenditure limits, diagnosis adjusted expenditure limits appear capable of reducing the need-based disparities caused by either of these limit types. Therefore, controlling for any need factor may be preferable to creating a universal limit without any risk adjustment.
It is important to note that our data only included Medicaid claims information, not individual medical records with detailed clinical information. Therefore, it was not possible to say with certainty which individuals were receiving unnecessary services and therefore construct an optimal limit based on that information. Prior research has shown that there are other approaches to cost containment besides limits, namely utilization review and
prospective payment. Utilization review refers to the practice of having the payer determine the need for a service prior to compensating the provider for it and has been used
successfully in medical settings (Feldstein, Wickizer, & Wheeler, 1988). Prospective payment refers to the practice of providing a set amount of compensation for all consumers based on their clinical condition. In Ohio, the SMHA has implemented a utilization review to determine needs based on a case-by-case basis. According to the utilization review process, a provider thinks can ask the SMHA to lift the benefit limit if the consumer's needs CPST and partial hospitalization services in excess of the established limits. Alternatively, prospective payment for mental health treatment is not considered feasible at this time due to the lack of a robust methodology for predicting mental health care needs prospectively for this class of illnesses (Frank, Glied, & McGuire, 2014). Therefore, we feel that at this time a prudent policy that takes into account the clinical needs of the most vulnerable populations represents the best opportunity to reduce costs while minimizing care reductions for those individuals most in need.
Limitations
Several limitations must be taken into account when reviewing this study. First, there were no limits in place during the period when the data was collected. Therefore, providers had no
A
uthor Man
uscr
ipt
A
uthor Man
uscr
ipt
A
uthor Man
uscr
ipt
A
uthor Man
uscr
incentive to try and find substitutable treatment practices that could allow them to provide care within limits. Second, the diagnoses were grouped by category. Within diagnostic categories, there were varying levels of severity, which if taken into account, may have offered improved potential for diagnosis (Steinwachs, 2013). In addition, the generalizability of these findings is limited due to the implementation of the Mental Health Parity and Addiction Equity Act and the Patient Protection and Affordable Care Act. These laws together require that states do not impose restrictive service limits on mental health in either their Children's Health Insurance Program, or Medicaid programs, or in their Medicaid Alternative Benefit Plans for individuals receiving Medicaid through federal expansion. The results are therefore not generalizable to those contexts. However, these laws do not preclude states from allowing limits in their Medicaid state plans or in their Managed Care
Organization administered Medicaid plans (Mann, 2013). In these situations, these results are relevant. The analysis is further limited due to the lack of available data on the way total service utilization in the publicly administered mental health system would change as a result of each proposed limit. We were not able to identify the amount of savings to be achieved by each approach. This lack of data limits the generalizability of the findings, as we are unsure if each approach is budget neutral. A final limiting factor is the selection of the 97th percentile. The selection of this percentile may have be considered arbitrary. We generated a robustness analysis by considering whether the results would have been different if the utilization and general expenditure limits were set at levels 10% higher or 10% lower. The results indicate that as the limits increase the proportion of individuals affected by the policy that are disabled or have a diagnosis of schizophrenia increases. Thus, higher limits have a greater proportional effect on individuals diagnosed with the most severe mental illnesses. This analysis further shows that individuals diagnosed with schizophrenia and those on ABD Medicaid exceed the benefit limits by a greater amount than either those covered by CFC Medicaid or those with other diagnoses. Future analysis will investigate what the consequences on care are for individuals with the most severe mental health diagnoses.
Implications for Future Research
Our findings point to some potential policy implications that need further research. This study points to the importance of integrating evidence-based practice guidelines into any system of limiting service coverage. The only way to truly be sure that limits are set at levels that will allow for adequate care is to have a very clear understanding of what adequate care may be in all circumstances. By working with psychiatrists, therapists, case managers and other behavioral health specialists, research could provide information on how need-adjusted benefit limits can be accompanied by practice recommendations that help providers to meet their consumer's needs. Research could also examine the long-term impact of limiting services to specific populations by measuring specific outcomes, such as quality of life, changes in symptom severity, use of crisis services, and functionality. Also, the research could examine if and how CBMH service utilization may have shifted away from CMBH providers to those practitioners that are not considered to be CBMH providers but deliver mental health treatment in primary care/emergency settings which are not subject to the limitations.
A
uthor Man
uscr
ipt
A
uthor Man
uscr
ipt
A
uthor Man
uscr
ipt
A
uthor Man
uscr
Another policy implication that should be explored is how Boards and CBMH providers develop strategies to substitute services for individuals approaching the limits. Local infrastructure may need to be adapted to accommodate service needs within the context of limits. Future research could provide administrators and mental health professionals with a better understanding of the challenges and resources needed to sustain necessary care in the context of benefit limits.
Acknowledgments
This project was funded by Ohio Department of Medicaid, the Ohio Department of Mental Health and Addiction Services, the Medicaid Technical Assistance and Policy Program, and the Ohio State University College of Public Health. Additional funding for Dr. Olesiuk was provided by Grant No. 5T32MH019117-25 from the National Institutes of Mental Health. The contents of this article are solely the responsibility of the authors and do not necessarily represent the official view of the Ohio Department of Mental Health and Addiction Services and the Ohio Department of Medicaid. The authors wish to thank Dr. Sandra Tanenbaum, Dr. Thomas Wickizer, Dr. Kraig Knudsen, Timothy Sahr, Liping Xin, and Terry Jones for their assistance with this project.
Works Cited
Andersen R, Newman JF. Societal and Individual Determinants of Medical Care Utilization in the United States. The Milbank Memorial Fund Quarterly Health and Society. 1973; 51(1):95–124. DOI: 10.2307/3349613 [PubMed: 4198894]
Cohen, J.; Cohen, P.; West, S.; Aiken, L. Applied Multiple Regression - Correlation Analysis for the Behavioral Sciences. Lawrence Erlbaum Associates; Incorporated: 2003.
Feldstein PJ, Wickizer TM, Wheeler JR. Private cost containment. The effects of utilization review programs on health care use and expenditures. The New England Journal of Medicine. 1988; 318(20):1310–1314. DOI: 10.1056/NEJM198805193182006 [PubMed: 3129660]
Frank RG, Glied SA, McGuire TG. Paying for early interventions in psychoses: A three-part model. Psychiatric Services. 2014; doi: 10.1176/appi.ps.201400076
Frank RG, McGuire TG. Savings from a Medicaid carve-out for mental health and substance abuse services in Massachusetts. Psychiatric Services. 1997; 48(9):1147–1152. [PubMed: 9285974] Hodgkin D, Horgan CM, Garnick DW, Merrick EL. Benefit Limits for Behavioral Health Care in
Private Health Plans. Administration and Policy in Mental Health and Mental Health Services Research. 2009; 36(1):15–23. DOI: 10.1007/s10488-008-0196-5 [PubMed: 19037721] Hogan MF. Perspective: Public-Sector Mental Health Care: New Challenges. Health Affairs. 1999;
18(5):106–111. DOI: 10.1377/hlthaff.18.5.106 [PubMed: 10495596]
Human J, Wasem C. Rural mental health in America. American Psychologist. 1991; 46(3):232–239. DOI: 10.1037/0003-066X.46.3.232 [PubMed: 2035933]
Kaiser Commission on Medicaid and the Uninsured. American Recovery and Reinvestment Act (ARRA): Medicaid and Health Care Provisions. 2009 Mar 4. Retrieved from http://kff.org/ medicaid/fact-sheet/american-recovery-and-reinvestment-act-arra-medicaid/
Leaf PJ, Bruce ML, Tischler GL, Freeman DH, Weissman MM, Myers JK. Factors Affecting the Utilization of Specialty and General Medical Mental Health Services. Medical Care. 1988; 26(1): 9–26. DOI: 10.2307/3765237 [PubMed: 3336249]
Mann, C. RE: Application of the Mental Health Parity and Addiction Equity Act to Medicaid MCOs, CHIP, and Alternative Benefit (Benchmark) Plans. 2013 Jan 16. Retrieved from http://
www.medicaid.gov/Federal-Policy-Guidance/downloads/SHO-13-001.pdf
McNutt LA, Wu C, Xue X, Hafner JP. Estimating the Relative Risk in Cohort Studies and Clinical Trials of Common Outcomes. American Journal of Epidemiology. 2003; 157(10):940–943. DOI: 10.1093/aje/kwg074 [PubMed: 12746247]
National Bureau of Economic Research. U.S. business cycles expansions and contractions. 2010. Retrieved April 4, 2013, from http://www.nber.org/cycles.html
Office of Management and Budget. Revised delineations of metropolitan statistical areas, micropolitan statistical areas, and combined statistical areas, and guidance on uses of the delineations of these
A
uthor Man
uscr
ipt
A
uthor Man
uscr
ipt
A
uthor Man
uscr
ipt
A
uthor Man
uscr
areas (OMB Bulletin No. 13-01). Office of Management and Budget. 2013 Feb 28. Retrieved from
http://www.whitehouse.gov/sites/default/files/omb/bulletins/2013/b-13-01.pdf
The Ohio Department of Mental Health. Multi-Agency Community Services Information System Data Mart. 2012. Retrieved May 16, 2014, from http://macsisdatamart.mh.state.oh.us/
Olesiuk, W.; Sweeney, HA.; Seiber, E.; Tanenbaum, S.; Tam, K. An Appraisal of the Impact of Utilization Limits on Costs of and Access to Community-Based Mental Health Care in Ohio. Columbus, OH: The Ohio Department of Mental Health and Addiction Services; 2013. Pagano, M.; Gauvreau, K. Principles of Biostatistics. 2nd. Duxbury/Thomson Learning; 2000. Petersen, C. Medicaid: The Federal Medical Assistance Percentage (FMAP). Congressional Research
Service; 2010. p. 1-20.No. RL32950Retrieved from http://www.ncsl.org/documents/health/ MAFMAP.pdf
Plouck, T. [Accessed 11 May 2015] Ohio Department of Mental Health (ODMH): Budget Testimony Testimony before the House Health Human Services Subcommittee of Finance, § House Health Human Services Subcommittee of Finance. 2011. Retrieved from http://
www.theohiocouncil.org/pdf/OCHEADLINES/4-1-11_odmhtestimony-house-20110331.pdf
Salkever DS, Shinogle J, Goldman H. Mental Health Benefit Limits and Cost Sharing Under Managed Care: A National Survey of Employers. Psychiatric Services. 1999; 50(12):1631–1633. [PubMed: 10577886]
Smith, VK.; Gifford, K.; Ellis, E.; Rudowitz, R.; Snyder, L. Moving Ahead Amid Fiscal Challenges: A Look at Medicaid Spending, Coverage and Policy Trends Results from a 50-State Medicaid Budget Survey for State Fiscal Years 2011 and 2012. Kaiser Commission on Medicaid and the Uninsured; 2011. No. 8248Retrieved from http://kff.org/medicaid/report/moving-ahead-amid- fiscal-challenges-a-look-at-medicaid-spending-coverage-and-policy-trends-results-from-a-50-state-medicaid-budget-survey-for-state-fiscal-years-2011-and-2012/
StataCorp. Stata Statistical Software: Release 11. College Station, TX: StataCorp LP; 2009. Steinwachs, D. Per Case Payment for Psychiatric Admissions: Improving APR-DRGs and Policy
Implications; Presented at the Academy Health Annual Research Meeting; Baltimore, MD. 2013 Jun 25. Retrieved from http://academyhealth.org/files/2013/tuesday/steinwachs.pdf
The Ohio Department of Mental Health. Multi-Agency Community Services Information System Data Mart. n.dRetrieved May 16, 2014, from http://macsisdatamart.mh.state.oh.us/
U.S. Agency for Health Care Research and Quality. Appendix A - Clinical Classification Software-DIAGNOSES (January 1980 through September 2013). 2013 Mar 8. Retrieved May 16, 2014, from http://www.hcup-us.ahrq.gov/toolssoftware/ccs/AppendixASingleDX.txt
US Census Bureau. Ohio QuickFacts from the US Census Bureau. US Census Bureau; 2013 Jun 27. Retrieved from http://quickfacts.census.gov/qfd/states/39000.html
Zuvekas SH, Banthin JS, Selden TM. Mental health parity: what are the gaps in coverage? The Journal of Mental Health Policy and Economics. 1998; 1(3):135–146. DOI: 10.1002/
(SICI)1099-176X(1998100)1:3<135∷AID-MHP17>3.0.CO;2-S [PubMed: 11971153]
A
uthor Man
uscr
ipt
A
uthor Man
uscr
ipt
A
uthor Man
uscr
ipt
A
uthor Man
uscr
A
uthor Man
uscr
ipt
A
uthor Man
uscr
ipt
A
uthor Man
uscr
ipt
A
uthor Man
uscr
ipt
Table 1
Summary of Benefit Limits to Be Compared
Utilization Limits (Ohio's Policy)
Community Psychiatric Supportive Therapy (CPST) 104 Hours/Year
Behavioral Health Counseling 52 Hours/Year
Pharmacy Management 24 Hours/Year
Partial Hospitalization 60 Days/Year
Diagnostic Assessment By a Physician 2 Hours/Year*
Diagnostic Assessment By a Non-Physician 4 Hours/Year*
*Not included in the simulated utilization limit
Expenditure Limit
97th Percentile for Continuous Medicaid Beneficiaries $9,354.61/ Year
Diagnosis Adjusted Expenditure Limit
Schizophrenia $16,153.76/Year
Anxiety $5,378.86/Year
Adjustment $5,276.99/Year
Disruptive and ADHD $6,068.09/Year
Depression $7,024.08/Year
Mood $6,616.75/Year
Other Disorder $6,984.31/Year
A
uthor Man
uscr
ipt
A
uthor Man
uscr
ipt
A
uthor Man
uscr
ipt
A
uthor Man
uscr
ipt
Table 2
Sample Characteristics
Sample Size 139517
Mean Age 39.7 (sd =12.3)
Schizophrenia 16.9% (n=24,062)
Bipolar Disorder 17.9% (n=25,842)
Adjustment Disorder 10.7% (n= 14,581)
Anxiety 7.1% (n=9,950)
Depression 32.4% (n= 44,886)
ADHD and Other Behavioral Disorders 1.7% (n=2,284)
Mood 5.4% (n= 7,683)
Other Diagnosis 7.9% (n= 10,229)
Full Year – ABD Medicaid 43.1% (n=60,089)
Full Year – CFC Medicaid 26.2% (n = 36,561)
Full Year Medicaid – Part-Year ABD/Part-Year CFC 1.7% (n = 2,363)
Full Year Medicaid – Program Unknown 0.2% (n = 259)
Partial Year ABD Medicaid only 15.0% (n = 20,887)
Partial Year CFC Medicaid only 12.3% (n = 17,140)
Partial Year Medicaid – Part-Year ABD/Part-Year CFC 0.7% (n = 953)
Partial Year Medicaid – Program Unknown 0.9% (n = 1,265)
Male 35.3% (n= 49,200)
White, non–Hispanic 72.4% (n= 100,989)
African American 22.6% (n= 31,552)
Hispanic-Latino 0.6% (n= 762)
Native American/Pacific Islander 0.3% (n= 430)
Asian 0.2% (n= 303)
Multiracial 2.6% (n= 3,598)
Unknown/Missing 1.3% (n=1,872)
Urban 42.3% (n=58,989)
Mid-size Urban 28.4% (n=39,685)
A
uthor Man
uscr
ipt
A
uthor Man
uscr
ipt
A
uthor Man
uscr
ipt
A
uthor Man
uscr
ipt
Table 3
Risk Ratios of Exceeding Limits with Diagnostic Predictors Only
Diagnosis
Utilization Limits (SE) (N= 139517, DF=139509)
Expenditure Limits (SE) (N= 139517, DF=139509)
Diagnosis Adjusted Expenditure Limits (SE) (N= 139517, DF=139509)
Adjustment Disorder 1.00 (ref) 1.00 (ref) 1.00 (ref)
Schizophrenia 7.38 (0.587)*** 11.04 (1.065)*** 1.03 (0.066)
Anxiety 1.02 (0.122) 1.07 (0.155) 1.07 (0.084)
Other Diagnosis 1.59 (0.167)*** 1.71 (0.217)*** 1.00 (0.079)
Disruptive Behavioral Disorder
and ADHD 1.52 (0.265)* 1.60 (0.335)*
1.00 (0.139)
Depression 1.42 (0.120)*** 1.66 (0.171)*** 1.01 (0.059)
Bipolar Disorder 2.44 (0.207)*** 2.97 (0.305)*** 1.00 (0.064)
Mood Disorders 1.34 (0.160)* 1.49 (0.211)** 0.97 (0.085)
* P<.05,
** P<.01,
A
uthor Man
uscr
ipt
A
uthor Man
uscr
ipt
A
uthor Man
uscr
ipt
A
uthor Man
uscr
ipt
Table 4
Expenditures and Number of Individuals Exceeding Each Benefit Limit
Medicaid & Partial Medicaid Population
Utilizations Limits Unadjusted Expenditure Limit Diagnosis Adjusted Expenditure Limits
Total 139,517 4,135 3,646 3,631
Total Expenditures Over Limits
$17,529,288.00 $20,423,354.00 $17,044,315.00
Average Expenditure Over Limits
A
uthor Man
uscr
ipt
A
uthor Man
uscr
ipt
A
uthor Man
uscr
ipt
A
uthor Man
uscr
ipt
Table 5
Risk Ratios of Exceeding Limits with Need, Predisposition and Enabling Factors
Utilization Limits (SE) (N=139506,
DF=139481)
Expenditure Limits (SE) (N=139506, DF=139481)
Diagnosis-Adjusted Expenditure Limits (SE) (N=139506, DF=139481)
Diagnosis (Ref: Adjustment Disorder)
Schizophrenia and Other Psychotic Disorders 3.77 (0.308)*** 5.26 (0.517)*** 0.51 (0.034)***
Anxiety 0.82 (0.097) 0.84 (0.121) 0.87 (0.068)
Other Diagnosis 1.19 (0.126) 1.23 (0.157) 0.76 (0.060)***
Disruptive Behavioral Disorder and ADHD 1.41 (0.248)* 1.44 (0.303) 0.94 (0.131)
Depression 1.01 (0.086) 1.13 (0.117) 0.71 (0.042)***
Bipolar Disorder 1.65 (0.141)*** 1.91 (0.197)*** 0.66 (0.042)***
Mood Disorders 1.09 (0.130) 1.18 (0.167) 0.80 (0.069)**
Medicaid Status (Ref: Full-year CFC)
Full Year – ABD Medicaid 3.38 (0.224)*** 4.76 (0.390)*** 3.90 (0.228)***
Full Year Medicaid – Part-Year ABD/Part-Year CFC 3.58 (0.438)*** 4.22 (0.610)*** 4.25 (0.458)***
Full Year Medicaid – Program Unknown 0.81 (0.573) 0.00 (0.000) 0.67 (0.475)
Partial Year ABD Medicaid only 2.44 (0.179)*** 3.07 (0.273)*** 2.71 (0.187)***
Partial Year CFC Medicaid only 0.22 (0.042)*** 0.14 (0.041)*** 0.26 (0.040)***
Partial Year Medicaid – Part-Year ABD/Part-Year CFC 2.27 (0.487)*** 3.23 (0.735)*** 3.23 (0.584)***
Partial Year Medicaid – Program Unknown 0.36 (0.146)* 0.56 (0.230)*** 0.38 (0.172)*
Age (10-Year Increments) 1.10 (0.015)*** 1.07 (0.016)*** 1.07 (0.016)***
Race (Ref: White, non-Hispanic)
African American 0.80 (0.031)*** 0.83 (0.033)*** 0.92 (0.039)*
Hispanic-Latino 0.46 (0.151)* 0.66 (0.196) 0.48 (0.159)*
Native American/Pacific Islander 0.58 (0.192) 0.60 (0.208) 0.88 (0.260)
Asian 0.63 (0.193) 0.60 (0.194) 0.57 (0.253)
Multiracial 0.67 (0.074)*** 0.76 (0.084)* 0.82 (0.091)
Unknown/Missing 0.80 (0.103) 0.73 (0.104)* 0.77 (0.119)
Geographic Area (ref: Rural County)
Midsize County 0.97 (0.042) 0.88 (0.041)** 0.78 (0.036)***
Urban County 1.08 (0.043) 1.06 (0.045) 1.13 (0.047)**
Male (vs. Female) 1.04 (0.033) 0.98 (0.033) 0.91 (0.032)*
* P<.05,
** P<.01,