A S S O C I A T I O N S T U D I E S A R T I C L E
Fine-mapping, novel loci identification, and SNP
association transferability in a genome-wide
association study of QRS duration in
African Americans
Daniel S. Evans
1,†,*, Christy L. Avery
2,†, Mike A. Nalls
3,†, Guo Li
4,
John Barnard
5, Erin N. Smith
6, Toshiko Tanaka
7, Anne M. Butler
2,
Sarah G. Buxbaum
8,9, Alvaro Alonso
10, Dan E. Arking
11, Gerald S. Berenson
12,
Joshua C. Bis
4, Steven Buyske
13, Cara L. Carty
14, Wei Chen
15,
Mina K. Chung
16,17,18, Steven R. Cummings
1, Rajat Deo
19, Charles B. Eaton
20,
Ervin R. Fox
21, Susan R. Heckbert
4,22,23, Gerardo Heiss
2, Lucia A. Hindorff
24,
Wen-Chi Hsueh
25, Aaron Isaacs
26,27, Yalda Jamshidi
28, Kathleen F. Kerr
29,
Felix Liu
30, Yongmei Liu
31, Kurt K. Lohman
31, Jared W. Magnani
32,
Joseph F. Maher
33, Reena Mehra
16,17,18, Yan A. Meng
34, Solomon K. Musani
35,
Christopher Newton-Cheh
34,36, Kari E. North
2,37, Bruce M. Psaty
4,22,23,38,
Susan Redline
39, Jerome I. Rotter
40, Renate B. Schnabel
41,
Nicholas J. Schork
42, Ralph V. Shohet
43, Andrew B. Singleton
3,
Jonathan D. Smith
44, Elsayed Z. Soliman
45, Sathanur R. Srinivasan
15,
Herman A. Taylor Jr.
33, David R. Van Wagoner
17, James G. Wilson
46,
Taylor Young
34, Zhu-Ming Zhang
45, Alan B. Zonderman
47,
Michele K. Evans
47, Luigi Ferrucci
7, Sarah S. Murray
48, Gregory J. Tranah
1,
Eric A. Whitsel
2,49, Alex P. Reiner
14,22, CHARGE QRS Consortium
50and
Nona Sotoodehnia
4,51,*
1
California Pacific Medical Center Research Institute, San Francisco, CA, USA,
2Department of Epidemiology,
Gillings School of Global Public Health, University of North Carolina, Chapel Hill, NC, USA,
3Laboratory of
Neurogenetics, National Institute on Aging, National Institutes of Health, Bethesda, MD, USA,
4Cardiovascular
Health Research Unit, Department of Medicine, University of Washington, Seattle, WA, USA,
5Department of
†
The authors wish it to be known that, in their opinion, the first three authors should be regarded as joint First Authors.
Received:April 11, 2016.Revised:August 3, 2016.Accepted:August 19, 2016
VCThe Author 2016. Published by Oxford University Press.
All rights reserved. For Permissions, please email: [email protected]
4350 doi: 10.1093/hmg/ddw284
Quantitative Health Sciences, Lerner Research Institute, Cleveland Clinic, Cleveland, OH, USA,
6Department of
Pediatrics and Rady Children’s Hospital, University of California at San Diego, School of Medicine, La Jolla, CA,
USA,
7Translational Gerontology Branch, National Institute on Aging, National Institutes of Health, Baltimore,
MD, USA,
8Center of Excellence in Minority Health and Health Disparities, Jackson State University, Jackson,
MS, USA,
9Department of Epidemiology and Biostatistics, Jackson State University School of Public Health
(Initiative), Jackson, MS, USA,
10Department of Epidemiology, Rollins School of Public Health, Emory University,
Atlanta, GA, USA,
11McKusick-Nathans Institute of Genetic Medicine, Johns Hopkins University School of
Medicine, Baltimore, MD, USA,
12Department of Medicine and Cardiology, Tulane University, New Orleans, LA,
USA,
13Department of Statistics and Biostatistics and Department of Genetics, Rutgers University, Piscataway,
NJ, USA,
14Division of Public Health Sciences, Fred Hutchinson Cancer Research Center, Seattle, WA, USA,
15
Department of Epidemiology, Tulane University, New Orleans, LA, USA,
16Department of Cardiovascular
Medicine, Heart and Vascular Institute, Cleveland Clinic, Cleveland, OH, USA,
17Department of Molecular
Cardiology, Lerner Research Institute, Cleveland Clinic, Cleveland, OH, USA,
18Cleveland Clinic Lerner College
of Medicine of Case Western Reserve University, Cleveland, OH, USA,
19Division of Cardiovascular Medicine,
University of Pennsylvania, Philadelphia, PA, USA,
20Departments of Family Medicine and Epidemiology, Alpert
Medical School, Brown University, Providence, RI, USA,
21Department of Medicine, Division of Cardiovascular
Disease, University of Mississippi Medical Center, Jackson, MS, USA,
22Department of Epidemiology, University
of Washington, Seattle, WA, USA,
23Group Health Research Institute, Group Health Cooperative, Seattle, WA,
USA,
24National Institutes of Health, National Human Genome Research Institute, Office of Population
Genomics, Bethesda, MD, USA,
25Phoenix Epidemiology and Clinical Research Branch, National Institute of
Diabetes and Digestive and Kidney Diseases, National Institutes of Health, Phoenix, AZ, USA,
26Genetic
Epidemiology Unit, Department of Epidemiology, Erasmus University Medical Center, Rotterdam, the
Netherlands,
27CARIM School for Cardiovascular Diseases, Maastricht Centre for Systems Biology (MaCSBio),
Dept. of Biochemistry, Maastricht University, Maastricht, the Netherlands,
28Cardiogenetics Lab, Institute of
Cardiovascular and Cell Sciences, St George’s University of London, UK,
29Department of Biostatistics, School of
Public Health, University of Washington, Seattle, WA, USA,
30Department of Epidemiology and Biostatistics,
University of California, San Francisco, CA, USA,
31Department of Epidemiology and Prevention, Division of
Public Health Sciences, Wake Forest University, Winston-Salem, NC, USA,
32Department of Medicine, Division
of Cardiology, University of Pittsburgh Medical Center Heart and Vascular Institute, University of Pittsburgh,
Pittsburgh, PA, USA,
33Department of Medicine, University of Mississippi Medical Center, Jackson, MS, USA,
34
Program for Medical and Population Genetics, Broad Institute of Harvard and Massachusetts Institute of
Technology, Cambridge, MA, USA,
35Jackson Heart Study, University of Mississippi Medical Center, Jackson, MS,
USA,
36Cardiovascular Research Center and Center for Human Genetic Research, Massachusetts General
Hospital and Harvard Medical School, Boston,MA, USA,
37Carolina Center for Genome Sciences, University of
North Carolina, Chapel Hill, NC, USA,
38Department of Health Services, University of Washington, Seattle, WA,
USA,
39Department of Medicine, Division of Sleep Medicine, Brigham and Women’s Hospital, Harvard Medical
School, Boston, MA, USA,
40Institute for Translational Genomics and Population Sciences, Los Angeles
Biomedical Research Institute and Departments of Medicine and Pediatrics, Harbor-UCLA Medical Center,
Torrance, CA, USA,
41University Heart Center Hamburg and German Center for Cardiovascular Research,
Hamburg, Germany,
42J. Craig Venter Institute, San Diego, CA, USA,
43Center for Cardiovascular Research, John
A. Burns School of Medicine, University of Hawaii, Honolulu, HI, USA,
44Department of Cellular and Molecular
Medicine, Cleveland Clinic, Cleveland, OH, USA,
45Epidemiological Cardiology Research Center (EPICARE),
Department of Epidemiology and Prevention, Division of Public Health Sciences, Wake Forest School of
Medicine, Winston-Salem, NC, USA,
46Department of Physiology and Biophysics, University of Mississippi
Medical Center, Jackson, MS, USA,
47Laboratory of Epidemiology and Population Science, National Institute on
Aging, National Institutes of Health, Baltimore, MD, USA,
48Department of Pathology, University of California
San Diego, La Jolla, CA, USA,
49Department of Medicine, School of Medicine, University of North Carolina,
Chapel Hill, NC, USA,
50Membership of the CHARGE QRS Consortium is provided in the acknowledgements and
51
Division of Cardiology, University of Washington, Seattle, WA, USA
*To whom correspondence should be addressed at: Daniel S. Evans, Mission Hall: Global Health & Clinical Sciences Building, 550 16thStreet, 2ndfloor, Box
Nona Sotoodehnia, Metropolitan Park East Tower, 1730 Minor Ave, Suite 1360, Seattle, WA 98101, USA. Tel: 206-221-7775; Fax: 206-221-2662; Email: [email protected]
Abstract
The electrocardiographic QRS duration, a measure of ventricular depolarization and conduction, is associated with cardiovascular mortality. While single nucleotide polymorphisms (SNPs) associated with QRS duration have been identified at 22 loci in
populations of European descent, the genetic architecture of QRS duration in non-European populations is largely unknown. We therefore performed a genome-wide association study (GWAS) meta-analysis of QRS duration in 13,031 African Americans from ten cohorts and a transethnic GWAS meta-analysis with additional results from populations of European descent. In the African American GWAS, a single genome-wide significant SNP association was identified (rs3922844,P¼41014
) in intron 16 ofSCN5A, a voltage-gated cardiac sodium channel gene. The QRS-prolonging rs3922844 C allele was also associated with decreasedSCN5A RNA expression in human atrial tissue (P¼1.1104). High density genotyping revealed that theSCN5Aassociation region in African Americans was confined to intron 16. Transethnic GWAS meta-analysis identified novel SNP associations on chromo-some 18 inMYL12A(rs1662342,P¼4.9108) and chromosome 1 nearCD1EandSPTA1(rs7547997,P¼7.9109). The 22 QRS loci previously identified in populations of European descent were enriched for significant SNP associations with QRS duration in African Americans (P¼9.9107), and index SNP associations in or nearSCN5A,SCN10A,CDKN1A,NFIA,HAND1,TBX5and SETBP1replicated in African Americans. In summary, rs3922844 was associated with QRS duration andSCN5Aexpression, two novel QRS loci were identified using transethnic meta-analysis, and a significant proportion of QRS–SNP associations discovered in populations of European descent were transferable to African Americans when adequate power was achieved.
Introduction
The QRS duration, measured by the surface electrocardiogram (ECG), reflects depolarization and conduction of the electrical sig-nal throughout the ventricular myocardium. Longer QRS duration is associated with an increased risk of cardiovascular (CV) mortal-ity in Caucasians and all-cause mortalmortal-ity in African Americans from study populations unselected for specific CV disorders (1,2). Among patients hospitalized for heart failure with reduced left ventricular ejection fraction, prolonged QRS duration (120 milli-seconds) is associated with post-discharge all-cause mortality (3). The QRS duration has been reported to be shorter in African Americans compared to Caucasians, even after taking into ac-count cardiovascular risk factors and coronary heart disease (4–6).
Prior genome-wide association (GWA) studies of QRS duration performed in populations of European descent have identified 22 independent QRS loci (7,8). The genetic architecture of QRS dura-tion among African Americans, by contrast, is largely unknown. Expanding GWA studies to populations of African descent holds the potential to refine association regions due to shorter-range linkage disequilibrium (LD) and to discover novel genetic associa-tions given the presence of population-specific allele frequencies (9,10). We therefore performed a GWAS meta-analysis of QRS du-ration in a total of 13,031 African Americans from 10 cohort stud-ies in order to: (1) fine-map the QRS association regions previously identified among those of European descent; (2) discover novel QRS loci through a meta-analysis of results from African American cohorts as well as a transethnic meta-analysis; (3) deter-mine whether SNP associations with QRS duration discovered in populations of European descent are transferable to African Americans.
Results
GWAS meta-analysis of QRS duration in African Americans
We conducted a meta-analysis of 2,955,816 autosomal SNPs in 13,031 African Americans from 10 GWA studies of QRS
duration (Supplementary Materials, Tables S1 and S2),with little evidence of genomic inflation in the individual cohorts (Supplementary Materials, Figs S1–S10 and Table S1) or the meta-analysis (Supplementary Material, Fig. S11,k¼1.027). The percentage of European genetic ancestry was similar across the cohorts (Supplementary Material, Table S2) and was not signifi-cantly associated with QRS duration (Supplementary Material, Table S3).
A single SNP, rs3922844 (MAF¼0.42), in intron 16 of the cardiac sodium channel gene SCN5A, was associated with QRS duration among African Americans at the genome-wide significance threshold (b6SE¼0.94 ms60.12 ms, P¼41014) (Table 1, Fig. 1 and Supplementary Material, Fig. S12). Adjustment for local ancestry minimally altered the associa-tion (Table 1). We fine-mapped the SCN5A-SCN10A region surrounding this signal by examining SNPs genotyped using the MetaboChip array in ARIC and WHI PAGE participants and imputed in the WHI SHARE participants (11). In the meta-analysis of the three cohorts, a second SNP in intron 16 of SCN5A, rs12635898, was in high LD with rs3922844 (HapMap YRI: r2¼0.93, Table 2) and was similarly associated with QRS duration (Table 2). Furthermore, LD was low (1000 Genomes AFR population r2¼0.03) between rs3922844 and rs7626962, an SCN5A missense mutation (S1103Y) associated with cardiac conduction and arrhythmias that is common in African Americans but rare in populations of European descent (12–15).
SNP functional annotation and association with SCN5A expression in human cardiac tissue
Functional annotation indicated that rs3922844 and variants in LD (1000 Genomes AFR populationr20.2) overlapped and were near regulatory genomic features. These variants altered tran-scription factor binding motifs and overlapped with DNAse I hy-persensitive sites (DHS) (Supplementary Material, Table S4). In multiple cell types, rs3922844 was located near a cluster of tran-scription factor binding events and a peak of Histone H3 Lysine
4 mono-methylation, a marker of putative enhancers (Supplementary Material, Fig. S13). Rs3922844 and variants in LD overlapped with DHS and enhancer histone marks in fetal heart tissue based on data from the Roadmap Epigenomics Mapping Consortium (Supplementary Materials, Table S4 and Fig. S14).
We next assessed the functional relevance of rs3922844 by examining its association withSCN5ARNA expression levels in human cardiac tissue. The rs3922844 C allele associated with Figure 1.Regional association plot atSCN5A/SCN10Alocus. African American SNP association meta-analysis results are plotted in the top panel, and meta-analysis re-sults from cohorts of European ancestry are plotted in the bottom panel. The AA index SNP (rs3922844) is designated by a red diamond in both panels. The LD (r2)
shown is relative to the AA index SNP and is based on HapMap YRI in the top panel and HapMap CEU in the bottom panel. Gray circles are SNPs without HapMap LD data. The X-axis marks the chromosomal position. Recombination rates estimated from African Americans and HapMap CEU individuals are shown in the top and bot-tom panels, respectively. The dashed horizontal lines in the top and botbot-tom panels mark the GWAS significance level in African Americans (2.5108) and
longer QRS duration was also associated with lowerSCN5ARNA expression in left atrial appendage samples from 289 individ-uals of European ancestry (b6SE (units are RNA levels on log2 scale)¼-0.1160.03,P¼1.6103) and 40 individuals of African ancestry (b6SE¼-0.2960.11,P¼0.013), as well as in the meta-analysis across the two ethnic groups (b6SE¼ -0.1360.03, P¼1.1104
,Fig. 2).
Transethnic meta-analysis of QRS duration
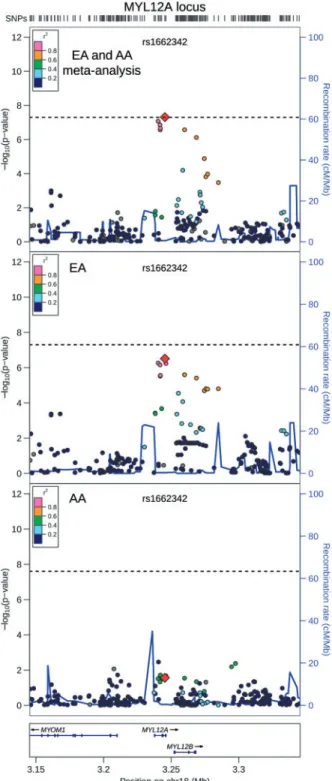
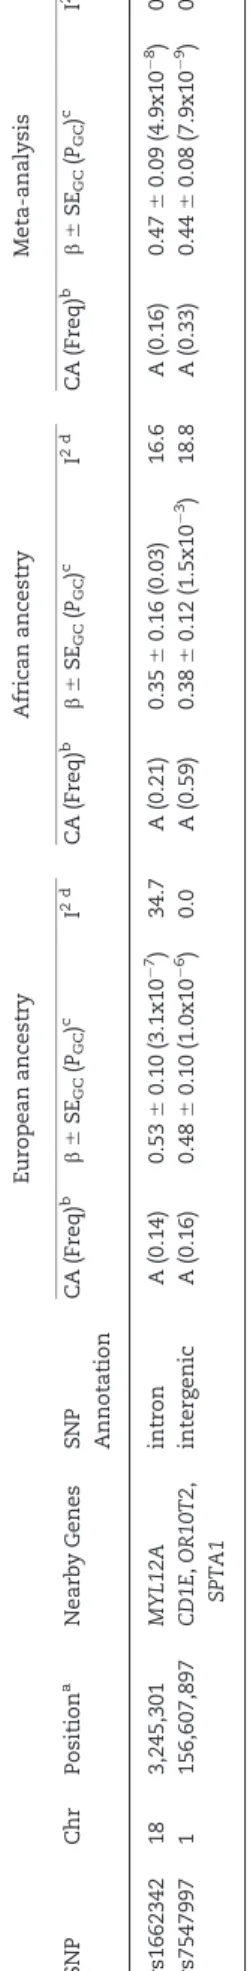
QRS duration GWAS results from 13,031 African Americans (re-ported above) and from 40,407 European-ancestry individuals in the previously reported CHARGE analysis (8) were meta-ana-lysed, with little evidence of genomic inflation (k¼1.018, Supplementary Material, Fig. S15). In addition to the previously identified QRS loci (Supplementary Materials, Fig. S16 and Table S5), the transethnic meta-analysis identified SNPs at two novel loci associated with cardiac ventricular conduction: an intronic SNP (rs1662342, P¼4.9108) in a myosin light chain regulatory gene, MYL12A, on chromosome 18 and an intergenic SNP (rs7547997,P¼7.9109) nearCD1Eon chromo-some 1 (Table 4, Figs 3 and 4). For both SNPs, the coded al-lele frequency was higher in African Americans than individuals of European ancestry (Table 4), indicating that the addition of African American participants may have pro-vided greater gains in power for these two SNPs than the addi-tion of an equivalent number of individuals of European ancestry.
We examined whether rs1662342 or rs7547997 were eQTLs in human left atrial appendage tissue. While the rs1662342 A allele was nominally associated with higher MYL12A RNA levels in the meta-analysis of results from 289 individuals of European ancestry and 40 individuals of African ancestry (b6SE¼0.0860.04,P¼0.03), the association was not significant after correction for multiple testing. Gene expression for only
two genes (CD1C and CD1E) was detected within 250 kb up-stream and downup-stream of rs7547997, and this SNP was not sig-nificantly associated with expression of either of these genes (P>0.05).
Gene set enrichment and transferability of QRS-associated loci and SNPs
A gene set enrichment analysis (GSEA) revealed that genes identified from the 22 European-descent QRS loci were enriched for significant SNP associations in the African American QRS meta-analysis results, suggesting the transferability of QRS as-sociations at the gene-set level between the two population groups. Gene-basedP-values for 9 of the 22 QRS loci were in the top 95thpercentile of all gene scores genome-wide in African Americans, whereas only one would be expected by chance, and the 22 QRS loci were significantly enriched for significant QRS-SNP associations in African Americans compared with ran-domly sampled gene sets (GSEA empirical P¼9.9107
). Importantly, the direction of the association was the same for all index SNPs at the 22 previously identified QRS loci in both ethnic groups, further supporting the transferability of associa-tions between those of European and African ancestry (Tables 3 and5,Supplementary Material, Table S6).
SNP association transferability atSCN5A/SCN10Alocus
The most significant SNP associations reported from previous GWA studies of QRS interval among other ethnic groups are similarly located on chromosome 3 at theSCN5A/SCN10Alocus, and multiple independent signals have been identified (Fig. 1) (7,8,16). The coded allele frequencies for all SCN5A/SCN10A European-ancestry index SNPs were lower among African Americans than individuals of European ancestry, which along with the smaller sample size among the African Americans we
Table 1.Association results for rs3922844 with and without adjustment for local ancestry estimates
Assay Adjusted for global ancestryd Adjusted for local ancestryd,e
Study (G/I)a CAFb n
b6SEGC PGC b6SEGC PGC
WHI I 0.42 4012 0.8660.21 6x10⁵ 0.9060.23 3x10⁵
ARIC I 0.41 2372 0.6160.28 0.03 0.6860.29 0.02
JHS I 0.40 1918 1.4160.32 1x10⁵ 1.4060.33 2x10⁵
MESA I 0.43 1554 1.0260.36 0.005 1.1760.38 0.002
Health ABC G 0.43 993 0.9860.47 0.04 0.9960.50 0.05
HANDLS G 0.41 945 0.9660.43 0.03 0.8560.45 0.06
CHS G 0.44 621 0.8460.56 0.13 ND ND
CFS I 0.39 315 0.1660.80 0.84 0.2160.82 0.80
BLSA G 0.44 153 3.2760.99 9x10⁴ ND ND
BHS G 0.42 147 1.1461.27 0.37 ND ND
Meta-analysis
All studies 0.42 12,877 0.9460.12 4x10¹⁴ – –
LA studiesc 0.42 12,109 0.9160.13 3x10¹³ 0.9560.13 7x10¹³
aG¼directly genotyped SNP, I¼imputed SNP.
bCoded allele frequency. C and T are the coded and non-coded alleles for rs3922844, respectively. CAF for the meta-analysis is the weighted average across the 10
cohorts.
cStudies with local ancestry (LA) estimates: WHI, ARIC, JHS, MESA, Health ABC, HANDLS, and CFS. dband SE expressed in units of milliseconds.
examined, reduces power to replicate (Table 3). Of the 4 inde-pendent European descent QRS index SNPs with adequate power (80%) to replicate among African Americans, 2 were sig-nificant, including the top SNP-QRS association among individ-uals of European ancestry, rs6801957 (P¼8104among African Americans,Table 3).
The absence of genome-wide significant QRS associations among SNPs withinSCN10Ain African Americans does not ap-pear to be due to a difference in the MAF distribution ofSCN10A SNPs between populations of European and African descent (Supplementary Material, Table S7). Compared to populations of European descent (Supplementary Material, Fig. S17), LD was re-duced and haplotypes were shorter in the SCN10Aregion in populations of African descent (Supplementary Materials, Figs S18 and S19), which could impact the ability for assayed SNPs to tag potential non-genotyped causal variants.
SNP association transferability at the remaining known QRS loci
At the remaining 21 QRS loci (7,8), there was adequate power (80%) to replicate European-ancestry index SNPs at 8 loci, and index SNPs at 4 of these 8 loci replicated in African Americans at the multiple-testing corrected significance threshold of P¼0.002 (CDKN1A,NFIA,HAND1 andTBX5,Table 5, binomial testP¼4104). Of the 13 loci where there was not adequate power to replicate, a European-ancestry index SNP at one locus replicated in African Americans (SETBP1, Supplementary Material, Table S6). At the more liberal replication significance threshold of 0.05, European-ancestry index SNPs at 5 of the 8 loci with adequate power replicated (binomial testP¼2105), and index SNPs at 7 of the 13 loci without adequate power repli-cated (binomial test P¼1106) (Table 5 and Supplementary Material, Table S6).
We next expanded our characterization of each of the 22 European-ancestry QRS loci to identify the most significant SNP association with QRS duration among African Americans (African-American index SNPs) and to determine the LD be-tween European and African-ancestry index SNPs. Other than SCN5A, two other loci (TBX5 and NFIA) contained African-ancestry index SNPs that passed the significance threshold for discovery (P1.4105) within the 22 QRS loci (Table 5). The African-ancestry index SNP associations in TBX5 (rs7312625) andNFIA(rs2207791) replicated at the genome-wide significance level in populations of European descent (Table 5). For both loci, our results did not provide evidence for allelic heterogeneity, as the African-ancestry index SNPs were in moderate LD with the European-ancestry index SNPs (HapMap ASWr20.65, HapMap CEU r20.5) (Table 5, Supplementary Materials, Fig. S20 and S21).
Fine-mapping intervals based on Bayes factors and the re-sulting posterior probabilities generated from a transethnic meta-analysis with MANTRA (17) were constructed at the 22 QRS loci previously identified in populations of European de-scent and the two new QRS loci reported here. At each locus, the 95% credible set (CS) defines the genomic boundary that contains the smallest set of SNPs accounting for 95% of the pos-terior probability (Supplementary Material, Table S8). Other than the loci at which the 95% CS contained a single SNP, the largest percentage decrease from the genome-wide significant interval discovered in European populations to the 95% CS in the transethnic meta-analysis was at the TBX5 locus (Supplementary Material, Fig. S20).
Table
2.
Association
results
from
dense
SNP
genotyping
study
at
the
SCN5A
locus
Coded/Reference allele
(CAF)
ARIC
WHI
PAGE
WHI
SHARE
Meta-analysis
rs3922844 LD
(
r
2)
c
SNP
Position
a
n
b
6
SE
b(
P
)n
b
6
SE
b(
P
)n
b
6
SE
b(
P
)
b
6
SE
b(
P
)
rs12635898
38,601,069
A/C
(0.30)
2911
1.03
6
0.34
(0.002)
725
1.18
6
0.52
(0.02)
3283
1.04
6
0.24
(2x10
5)
1.05
6
0.19
(1x10
8)
0.93
aPosition
based
on
NCBI
ref
erence
sequence
build
36.
bb
and
SE
expressed
in
units
of
millisecond
s.
cLD
estimates
between
rs12635898
and
rs3922844
based
on
rs1263589
8
genot
ype
data
from
unrelated
YRI
sample
s
o
n
MetaboChip
arrays
used
in
the
PAGE
stud
y
and
rs3922844
genot
ype
data
from
unrelated
YRI
samples
down-loaded
from
HapMap
phase
2
Discussion
Our genetic association study of cardiac ventricular conduction among African Americans identified variants in a putative tran-scriptional regulatory region within intron 16 of the cardiac so-dium channelSCN5Athat were associated with QRS duration andSCN5ARNA levels. Furthermore, two novel loci associated with cardiac ventricular depolarization and conduction were identified through a transethnic GWAS meta-analysis. Finally, our study demonstrated the transferability of QRS-SNP associa-tions between populaassocia-tions of European and African-descent by both gene-set enrichment analysis as well as direct evaluation of top QRS-SNP associations.
A
B
Figure 2.Association between rs3922844 genotype andSCN5Aexpression in hu-man atrial tissue. Box plots display data from individuals of African ancestry (A) and European ancestry (B). Plotted along the Y-axis are RNA levels adjusted for covariates. The bottom and top of each box indicates the 25thand 75th
percen-tiles, and the band within the box is the median. Whiskers extend to the most extreme value or the most extreme value within 1.5*interquartile range (IQR), whichever value is closer to the median. The fitted regression line is shown in blue.
Figure 3. Regional association plot of transethnic meta-analysis results at
MYL12Alocus. Transethnic meta-analysis SNP association results are plotted in the top panel, meta-analysis results from cohorts of European ancestry are plot-ted in the middle panel, and African American SNP association meta-analysis results are plotted in the bottom panel. The transethnic index SNP (rs1662342) is designated by a red diamond in all panels. The LD (r2) shown is relative to the
in-dex SNP and is based on HapMap CEU in the top and middle panels and is based on HapMap YRI in the bottom panel. Gray circles are SNPs without HapMap LD data. The X-axis marks the chromosomal position. Recombination rates aver-aged across HapMap populations, in HapMap CEU individuals, and in African Americans are shown in the top panel, middle panel, and bottom panel, respec-tively. The dashed horizontal line in the top and middle panels marks the GWAS significance level for European ancestry (5.0108) and in the bottom
Figure 4.Regional association plot of transethnic meta-analysis results at chro-mosome 1q23.1. Transethnic meta-analysis SNP association results are plotted in the top panel, meta-analysis results from cohorts of European ancestry are plotted in the middle panel, and African American SNP association meta-analy-sis results are plotted in the bottom panel. The transethnic index SNP (rs7547997) is designated by a red diamond in all panels. The LD (r2) shown is
relative to the index SNP and is based on HapMap CEU in the top and middle panels and is based on HapMap YRI in the bottom panel. Gray circles are SNPs without HapMap LD data. The X-axis marks the chromosomal position. Recombination rates averaged across HapMap populations, in HapMap CEU in-dividuals, and in African Americans are shown in the top panel, middle panel, and bottom panel, respectively. The dashed horizontal line in the top and mid-dle panels marks the GWAS significance level for European ancestry (5.0108)
and in the bottom panel marks the GWAS significance level for African Americans (2.5108).
Table
4.
Novel
genome-wide
significant
SNP
associations
from
transethnic
meta-analysis
European
ancestry
African
ancestry
Meta-analysis
SNP
Chr
Position
a
Nearby
Genes
SNP Annotation
CA
(Freq)
b
b
6
SE
GC
(
PGC
)
c
I
2d
CA
(Freq)
b
b
6
SE
GC
(
PGC
)
c
I
2d
CA
(Freq)
b
b
6
SE
GC
(
PGC
)
c
I
2d
rs1662342
18
3,245,301
MYL12A
intron
A
(0.14)
0.53
6
0.10
(3.1x10
7)
34.7
A
(0.21)
0.35
6
0.16
(0.03)
16.6
A
(0.16)
0.47
6
0.09
(4.9x10
8)
0.0
rs7547997
1
156,607,897
CD1E
,
OR10T2
,
SPTA1
intergenic
A
(0.16)
0.48
6
0.10
(1.0x10
6)
0.0
A
(0.59)
0.38
6
0.12
(1.5x10
3)
18.8
A
(0.33)
0.44
6
0.08
(7.9x10
9)
0.0
aPosition
based
on
NCBI
reference
sequence
bu
ild
36.
bCA
¼
coded
effe
ct
allele.
Freq
¼
frequency.
cb
and
SE
expresse
d
in
units
of
mill
iseconds.
dHe
terogeneity
I
2statistics
bolded
if
the
Cochran’s
X
2P
-value
Our GWAS meta-analysis with additional fine-mapping identified two SNPs in high LD (rs3922844 and rs12635898, HapMap YRI:r2¼0.93) in intron 16 of the cardiac sodium chan-nelSCN5Agene associated with QRS duration among African Americans.SCN5Aencodes the pore-formingasubunit of the cardiac voltage-gated sodium channel Nav1.5, and opening of the Nav1.5 channel drives rapid membrane depolarization dur-ing the cardiac action potential (18). Common and rareSCN5A genetic variants have been associated with cardiac depolariza-tion, conducdepolariza-tion, and repolarization (7,8,19). The most signifi-cantly associated SNP identified in this study (rs3922844) has been previously shown to associate with atrioventricular con-duction (PR interval) among African Americans that included a subset of the same cohorts as this study (20,21), similar to other SNPs at this locus where variants that prolong PR interval also prolong QRS duration.
Functional annotation indicated that rs3922844 and other intronic variants in LD overlapped with a putative intronic transcriptional regulatory region. While functional intronic enhancers have not been identified inSCN5A, transcriptional enhancers are commonly found within intronic regions (22). Consistent with rs3922844’s overlap with putative transcrip-tional regulatory features, we found that rs3922844 was associated withSCN5Aexpression in human atrial tissue. The rs3922844 C allele associated with longer QRS duration was also associated with lowerSCN5ARNA expression in human cardiac tissue, supporting the hypothesis that fewer available Nav1.5 channels would lead to subtly slower depolarization and conduction in cardiac tissue. It is intriguing that both genome-wide significant SNPs were located within intron 16 of SCN5A, which is immediately adjacent to an alternative splic-ing event that skips exons 17 and 18, resultsplic-ing in the produc-tion of the non-funcproduc-tional Nav1.5b isoform that contains a partial deletion of the sixth transmembrane spanning segment of the DII domain and a deletion of a large segment of the intra-cellular DII-DIII linker (18). While the array-based expression data in our eQTL study did not enable our examination of spe-cific transcript isoforms, future studies could investigate this potential molecular consequence that could lead to an in-creased production of non-functional transcripts that would further reduce the number of functional Nav1.5 voltage-gated sodium channels.
Using a transethnic meta-analysis approach, two novel QRS loci were identified: one in the geneMYL12Aon chromosome 18 (rs1662342) and one in an intergenic region on chromosome one (rs7547997) near a cluster of fiveCD1genes. For both SNPs, the higher allele frequency in African Americans combined with the 13,031 additional sample size increased power to find asso-ciations in the transethnic meta-analysis.
While the association between intronic SNP rs1662342 and MYL12Agene expression did not pass multiple test correction, the nominal significance of the association provided suggestive evidence that rs1662342 could be associated withMYL12Agene expression.MYL12Aencodes the myosin regulatory light chain that binds to a variety of myosin heavy chain IIs (MHC IIs) in multiple cell types (23).MYL12Ais expressed in the heart and cardiac myocytes in humans (24). Knockdown ofMYL12A in mouse fibroblasts resulted in a significant reduction in cellular contractility, a disruption of cellular structure and morphology, and a decrease in non-muscle MHC II expression (23). The most significant SNP associations with RR interval in populations of European descent were located inMYH6, thea-heavy chain sub-unit of cardiac myosin (7,25), and the associations replicated in African Americans (26). Our results suggest that genetic
variation in a different component of myosin, myosin regula-tory light chain, may play a role in QRS duration.
The candidate gene for the second novel QRS locus is not as obvious, as rs7547997 was not associated with gene expression of nearby genes in our eQTL study. SNP rs7547997 is located within an intergenic region on chromosome one near a cluster of fiveCD1genes, which mediate lipid and glycolipid antigen presentation to T cells (27) and near a cluster of 15 olfactory re-ceptor genes (28).SPTA1, which encodesa-spectrin, is located 240 kb from rs7547997, but measures ofSPTA1RNA did not pass quality filters in our eQTL study and rs7547997’s association withSPTA1gene expression could not be determined. Spectrin, a tetramer composed ofa-bdimers, acts as an actin crosslinking and molecular scaffold protein that regulates cell shape and membrane protein localization (29). Spectrin binds ankyrin-G, and ankyrin-G is required for Nav1.5 membrane targeting and excitability (29). The E1053K SCN5A variant disrupts the ankyrin-G/Nav1.5 binding interaction and results in Brugada Syndrome (30). In mouse cardiomyocytes, b-spectrin co-localizes with ankyrin-G and Nav1.5 (31).b-spectrin also targets CaMKII to Nav1.5 where CaMKII regulates Nav1.5 by phosphory-lation (31). WhileSPTA1might be an attractive candidate gene, further studies are needed to identify causal gene(s) and vari-ant(s) in the novel QRS association region identified on chromo-some one.
Our transethnic meta-analysis results provide evidence that a large proportion of SNP and loci associations with QRS dura-tion are shared between populadura-tions of European and African descent. Gene-set enrichment analysis revealed that the 22 pre-viously reported European-descent QRS-associated loci were enriched for significant QRS-SNP associations among African Americans compared with randomly selected gene sets matched for gene set characteristics such as gene size and LD properties, which provided evidence for replication at the gene-set level. Where the power for replication was adequate, half of the European-descent index SNPs were also associated with QRS duration among African Americans. Even among the SNPs where power was inadequate, the majority were at least nomi-nally associated with QRS duration among African Americans. Furthermore, the direction of the association for all European-ancestry index SNPs was the same in both ethnic groups. While these results taken together provide evidence for the transfer-ability of QRS genetic associations from one ethnic group to an-other, there are some exceptions. There are SNPs associated with QRS duration among those of European descent, for in-stance rs9851724 nearSCN10A(Table 3) and rs4687718 inTKT (Table 5), where despite adequate power, no evidence for associ-ation was identified among African Americans.
have argued that synthetic associations might exist, but they are unlikely to account for most GWAS results (38,39). While a direct test of the synthetic association hypothesis requires a comprehensive collection of rare and common variants, our GWAS in African Americans provides an opportunity to test a prediction from the synthetic association hypothesis that SNP associations would not generalize across populations.
Well-powered studies for a limited number of traits and dis-eases have provided evidence that a majority of GWAS SNPs discovered in populations of European descent generalize to multiple populations (40–43). For instance, a high proportion of SNP associations with blood lipids discovered in populations of European descent generalized to populations of non-European descent (44,45), but allelic heterogeneity was observed at some loci (45,46). A recent systematic examination of GWAS SNP replication across populations found that 45.8% of GWAS SNPs initially identified in populations of European descent replicated in East Asian populations, and the percentage increased to 76.5% when replication attempts were limited to those that achieved sufficient power (47). The same study found that only 7 of 73 (9.6%) SNP associations replicated in populations of African descent, and the replication percentage only increased to 20% among the 25 replication attempts that achieved suffi-cient power (47). In an analysis of five traits and diseases in the Population Architecture Using Genomics and Epidemiology (PAGE) study, a consortium of multi-ancestry population-based studies, a significant proportion of GWAS SNPs discovered in European populations replicated in populations of European descent (43). However, the effect estimates in non-European populations tended to be closer to the null, especially in African Americans (43). Our analysis of SNP associations with QRS duration is consistent with findings from other traits; namely, SNP associations generalize at most loci but not all. GWA studies of ECG traits other than QRS duration have been conducted in African Americans, and SNP association transfer-ability has been found (13,20,21,26,48,49). In two large meta-analyses, the proportion of SNP associations that replicated in African Americans was 7 of 13 for RR interval and 10 of 22 for QT interval ata¼0.05 (26,48). While Dicksonet al. predicted that synthetic associations would be inconsistent across populations (37), results from our study and others indicate that a majority of SNP associations do generalize across popula-tions. Continuing to perform well-powered GWA studies in African Americans should reveal whether SNP associations for a variety of traits and conditions are transferable.
In conclusion, by conducting a GWAS meta-analysis of QRS duration in African Americans, we refined theSCN5A associa-tion region to a single intron, and the associated SNP rs3922844 was also associated with reducedSCN5Aexpression in human atrial tissue in individuals of African and European ancestry. Two novel genome-wide significant SNP associations in or near intriguing candidate genes (MYL12AandSPTA1) were identified using transethnic meta-analysis. In addition, the high propor-tion of QRS associapropor-tions that were transferable between popula-tions of European and African-descent indicated that, at many of the associated loci, common genetic variation shared across populations contributes to QRS duration.
Materials and Methods
Study samples and ECG recordings
The following ten cohorts with African American participants contributed to this study (in order of decreasing sample size):
the Women’s Health Initiative (WHI), the Atherosclerosis Risk in Communities (ARIC) study, the Jackson Heart Study (JHS), the Multi-Ethnic Study of Atherosclerosis (MESA), the Health, Aging, and Body Composition Study (Health ABC), the Healthy Aging in Neighborhoods of Diversity across the Life Span study (HANDLS), the Cardiovascular Health Study (CHS), the Cleveland Family Study (CFS), the Baltimore Longitudinal Study on Aging (BLSA) study, and the Bogalusa Heart Study (BHS). Detailed descriptions of the study samples and ECG recording methods are provided inSupplementary Material, Text S1. The European-descent participants and cohorts that contributed to this analysis have been previously described (8). The study was approved by the Institutional Review Board at all participating institutions. All individuals included in this analysis provided written informed consent.
Genotyping and genotype imputation
Cohorts used Affymetrix or Illumina SNP genotyping arrays and applied quality control filters to samples and SNPs (Supplementary Material, Table S1). Participants unlikely to be of African descent based on principal component analysis were excluded from the analysis (Supplementary Material, Text S1). Genotype imputation was performed using MACH or Beagle software. Individual studies performed genotype imputation us-ing reference haplotypes that consisted of either a mixture of phased haplotype data from HapMap 2 YRI and CEU in a 1:1 ra-tio or a combinara-tion of HapMap 2 YRI and CEU in a 1:1 rara-tio and HapMap 3 YRI, CEU, and ASW in a 1:1:1 ratio (Supplementary Material, Table S1). Detailed descriptions of genotyping meth-ods, quality control steps, and imputation methods can be found inSupplementary Materials, Text S1 and Table S1.
Genome-wide association analysis among African Americans
accounting for family structure had minimal influence on effect estimates, so linear regression was used as in previous studies (52). Imputed allele dosages were modelled with an additive mode of inheritance. When available, results from directly gen-otyped SNP data were used in preference over those from im-puted SNP data. Detailed descriptions of cohort-specific GWAS analytic methods can be found in S1 Text.
Prior to meta-analysis, GWAS results from each cohort were filtered to remove SNPs with minor allele frequency (MAF)<0.01 or imputation quality scores<0.3. Effect estimates and their standard errors estimated from cohorts that used QRS standardized residuals as the phenotype (ARIC, JHS, MESA, and CFS) were transformed back to units of milliseconds by multi-plying by the study-specific standard deviation of the residuals. Cohort-specific GWAS results were combined using fixed effect meta-analysis with inverse variance weights as implemented in METAL (54). SNPs that were non-autosomal or were only pre-sent in a single study were excluded from analysis. Genomic control was applied to the results from each cohort prior to meta-analysis and to the results of the meta-analysis (double GC-correction) (Supplementary Material, Table S1) (55). To maintain an experiment-wide type I error rate of 0.05, a genome-wide significance threshold of 2.5108 was pre-specified based on a Bonferroni correction for the 2 million inde-pendent common variants estimated to exist in the genomes of individuals of African ancestry (56). Heterogeneity across sam-ples was assessed using Cochran’s X2test of heterogeneity with 9 degrees of freedom (57) and the I2statistic (58). A transethnic GWAS meta-analysis of QRS duration was performed using fixed-effect inverse variance weighted meta-analysis to com-bine the double GC-corrected African American GWAS meta-analysis results with the double GC-corrected European ances-try CHARGE GWAS meta-analysis results (8).
Global and local genetic ancestry was estimated in ARIC, JHS, MESA, and CFS cohorts using ANCESTRYMAP (59) and HAPMIX (60) as previously described (52). For the WHI cohort, global ancestry was estimated using Frappe (61) and local an-cestry was estimated using SABRE (62). For the HANDLS and Health ABC cohorts, STRUCTURE (63) was used to estimate global ancestry, as previously described for the Health ABC co-hort (64), and LAMP (65) was used to estimate local ancestry. Additional details of global and local ancestry estimation can be found in S1 Text. Linear regression was used to estimate the as-sociation between global genetic ancestry estimates and QRS duration.
Variant annotation was performed using HaploReg (66), which leveraged data from the 1000 Genomes Project (36), ENCODE (67), and the Roadmap Epigenomics Mapping Consortium (68).
Genome-wide SNP results from the GWAS in African Americans and the transethnic GWAS will be made available through the dbGaP CHARGE summary results site under dbGaP accession phs000930.
Gene set enrichment analysis
A gene set enrichment analysis (GSEA) was performed using MAGENTA version 2.4 (69) on the QC-filtered double GC-corrected African American GWAS meta-analysis results. Briefly, MAGENTA assigns a gene score based on the most sig-nificant SNP association in the gene region, corrects for poten-tial gene score confounders (e.g., gene size and number of
independent SNPs), and determines the proportion of gene scores in the gene set above a specified percentile cut-off (i.e., the leading edge fraction). The construction of gene scores from the minimum QRS-SNP associationP-value for each gene region enabled a gene score to be significant in the presence of allelic heterogeneity, i.e., different SNPs that are the most significantly associated with QRS duration at each locus in populations of European and African descent. The significance of the gene set’s leading edge fraction was determined using an empirical null distribution of 10,000 leading edge fractions from randomly sampled gene sets matched to the user-defined gene set by gene score confounder characteristics. To enable MAGENTA to calculate the number of SNPs per gene for populations of African descent, we generated a genome-wide list of SNP posi-tions after SNPs in high LD (pairwise genotypic correlation r20.8) were removed by applying PLINK’s LD pruning function to HapMap phase 2 YRI genotype data using sliding windows of 50 SNPs moving by 5 SNP increments (70).
The candidate gene set was created using the gene closest to the index SNP from the GWAS of QRS duration previously con-ducted by the CHARGE consortium (8), the largest GWAS of QRS duration, and included: SCN5A, SCN10A, CDKN1A, PLN, NFIA, HAND1,TBX20,SIPA1L1,TBX5,TBX3,VTI1A,SETBP1,STRN,TKT, CRIM1,CDKN2C,PRKCA,IGFBP3,CASQ2,KLF12,LRIG1,DKK1, and GOSR2.SCN5A andSCN10Awere individually included in our gene set because the previously published CHARGE GWAS of QRS duration determined that SNP associations in these adja-cent genes were independent (8).
Locus-specific replication and regional association analysis
The 30 European ancestry index SNPs (EA index SNPs) from the 22 previously reported EA QRS loci that were examined for repli-cation in African Americans were 3 SCN10A SNPs, 3 SCN5A SNPs, 1EXOGSNP, 2CDKN1ASNPs, 2TBX5SNPs, and a single SNP from each of the other 19 previously reported loci (7,8,16). To account for the 30 examined SNPs, a significance threshold of 0.002 was adopted. The following parameters were used in power calculations for the 30 SNP replication analysis:a¼0.002, African American sample size¼13,031, African American QRS duration mean6SD¼89.2369.70 ms (weighted average and pooled SD across the 10 COGENT/CARe cohorts), the previously reported SNP effect size, and the SNP coded allele frequency in populations of African descent (weighted average across the 10 COGENT/CARe cohorts).
In the analysis of the genomic region surrounding each of the European-ancestry index SNPs, each region was defined as the genomic interval encompassing all SNPs with QRS associa-tion P-values5108 from the largest GWAS meta-analysis conducted in individuals of European ancestry (8), and then ex-tending the genomic interval boundaries by 100 kb in both direc-tions. To set the significance threshold, the number of independent SNPs in these 22 regions was determined from HapMap phase 2 YRI SNP genotype data using the same LD pruning procedure that was described for our GSEA method. For the 22 previously reported QRS loci, 3,526 independent SNPs were identified and a Bonferroni-based significance threshold of 1.4105was adopted.
of European descent (8). Power to replicate African-ancestry in-dex SNP associations in populations of European descent was calculated using the following parameters: a¼0.002, sample size of individuals with European ancestry¼40,407, QRS dura-tion mean6SD from individuals of European ances-try¼88.32610.13 ms (estimated from 2,845 CHS subjects of European ancestry after application of exclusion factors de-scribed above), African-ancestry index SNP effect size, and the previously reported SNP coded allele frequency in populations of European descent (8). All power calculations were performed using QUANTO (71).
Regional association plots were created using LocusZoom (72), customized to separately plot recombination rates esti-mated from African Americans (73) and HapMap CEU individ-uals. ForSupplementary Materials, Figs S17–S19, LD plots were created using Haploview and LD blocks were estimated using 95% confidence bounds on D prime (74,75).
95%Credible set construction
Regions used to construct credible sets (CS) at the 22 QRS loci discovered in populations of European descent were defined as genomic intervals encompassing all SNPs with QRS association P-values5108reported by Sotoodehniaet al. (8), and then extending those genomic intervals by 100 kb in both directions. At the two new QRS loci reported here, intervals 100 kb up-stream and downup-stream of the transethnic index SNP were used as regions for CS construction. Transethnic meta-analysis of fixed-effect meta-analysis results from populations of European descent (8) and African Americans was performed us-ing MANTRA (17). As previously described (76) and in the con-text of a transethnic meta-analysis (77), fornSNPs in a region, a Bayes factor (BFi) was estimated for each SNPiusing MANTRA,
and the posterior probability for SNPiis equal to
BFi
Pn i¼1BFi
SNPs with high posterior probabilities are more likely to be associated with a trait than SNPs with low posterior probabili-ties. SNPs at each region were ranked by their posterior proba-bilities in decreasing order, and the 95% CS consisted of the smallest set of ranked SNPs for which the cumulative sum of their posterior probabilities reached 0.95. The genomic interval of a 95% CS was the range of the positions of the SNPs in the CS.
Metabochip analysis ofSCN5A-SCN10Agene region
To more comprehensively evaluate genetic variation in the SCN5A-SCN10Agenomic region, we examined SNP associations using the MetaboChip, a high-density custom Illumina iSelect array that includes SNPs from the 1000 Genomes Project (11,78). In theSCN5A-SCN10Aregion (NCBI build 36 positions 38,490,026 - 38,818,967), 654 MetaboChip SNPs were directly genotyped and passed QC filters (SNP and sample call rate>90%, concordance among blind duplicates>98%, HWEP-value>0.001, MAF>0.01) in ARIC and WHI-PAGE participants. MetaboChip SNPs were im-puted in WHI-SHARE participants using genome-wide genotype data (Affymetrix 6.0 SNP array), as previously described (79).
Gene expression analysis in human atrial tissue
Human left atrial appendage and pulmonary vein trimming tissues were obtained with written informed consent from 289 European-ancestry and 40 African-ancestry patients undergo-ing cardiac surgery. Use of discarded surgical tissue was ap-proved by the Institutional Review Board of the Cleveland Clinic. Total RNA was extracted using TRIzol. Genome-wide RNA levels were measured using Illumina HT12 v.3 and v.4 ex-pression arrays. RNA exex-pression levels were background cor-rected, log2-transformed, quantile normalized, and batch adjusted. Genome-wide SNPs were genotyped in these sub-jects using Illumina Hap550 and Hap610 arrays, and multidi-mensional scaling (MDS) was performed. SNP association with RNA levels was determined separately for each racial group using linear regression with SNPs coded as dosages and addi-tive adjustment for sex, tissue location, MDS dimensions, and surrogate variables, which were included to reduce expression heterogeneity and improve power to detect eQTLs (80). Effect estimates were expressed on the log2-transformed RNA scale. Analysis was performed using expression probes detected in at least 10% of samples within 250 kb of the query SNP. Nine eQTLs were examined: rs3922844 andSCN5A, rs1662342 and probes in MYL12A, TGIF1 (2 probes), LPIN2 (2 probes), and MYOM1, and rs7547997 and probes inCD1CandCD1E, and an eQTLP-value<0.006 (0.05/9) was deemed significant. SCN5A exonic locations are expressed relative to the longest isoform, NM_198056.2, which contains 28 exons.
Supplementary Material
Supplementary Materialis available atHMGonline.
Acknowledgements
The authors wish to acknowledge the contributions of the in-volved research institutions, study investigators, field staff, and study participants of WHI, ARIC, JHS, MESA, Health ABC, HANDLS, CHS, CFS, BLSA, and BHS.
Meitinger, Albert Hofman, Harry Campbell, Aaron R. Folsom, Dirk J. van Veldhuisen, Christine Schwienbacher, Christopher J. O’Donnell, Claudia Beu Volpato, Mark J. Caulfield, John M. Connell, Lenore Launer, Xiaowen Lu, Lude Franke, Rudolf S.N. Fehrmann, Gerard te Meerman, Harry J.M. Groen, Rinse K. Weersma, Leonard H. van den Berg, Cisca Wijmenga, Roel A. Ophoff, Gerjan Navis, Igor Rudan, Harold Snieder, James F. Wilson, Peter P. Pramstaller, David S. Siscovick, Thomas J. Wang, Vilmundur Gudnason, Cornelia M. van Duijn, Stephan B. Felix, Glenn I. Fishman, Yalda Jamshidi, Bruno H Ch Stricker, Nilesh J. Samani, Stefan K€aab, Dan E. Arking.€
Conflict of Interest statement. Bruce M. Psaty serves on the DSMB of a clinical trial funded by the manufacturer (Zoll LifeCor) and on the Steering Committee of the Yale Open Data Access Project funded by Johnson & Johnson. Anne M. Butler has received investigator-initiated support from Amgen and AstraZeneca for unrelated work.
Funding
This work was supported by the National Institutes of Health [R01 HL088456 to N.S., R01 HL116747 to N.S., R01 HL111089 to N.S., R01 HL091244 to N.S., K99 HL098458 to C.L.A., 5T32CA009330-30 to A.M.B., R01 ES017794 to E.A.W., P20MD006899 to S.G.B., and U24AG051129 to D.S.E.], the Laughlin Family [to N.S.], and the German Research Foundation [SCHNA 1149/3-1 to R.B.S.]. As part of the National Heart, Lung, and Blood Institute (NHLBI)-sponsored Candidate gene Association Resource (CARe) project, the ARIC, JHS, MESA, and CFS studies contributed parent study data, ancillary study data, and DNA samples through the Broad Institute of Harvard and MIT (N01-HC-65226) to create a geno-type/phenotype database for wide dissemination to the biomed-ical research community.
Atherosclerosis Risk in Communities (ARIC): The ARIC study is carried out as a collaborative study supported by National Heart, Lung, and Blood Institute contracts (HHSN268201100005C, HHSN268201100006C, HHSN268201100007C, HHSN268201100008C, HHSN268201100009C, HHSN268201100010C, HHSN268201100011C, and HHSN268201100012C), R01HL087641, R01HL59367 and R01HL086694; National Human Genome Research Institute con-tract U01HG004402; and National Institutes of Health concon-tract HHSN268200625226C. The authors thank the staff and participants of the ARIC study for their important contributions. Infrastructure was partly supported by Grant Number UL1RR025005, a component of the National Institutes of Health and NIH Roadmap for Medical Research.
Cleveland Family Study (CFS): Case Western Reserve University (NIH HL 46380, M01RR00080).
Jackson Heart Study (JHS): The Jackson Heart Study is supported by contracts HHSN268201300046C, HHSN268201300047C, HHSN268201300048C, HHSN268201300049C, HHSN268201300050C from the National Heart, Lung, and Blood Institute and the National Institute on Minority Health and Health Disparities. Multi-Ethnic Study of Atherosclerosis (MESA): University of Washington (N01-HC-95159), Regents of the University of California (N01-HC-95160), Columbia University (N01-HC-95161), Johns Hopkins University (N01-HC-95162, N01-HC-95168), University of Minnesota (N01-HC95163), Northwestern University 95164), Wake Forest University (N01-HC-95165), University of Vermont (N01-HC-95166), New England Medical Center (N01-HC-95167), Harbor-UCLA Research and
Education Institute (N01-HC-95169), Cedars-Sinai Medical Center (R01-HL-071205), and University of Virginia (subcontract to R01-HL-071205).
Health, Aging, and Body Composition Study (Health ABC): The Health ABC study was supported by NIA contracts N01AG62101, N01AG62103, and N01AG62106. The genome-wide association study was funded by NIA grant 1R01AG032098-01A1 to Wake Forest University Health Sciences and genotyping services were provided by the Center for Inherited Disease Research (CIDR). CIDR is fully funded through a federal contract from the National Institutes of Health to The Johns Hopkins University, contract number HHSN268200782096C. This research was sup-ported in part by the Intramural Research Program of the NIH, National Institute on Aging.
Healthy Aging in Neighbourhoods of Diversity across the Life Span Study (HANDLS): The HANDLS study was in part supported by the intramural research program of the National Institute on Aging and the National Center for Minority Health and Health Disparities, National Institutes of Health. This research was sup-ported by the Intramural Research Program of the NIH, National Institute on Aging and the National Center on Minority Health and Health Disparities (contract # Z01-AG000513 and human subjects protocol # 2009-149). Data analyses for the HANDLS study utilized the high-performance computational capabilities of the Biowulf Linux cluster at the National Institutes of Health, Bethesda, Md. (http://biowulf.nih.gov).
Women’s Health Initiative (WHI): The WHI program is funded by the National Heart, Lung, and Blood Institute, National Institutes of Health, U.S. Department of Health and Human Services through contracts HHSN268201100046C, HHSN268201100001C, HHSN268201100002C, HHSN268201100003C, HHSN268201100004C, and HHSN271201100004C. This manuscript was prepared in col-laboration with investigators of the WHI, and has been reviewed and/or approved by the Women’s Health Initiative (WHI). WHI in-vestigators are listed at https://www.whi.org/researchers/ Documents%20%20Write%20a%20Paper/WHI%20Investigator% 20Short%20List.pdf. Funding for WHI SHARe genotyping was pro-vided by NHLBI Contract N02-HL-64278.
Cardiovascular Health Study (CHS): This CHS research was sup-ported by NHLBI contracts HHSN268201200036C, HHSN268200800007C, N01HC55222, N01HC85079, N01HC85080, N01HC85081, N01HC85082, N01HC85083, N01HC85086, HHSN268200960009C; and NHLBI grants HL080295, HL087652, HL105756, HL103612, HL120393, and HL130114, HL085251 with additional contribution from the National Institute of Neurological Disorders and Stroke (NINDS). Additional support was provided through AG023629 from the National Institute on Aging (NIA). A full list of principal CHS investigators and insti-tutions can be found at CHS-NHLBI.org/. The provision of geno-typing data was supported in part by the National Center for Advancing Translational Sciences, CTSI grant UL1TR000124, and the National Institute of Diabetes and Digestive and Kidney Disease Diabetes Research Center (DRC) grant DK063491 to the Southern California Diabetes Endocrinology Research Center. The content is solely the responsibility of the authors and does not necessarily represent the official views of the National Institutes of Health.
Bogalusa Heart Study (BHS): BHS is supported by grants R01ES021724 from National Institute of Environmental Health Science and R01AG016592 from the National Institute on Aging. Analysis performed at STSI/TSRI was supported by U54 NS056883 and Scripps Genomic Medicine.
The Population Architecture Using Genomics and Epidemiology (PAGE) program is funded by the National Human Genome Research Institute (NHGRI), supported by U01HG007416 (CALiCo), U01HG007417 (ISMMS), U01HG007397 (MEC), U01HG007376 (WHI), and U01HG007419 (Coordinating Center). The contents of this pa-per are solely the responsibility of the authors and do not neces-sarily represent the official views of the NIH. The complete list of PAGE members can be found at http://www.pagestudy.org. Assistance with data management, data integration, data dis-semination, genotype imputation, ancestry deconvolution, and general study coordination was provided by the PAGE Coordinating Center (U01HG007419). The PAGE consortium thanks the staff and participants of all PAGE studies for their im-portant contributions.
Funding for the atrial tissue eQTL study was provided by NIH 5R01HL090620, NIH 5R01HL111314, Fondation Leducq CVD-07-03, European North American Atrial Fibrillation Research Alliance.
The funders had no role in study design, data collection and analysis, decision to publish, or preparation of the manuscript.
References
1. Badheka, A.O., Singh, V., Patel, N.J., Deshmukh, A., Shah, N., Chothani, A., Mehta, K., Grover, P., Savani, G.T., Gupta, S., et al. (2013) QRS duration on electrocardiography and cardiovascular mortality (from the National Health and Nutrition Examination Survey-III). Am. J. Cardiol, 112, 671–677.
2. Mentz, R.J., Greiner, M.A., DeVore, A.D., Dunlay, S.M., Choudhary, G., Ahmad, T., Khazanie, P., Randolph, T.C., Griswold, M.E., Eapen, Z.J.,et al. (2015) Ventricular conduc-tion and long-term heart failure outcomes and mortality in African Americans: insights from the Jackson Heart Study. Circ. Heart Fail.,8, 243–251.
3. Wang, N.C., Maggioni, A.P., Konstam, M.A., Zannad, F., Krasa, H.B., Burnett, J.C., Jr., Grinfeld, L., Swedberg, K., Udelson, J.E., Cook, T.,et al. (2008) Clinical implications of QRS duration in patients hospitalized with worsening heart failure and reduced left ventricular ejection fraction. JAMA, 299, 2656–2666.
4. Vitelli, L.L., Crow, R.S., Shahar, E., Hutchinson, R.G., Rautaharju, P.M. and Folsom, A.R. (1998) Electrocardiographic findings in a healthy biracial population. Atherosclerosis Risk in Communities (ARIC) Study Investigators.Am. J. Cardiol.,81, 453–459.
5. Rautaharju, P.M., Prineas, R.J., Kadish, A., Larson, J.C., Hsia, J. and Lund, B. (2006) Normal standards for QT and QT subin-tervals derived from a large ethnically diverse population of women aged 50 to 79 years (the Women’s Health Initiative [WHI]).Am. J. Cardiol.,97, 730–737.
6. Walsh, J.A. 3rd, Prineas, R., Daviglus, M.L., Ning, H., Liu, K., Lewis, C.E., Sidney, S., Schreiner, P.J., Iribarren, C., Lloyd-Jones, D.M. (2010) Prevalence of electrocardiographic abnor-malities in a middle-aged, biracial population: Coronary Artery Risk Development in Young Adults study. J. Electrocardiol.,43, 385 e381–389.
7. Holm, H., Gudbjartsson, D.F., Arnar, D.O., Thorleifsson, G., Thorgeirsson, G., Stefansdottir, H., Gudjonsson, S.A., Jonasdottir, A., Mathiesen, E.B., Njolstad, I., et al. (2010) Several common variants modulate heart rate, PR interval and QRS duration.Nat. Genet.,42, 117–122.
8. Sotoodehnia, N., Isaacs, A., de Bakker, P.I., Dorr, M., Newton-Cheh, C., Nolte, I.M., van der Harst, P., Muller, M., Eijgelsheim, M., Alonso, A.,et al. (2010) Common variants in 22 loci are associated with QRS duration and cardiac ventric-ular conduction.Nat. Genet.,42, 1068–1076.
9. Rosenberg, N.A., Huang, L., Jewett, E.M., Szpiech, Z.A., Jankovic, I. and Boehnke, M. (2010) Genome-wide associa-tion studies in diverse populaassocia-tions. Nat. Rev. Genet., 11, 356–366.
10. Casto, A.M. and Feldman, M.W. (2011) Genome-wide association study SNPs in the human genome diversity project populations: does selection affect unlinked SNPs with shared trait associations? PLoS Genet., 7, e1001266.
11. Matise, T.C., Ambite, J.L., Buyske, S., Carlson, C.S., Cole, S.A., Crawford, D.C., Haiman, C.A., Heiss, G., Kooperberg, C., Marchand, L.L.,et al. (2011) The Next PAGE in understanding complex traits: design for the analysis of Population Architecture Using Genetics and Epidemiology (PAGE) Study. Am. J. Epidemiol.,174, 849–859.
12. Splawski, I., Timothy, K.W., Tateyama, M., Clancy, C.E., Malhotra, A., Beggs, A.H., Cappuccio, F.P., Sagnella, G.A., Kass, R.S. and Keating, M.T. (2002) Variant of SCN5A sodium channel implicated in risk of cardiac arrhythmia.Science, 297, 1333–1336.
13. Jeff, J.M., Brown-Gentry, K., Buxbaum, S.G., Sarpong, D.F., Taylor, H.A., George, A.L., Jr., Roden, D.M. and Crawford, D.C. (2011) SCN5A variation is associated with electrocardio-graphic traits in the Jackson Heart Study.Circ. Cardiovasc. Genet.,4, 139–144.
14. Magnani, J.W., Brody, J.A., Prins, B.P., Arking, D.E., Lin, H., Yin, X., Liu, C.T., Morrison, A.C., Zhang, F., Spector, T.D., et al. (2014) Sequencing of SCN5A identifies rare and common variants associated with cardiac conduc-tion: Cohorts for Heart and Aging Research in Genomic Epidemiology (CHARGE) Consortium. Circ. Cardiovasc. Genet.,7, 365–373.
15. Ilkhanoff, L., Arking, D.E., Lemaitre, R.N., Alonso, A., Chen, L.Y., Durda, P., Hesselson, S.E., Kerr, K.F., Magnani, J.W., Marcus, G.M.,et al. (2014) A common SCN5A variant is as-sociated with PR interval and atrial fibrillation among African Americans. J. Cardiovasc. Electrophysiol., 25, 1150–1157.
16. Chambers, J.C., Zhao, J., Terracciano, C.M., Bezzina, C.R., Zhang, W., Kaba, R., Navaratnarajah, M., Lotlikar, A., Sehmi, J.S., Kooner, M.K.,et al. (2010) Genetic variation in SCN10A in-fluences cardiac conduction.Nat. Genet.,42, 149–152. 17. Morris, A.P. (2011) Transethnic meta-analysis of
genome-wide association studies.Genet. Epidemiol.,35, 809–822. 18. Schroeter, A., Walzik, S., Blechschmidt, S., Haufe, V.,
Benndorf, K. and Zimmer, T. (2010) Structure and function of splice variants of the cardiac voltage-gated sodium channel Na(v)1.5.J. Mol. Cell. Cardiol.,49, 16–24.
19. Zimmer, T. and Surber, R. (2008) SCN5A channelopathies–an update on mutations and mechanisms.Prog. Biophys. Mol. Biol.,98, 120–136.