TEACHER RETENTION AND THE IMPACT OF NORTH CAROLINA’S NEW DEFINITION OF A LOW-PERFORMING SCHOOL
Janice Marie Giles
A dissertation submitted to the faculty at the University of North Carolina at Chapel Hill in partial fulfillment of the requirements for the degree of Doctor of Education in the School of
Education.
Chapel Hill 2018
ABSTRACT
Janice Marie Giles: Teacher Retention and the Impact of North Carolina’s New Definition of a Low-performing School
(Under the direction of Brian C. Gibbs)
Teachers are a resource, and equitable resource allocation must include the equitable distribution of teachers across all schools. Previous research has found that high poverty and minority students are more likely to be taught by inexperienced and unqualified teachers, and teachers frequently leave schools serving these students for schools with fewer disadvantaged students (Boyd, Lankford, Loeb, & Wyckoff, 2005; Goldring, Taie, & Riddles, 2014; Hanushek, Kain, & Rivkin, 2004; Ingersoll, 2004; Loeb, Darling-Hammond, & Luczak, 2005). Further, previous research indicates that the challenges these schools face retaining effective teachers is due to poor working conditions, not teachers’ discontent with their students (Boyd et al., 2011; Johnson, Kraft, & Papay, 2012; Ladd, 2011). These findings establish a need to investigate how current polices may have contributed to the disparities in teacher retention rates. The purpose of this study was to examine the impact of North Carolina’s new definition of a low-performing school on teacher retention and teacher working conditions.
ACKNOWLEDGEMENTS
I am grateful for all the support and encouragement I received from my family, friends, and colleagues throughout this process. I especially want to thank my husband, Will, for his patience and willingness to support my career aspirations. Thank you for the countless nights you were home with Eli and Easton while I was at class and for all the times you took them out on adventures so I had a quiet place to write. Eli and Easton, you bring so much joy to my life. The desire to have more time to spend enjoying life with my family has been my motivation to push through and finish this dissertation. I want to thank my parents for all the opportunities they gave me that have led me to this point and for instilling a strong work ethic (which I would not have been able to complete this process without).
I appreciate the help and reassurance I received from my advisor, Dr. Brian Gibbs. Thank you to the each of the members of my dissertation committee for the feedback and support you provided. The guidance I received from Dr. Thad Domina with my data analysis was
especially invaluable.
TABLE OF CONTENTS
LIST OF TABLES ... x
LIST OF FIGURES ... xi
LIST OF ABBREVIATIONS ... xii
CHAPTER 1: INTRODUCTION ... 1
Background ... 1
Statement of the Problem ... 4
Purpose of the Study ... 5
Research Questions ... 5
Significance of the Research ... 6
Conceptual Framework ... 6
Methodology ... 8
Assumptions and Limitations ... 8
Definition of Terms ... 9
Summary ... 10
CHAPTER 2: LITERATURE REVIEW ... 12
Introduction ... 12
Teacher Retention ... 12
Impact of Teacher Retention on Schools and Students ... 15
Policies Impacting Teacher Retention ... 18
School Accountability Policies ... 19
Teacher Compensation Policies ... 23
The Role of School-Based Administrators in Teacher Retention ... 30
Synthesis ... 33
School Accountability Polices ... 34
Teacher Compensation Policies ... 34
The Role of School-Based Administrators ... 36
Summary ... 38
CHAPTER 3: METHODOLOGY ... 39
Introduction ... 39
Research Design ... 40
Population and Sample ... 40
Data Collection and Measures ... 41
North Carolina Department of Public Instruction Data Files ... 44
North Carolina Teacher Working Conditions Survey Data ... 48
Analysis... 50
Descriptive Statistics ... 50
Inferential Statistics ... 50
Descriptive Statistics ... 54
Dependent Variables ... 54
Control Variables ... 61
Multiple Regression Analysis ... 67
Primary Research Question ... 67
Secondary Research Question ... 70
Summary ... 75
CHAPTER 5: DISCUSSION ... 77
Introduction ... 77
Interpretation of the Findings ... 78
Implications ... 80
Limitations of the Study ... 81
Recommendations for Further Research ... 82
Conclusion ... 83
LIST OF TABLES
Table 1 - North Carolina Teacher Turnover Rates ... 13
Table 2 - Average Percent of Teachers Retained, Calculated Rates ... 55
Table 3 - Average Percent of Teachers Retained, NCDPI Rates ... 57
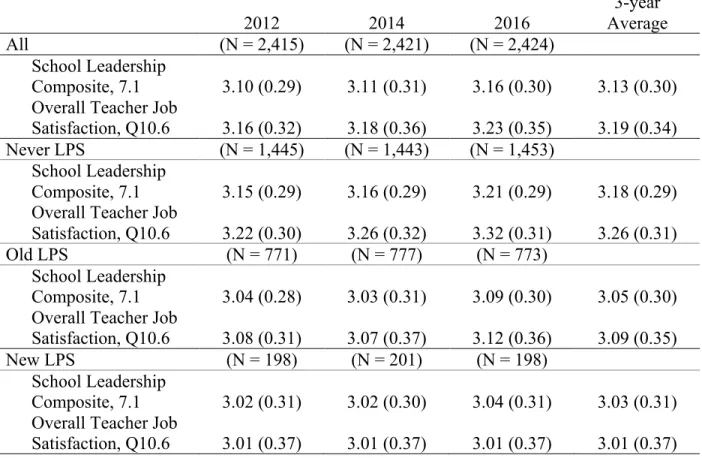
Table 4 - Average NCTWC Results ... 59
Table 5 - School Type as a Percentage of the Sample ... 62
Table 6 - Grade Range as a Percentage of the Sample ... 63
Table 7 - Locale Classification as Percentage of the Sample ... 64
Table 8 - Average Percent of Economically Disadvantaged Students ... 65
Table 9 - Average Percent of Students by Race/Ethnicity ... 66
Table 10 - Regression Coefficients: Teacher Retention Model 1 (Fixed Effects, New LPS Schools) ... 68
Table 11 - Regression Coefficients: Teacher Retention Model 2 (Random Effects, All Schools) ... 69
Table 12 - Regression Coefficients: Teacher Retention Model 3 (Fixed Effects, All Schools) ... 70
Table 13 - Regression Coefficients: Teacher Working Conditions as Measured by NCTWC Model 1 (Fixed Effects, New LPS Schools) ... 71
Table 14 - Regression Coefficients: Teacher Working Conditions as Measured by NCTWC Model 2 (Random Effects, All Schools) ... 73
LIST OF FIGURES
Figure 1 - Conceptual framework ... 7
Figure 2 - Timeline of data measures ... 43
Figure 3 - Summary of control variables ... 47
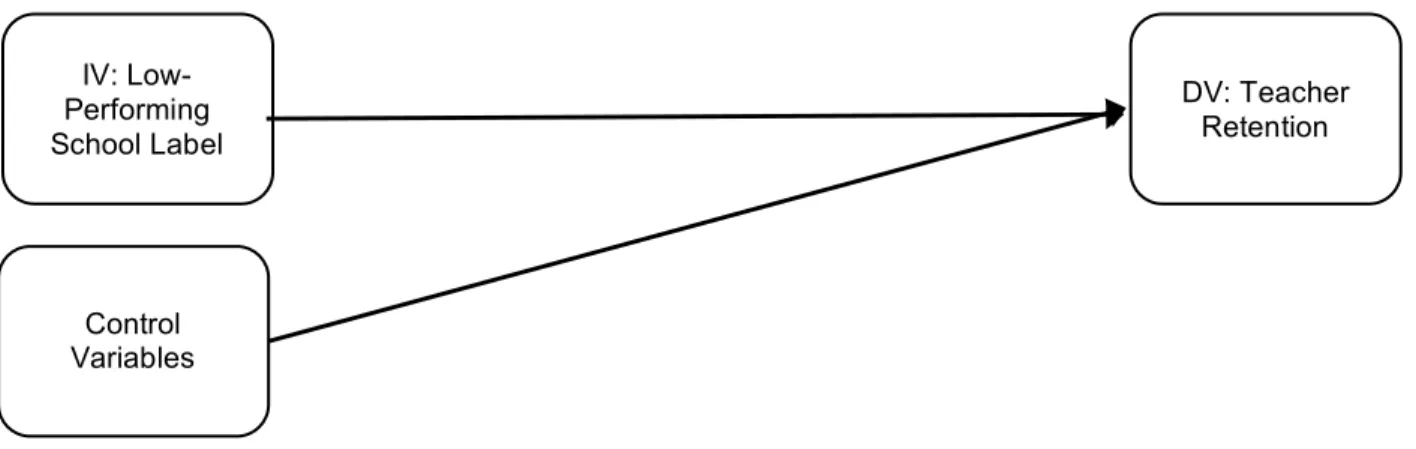
Figure 4 - Conceptual model for the analysis of the primary research question ... 51
Figure 5 - Conceptual model for analysis of the secondary research question ... 51
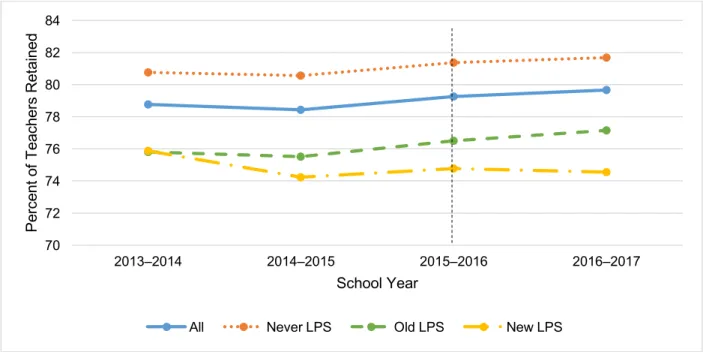
Figure 6 - Average percent of teachers retained using calculated rates ... 56
Figure 7 - Average percent of teachers retained using NCDPI rates ... 57
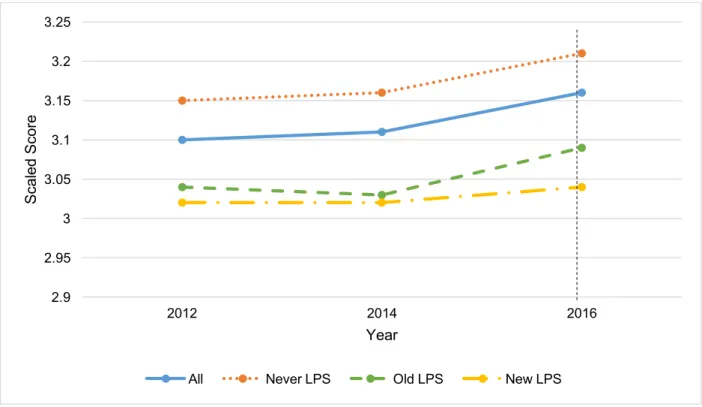
Figure 8 - School Leadership Composite, Q7.1 ... 60
LIST OF ABBREVIATIONS EPIC Education Policy Initiative at Carolina
NCDPI North Carolina Department of Public Instruction NCLB No Child Left Behind Act of 2001
NTC New Teacher Center
CHAPTER 1: INTRODUCTION Background
Despite the federal mandate under the No Child Left Behind Act of 2001 (NCLB) that all students would meet or exceed a proficient level of academic achievement, many students continue to fall short of this goal. Achievement gaps on state assessments persist between high- and low-poverty students, and between minority and nonminority students (Lee & Reeves, 2012). An effective teacher in every classroom is critical to ensuring each student receives an excellent and equitable education (McCaffrey, Koretz, Lockwood, & Hamilton, 2004; Rivkin, Hanushek, & Kain, 2005; Rockoff, 2004). Gaps in student achievement coincide with disparities in the distribution of effective teachers (Adamson & Darling-Hammond, 2012; Lankford, Loeb, & Wyckoff, 2002; Loeb, Darling-Hammond, & Luczak, 2005; Williams, Adrien, Murthy, & Pietryka, 2016). The most disadvantaged students often lack access to the high-quality
instruction that effective teachers provide (Adamson & Darling-Hammond, 2012; Lankford et al., 2002; Loeb et al., 2005; Williams et al., 2016). Policymakers, researchers, and practitioners must be concerned with the causes of these disparities if they aspire to provide each student an excellent and equitable education. One factor impacting the distribution of effective teachers is teacher retention (Adamson & Darling-Hammond, 2012; Lankford et al., 2002; Loeb et al., 2005; Williams et al., 2016).
2004; Ingersoll, 2001). There are two primary areas of interest that drive the study of teacher retention: how turnover impacts the distribution of teacher quality across schools and districts and student achievement (Johnson, Berg, & Donaldson, 2005). Researchers studying teacher retention have identified a wide range of factors known to influence teachers’ decisions to remain in their schools, transfer to new ones, or leave the profession altogether (Borman & Dowling, 2008; Boyd et al., 2008; Feng & Sass, 2016; Hanushek et al., 2004; Ingersoll, 2001). Teacher working conditions are one major factor that have been found to impact teacher retention (Borman & Dowling, 2008; Loeb et al., 2005).
Ingersoll (2001) defines teacher turnover as “the departure of teachers from their teaching jobs” (p. 500). Turnover broadly encompasses both attrition and mobility. In general, teacher attrition is the loss of a teacher from the profession, and teacher mobility is the relocation of a teacher from one school to another. Teacher turnover can be examined at the school, district, state, and national levels. For this study, teacher turnover was examined at the school level. Distinguishing the difference between attrition and mobility is particularly important in
examining the policy implications surrounding why large numbers of teachers leave their jobs to teach in other schools as opposed to leaving the teaching profession all together (Johnson et al., 2005).
identifying solutions that have increased teacher retention at these schools can inform the design of future policies that have the potential to reduce the disparities in the equitable distribution of teachers.
One current statewide education policy that warrants further examination is North Carolina’s new definition of a low-performing school. In 2015, North Carolina House Bill 97 changed the definition of a low-performing school in North Carolina. It rewrote North Carolina General Statute 115C-105.37 to define low-performing schools as “those that receive a school performance grade of D or F and a school growth score of “met expected growth” or “not met expected growth” as defined by G.S. 115C-83.15” ("Current operations and capital
improvements appropriations act of 2015," 2015).1 Previously, low-performing schools were defined as “those in which there is a failure to meet the minimum growth standards, as defined by the State Board, and a majority of students are performing below grade level” ("Current operations and capital improvements appropriations act of 2015," 2015). This change in definition resulted in an increased number of schools designated as low performing. Based on scores from the 2014–2015 school year, 581 public schools were identified as low-performing schools for the 2015–2016 school year, as compared to 367 schools for 2014–2015 school year based on scores from the 2013–2014 school year (Granados, 2015). For many of these schools, their School Performance Grade and School Growth Score did not decrease from the 2013–2014 school year to the 2014–2015 school year; yet, they were designated as low performing because of the inclusion of schools that “met expected growth” in the new definition of a low-performing
school. Many of the schools identified as low-performing schools are high poverty schools serving primarily minority students (Hiu, 2015; North Carolina Department of Public Instruction, 2015b).
Statement of the Problem
Teacher quality is known to impact student achievement (McCaffrey et al., 2004; Rivkin et al., 2005; Rockoff, 2004). Multiple studies have found that teachers are the most influential school-based factor impacting student learning (McCaffrey et al., 2004; Rivkin et al., 2005; Rockoff, 2004). To this end, teachers are a resource, and equitable resource allocation must include the equitable distribution of teachers across all schools. High poverty and minority students should have access to similar quality teachers as low poverty and nonminority students. However, high poverty and minority students are more likely to be taught by inexperienced and unqualified teachers, and teachers frequently leave schools serving high poverty and minority students for schools with fewer disadvantaged students. Research indicates that the challenges these schools face retaining effective teachers is due to poor working conditions, not teachers’ discontent with their students (Boyd et al., 2011; Johnson, Kraft, & Papay, 2012; Ladd, 2011). It follows that researchers should examine how policies have influenced teacher retention and teacher working conditions at schools serving high poverty and minority students. Loeb and Miller (2006) noted, “States have passed bundles of laws that reach into every aspect of the teacher workforce” (p. ii), but found there were few that had been systematically evaluated. They argued that evaluating current policies is critical to designing and implementing effective
policies in the future.
as such (p. 258). In 2015, the North Carolina General Assembly changed how low-performing schools are defined in North Carolina. The new definition includes schools that “met expected growth.” This change in definition resulted in a 58.3% increase in the number of schools
designated as low-performing schools. Schools serving high poverty and minority students were most likely to be identified as low-performing schools. Based on scores from the 2014–2015 school year, 42% of high-poverty schools received D’s or F’s, compared with only 3.6% of all other schools (North Carolina Department of Public Instruction, 2015b). The impact of North Carolina’s new definition of a low-performing school on teacher retention is not known, and further research is warranted to better understand the effects of this new policy.
Purpose of the Study
The purpose of this quantitative causal-comparative study was to examine the impact of North Carolina’s new definition of a low-performing school on teacher retention and teacher working conditions. Specifically, this study investigated newly designated North Carolina public schools that would not have met the criteria of a low-performing school under the state’s
previous definition. Quantitative analysis addressed the relationship between the low-performing school label (independent variable) and both teacher retention and teacher working conditions in North Carolina public schools (dependent variables).
Research Questions
year. The secondary research question this study addressed was: How has North Carolina’s new definition of a low-performing school impacted teacher working conditions in newly designated schools that did not meet the criteria for low-performing under the state’s previous definition? The hypothesis was that newly designated low-performing schools will have lower ratings on the North Carolina Teacher Working Conditions Survey (NCTWC) compared to past years and compared to other North Carolina public schools for the same year.
Significance of the Research
Effective teachers are an important determinant in the quality of student learning. Given the known disparities in access to high quality teachers, researchers must consider how policies have impacted the ability of schools serving high poverty and minority students to retain
teachers. This study aimed to examine how North Carolina’s new definition of a low-performing school impacted low-performing schools’ ability to retain teachers. The field of educational leadership would benefit from additional knowledge indicating how a low performing school designation impacts teacher retention and teacher working conditions. This knowledge will inform the design and implementation of future educational polices intended to reduce the disparities in the equitable distribution of teachers.
Conceptual Framework
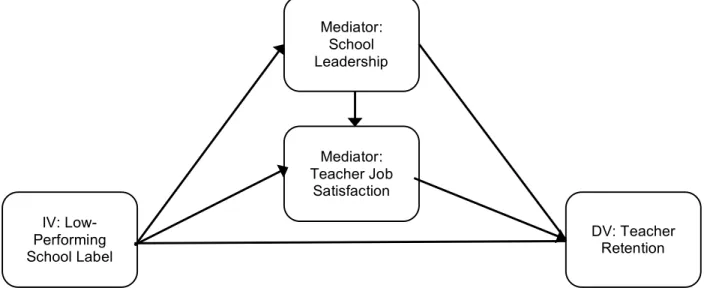
achievement and status provided by one’s job, while hygiene factors, including administrative practices and working conditions, prevent dissatisfaction (pp. 113-114). In the context of this study, the low-performing school label impacts motivation, whereas school leadership impacts hygiene. Specifically, it is theorized that the stigma associated with a low-performing school designation reduces the amount of satisfaction that one can draw from the status provided by one’s job, and overall job satisfaction is mediated by the role school leadership plays in influencing the amount of dissatisfaction with the job environment.
Figure 1. Conceptual framework.
Research conducted by Clotfelter et al. (2004) suggests that the low-performing school label impacts teacher retention. They found that labeling schools as low-performing increased the probability of departure by 25% for experienced teachers in schools designated as low-performing schools. Further, research conducted by Tickle, Chang, and Kim (2011) found that the school leadership variable of administrative support mediated the effect of teaching
experience, student behavior, and teachers’ satisfaction with their salary in regard to teachers’ job satisfaction and intent to continue teaching. This study examined the effect of the new
low-DV: Teacher Retention Mediator:
School Leadership
Mediator: Teacher Job
Satisfaction IV:
Methodology
This study used a quantitative causal-comparative design. The sample included all North Carolina public schools, excluding public charter schools. The treatment group included the 202 schools that were newly designated as low-performing schools during the 2015–2016 school year that would not have met the criteria of a low-performing school under the state’s previous
definition. The control group included the other 2,276 North Carolina public schools that were not impacted by the state’s new definition of a low-performing school. This study analyzed secondary data files from the North Carolina Department of Public Instruction (NCDPI) as well as survey data from the NCTWC. Data analysis using descriptive and inferential statistics was conducted using Stata data analysis and statistical software in order to answer the primary and secondary research questions.
Assumptions and Limitations
There are several assumptions and limitations of this study. First, this study assumed that a change in the school’s reputation due to the addition of the low-performing school designation will impact a teacher’s decision to stay or leave his or her current school. Second, this study assumed all other factors were equal and the schools in the sample have not had any significant changes other than the addition of the low-performing school designation.
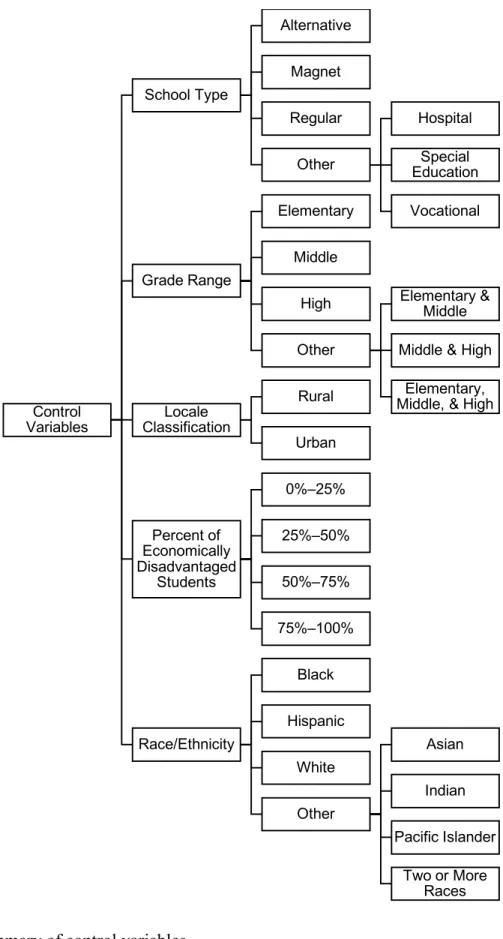
by other variables apart from being designated as a low-performing school. This limitation was addressed in the analysis by controlling for other variables that may have impacted the teacher retention rate. Control variables included school type, grade range, locale classification, percent of economically disadvantaged students, and percent of students by race/ethnicity.
Definition of Terms
The following terms and definitions will be used throughout this study:
Administrative Support: The extent to which principals and other school leaders make teachers’ work easier and help them to improve their teaching (Boyd et al., 2011).
Effective Teacher: One who receives a rating of at least “proficient” on each of the Teacher Evaluation Standards 1 – 5 and receives a rating of at least “Meets Expected Growth” on Standard 6 of the Teacher Evaluation Instrument (North Carolina Department of Public Instruction, 2015a).
High-Poverty School: A public school where more than 75% of the students are eligible for free or reduced-price lunch (Kena et al., 2016).
Low-Performing School: (1) Current definition: Schools that receive a school performance grade of D or F and a school growth score of "met expected growth" or "not met expected growth” as defined by G.S. 115C-83.15. (2) Previous definition: Schools in which there is a failure to meet the minimum growth standards, as defined by the State Board, and a majority of students are performing below grade level. (Current Operations and Capital Improvements Appropriations Act of 2015, 2015).
School Leadership Practices: The practices school leadership employs in order to create trusting, supportive environments, and address teacher concerns.
Teacher Attrition: The loss of a teacher from the profession.
Teacher Mobility: The relocation of a teacher from one school to another.
Teacher Retention: When a teacher remains in the profession. Teacher retention at the school level is when a teacher remains teaching in the same school from one year to the next. Teacher Turnover: The departure of teachers from their teaching jobs (Ingersoll, 2001).
Summary
CHAPTER 2: LITERATURE REVIEW Introduction
The purpose of this study was to examine the impact of North Carolina’s new definition of a low-performing school on teacher retention and teacher working conditions. This study was restricted to the newly designated public schools in North Carolina that would not have been designated as low-performing schools under the state’s previous definition. This chapter
examines the literature relevant to understanding the relationship between teacher retention and student achievement as well as how educational policies impact teacher retention in schools serving high poverty and minority students. The first section will examine background
information on teacher retention including trends, influential factors, and the impact on schools and students. The second section will review findings from past research evaluating the impact of school accountability policies and teacher compensation policies on teacher retention at schools serving high poverty and minority students. The third section will examine the role school-based administrators play in retaining effective teachers and how they mediate the policies examined in the previous section. The fourth section will synthesize and interpret the findings. The chapter will conclude with a brief summary of the research literature reviewed.
Teacher Retention Trends in Teacher Retention
of public school teachers leave their schools each year, with approximately 8% leaving to teach at another school and the additional 8% leaving the teaching profession (Goldring et al., 2014, p. 6). When examining school characteristics, the mobility rate increased as the percentage of students approved for free or reduced price lunches increased (Goldring et al., 2014). The mobility rate at schools with 75% or more of the students approved for free or reduced price lunches was twice as high as the mobility rate at schools with 34% or less of the students
approved for free or reduced price lunches (Goldring et al., 2014, p. 8). A higher turnover rate in high poverty schools as compared to more affluent schools has led to the examination of why teachers are leaving high poverty schools at higher rates and how this turnover has impacted the equitable distribution of teachers across schools.
According to the 2016–2017 State of the Teaching Profession in North Carolina report, the state’s attrition rate was 8.65%, the mobility rate was 4.80%, and the overall turnover rate was 13.45% for the 2016–2017 school year (North Carolina Department of Public Instruction, 2018). The teacher turnover rates in North Carolina for the past five years are listed in Table 1. Table 1
North Carolina Teacher Turnover Rates
School Year Total Teachers Total Turnover Turnover Rate
2012–2013 95,028 13,616 14.33%
2013–2014 96,010 13,557 14.12%
2014–2015 96,081 14,255 14.84%
2015–2016 95,549 12,799 13.40%
2016–2017 94,792 12,750 13.45%
Source: http://www.dpi.state.nc.us/educatoreffectiveness/surveys/leaving/ (2018) Factors That Influence Teacher Retention
demographics, teacher characteristics, and salary) as well as environmental factors (school characteristics, governance, and working conditions) (Liu, 2007). Examining characteristics surrounding schools with both high and low turnover rates can inform policymakers with knowledge relevant to improving retention in schools serving high poverty and minority students. Salary and working conditions have frequently been identified as primary factors impacting teacher retention (Hanushek & Rivkin, 2007; Johnson, Kraft, & Papay, 2012; Loeb et al., 2005).
Understanding the reasons teachers leave schools serving high poverty and minority students is central to designing and implementing polices to increase teacher retention. There are two theories surrounding why schools serving high poverty and minority students have relatively high teacher turnover rates. One theory is that teachers leave due to the characteristics of the students. The second is that they leave due to the working conditions, independent of the characteristics of the students.
The theory that student characteristics influence teacher retention implies that working conditions are dependent on student characteristics. Clotfelter et al. (2004) theorized that teachers will weigh both salaries and working conditions in their decisions on where to teach. They reasoned that most teachers prefer "easy-to-teach" students, and predicted that, given the same salary, teachers prefer positions with fewer disadvantaged students. They noted, “More advantaged students are likely to be easier to teach because they are more likely than
conditions and salary in teachers’ decisions, Hanushek et al. (2004) found that teacher mobility was more strongly related to student characteristics than salary.
In contrast, more recent studies support the theory that teachers leave schools serving high poverty and minority students at higher rates due to differences in working conditions that stretch beyond student composition. Johnson et al. (2012) found evidence that independent of schools’ student demographic characteristics, teachers’ work context is an important predictor of their job satisfaction and intentions to continue teaching at their current school. In a statewide study analyzing school working conditions with demographic and student achievement data in Massachusetts, researchers found that teachers were more likely to transfer from schools with less supportive working environments and that collegial relationships, principal leadership, and school culture were the elements that had the greatest impact (p. 24). Results from studies in New York City (Boyd et al., 2011) and North Carolina (Ladd, 2011) also found similar patterns. Linking the reasons teachers leave schools serving high poverty and minority students to
changeable working conditions rather than student characteristics implies that a policy solution to reducing teacher turnover exists. It also raises the question of what current polices have contributed to the disparities in teacher turnover rates.
Impact of Teacher Retention on Schools and Students
Teacher retention impacts schools instructionally, organizationally, and financially (Johnson, et al., 2005). First, access to an effective teacher is critical to students’ academic achievement. Second, a stable workforce provides continuity. Third, time and resources must be devoted to recruiting and hiring new teachers.
learning (McCaffrey et al., 2004; Rivkin et al., 2005; Rockoff, 2004). To this end, teachers are a resource, and equitable resource allocation must include the equitable distribution of teachers across schools. When examining how teacher turnover impacts teacher distribution, the primary concerns are determining who is leaving and what characteristic surround schools with both high and low retention.
Schools can benefit from some turnover. An example of this phenomena is when a teacher leaves and is replaced by a more effective teacher or when new teachers bring innovative ideas. However, high turnover may be a sign of organizational problems and negatively impact student learning (Mobley, 1982; Price 1977). West and Chingos (2008) theorized that the optimal pattern for teacher turnover “may be high attrition rates among the least effective teachers and low attrition rates among the most effective teachers” (p. 3). Goldhaber’s (2010) findings suggested that policymakers should focus on improving the quality of the teacher workforce in order to improve student achievement. Schools serving high poverty and minority students are more sensitive to the effects of turnover because they often have a difficult time recruiting teachers (Betts, Rueben, & Dannenberg, 2000).
While the need for effective teachers is obvious, determining the impact of who stays, leaves, or moves has been a challenge for researchers. Researchers have used education, experience, and more recently teacher performance data, composed primarily of teacher evaluation data and students’ standard test scores, to determine the quality of teachers. While there is no evidence that higher salaries result in more effective teachers, research has found that salaries are more likely to be positively related to student achievement than negatively
The U.S. Department of Education’s Excellent Educators for All Initiative required each state to submit an updated plan describing the steps it will take to meet the Elementary and Secondary Education Act’s requirement to “ensure that poor and minority children are not taught at higher rates than other children by inexperienced, unqualified, or out-of-field teachers”
(Williams, Adrien, Murthy, & Pietryka, 2016, p. 1). A majority of states have reported that low income students are taught by inexperienced and less qualified teachers at higher rates than higher income students (Williams et al., 2016). This discrepancy is supported by several research studies (Betts et al., 2000; Clotfelter, Ladd, Vigdor, & Wheeler, 2007; Lankford, Loeb, &
Wyckoff, 2002). States identified conditions, insufficient educator preparation and human capital management systems as the root causes of equity gaps in access to excellent educators. Students in high poverty schools should have access to similar quality teachers as students in schools serving more advantaged students.
When examining how educational polices have impacted teacher retention at schools serving high poverty and minority students, policymakers must consider both intended outcomes and unintended consequences. Marshall and Gerstl-Pepin (2005) pointed out that “polices often create effects that are quite the opposite of their original intentions” (p. 254).They referenced the concept of the policy web to explain the interconnected nature of polices at the district, state, and federal level.
Policies Impacting Teacher Retention
While the United States Constitution gives states power to govern education, federal education policies have had a considerable impact on education in the United States. They are usually broad and lack specific regulations regarding how the policies should be implemented. The interpretation of the goals and aims of federal policy along with the state conditions shape the creation of state and local policies. One federal policy can lead to the passage of hundreds of different state and local policies. The variance in the design and implementation these policies can lead to drastically different outcomes in the practice of a federal policy across the country. As McLaughlin (2005) noted, “What actually happens as a result of a policy depends on how policy is interpreted and transformed at each point in the process, and finally on the response of the individual at the end of the line” (p. 60). In the case of education policy, school-based
administrators and teachers are most often the individuals “at the end of the line” affecting policy outcomes.
and address weaknesses and inequities found in states’ education policies (Marshall & Gerstl-Peppin, 2005). A key federal education policy that has impacted schools serving high poverty and minority students is the Elementary and Secondary Education Act (ESEA) of 1965, and its reauthorization through the No Child Left Behind (NCLB) Act of 2001. No Child Left Behind aimed to improve test scores and access to qualified teachers in order to raise academic
achievement for all students and close the achievement gaps between high- and low- poverty students, and between minority and nonminority students (Darling-Hammond, 2007). The passage of NCLB has shaped numerous policies at the state and local level including school accountability policies and teacher compensation policies. Many of these policies have directly and indirectly impacted teacher retention and the distribution of teachers at schools serving high poverty and minority students.
This literature review will examine two broad categories of state and local policies that have impacted teacher retention at schools serving high poverty and minority students: school accountability policies and teacher compensation policies. The policies’ impact on both teacher retention rates and the equitable distribution of teachers will be examined.
School Accountability Policies
accountable for student achievement. A review of school accountability report cards found 14 states had an A-F rating system for schools (Thomsen, 2013). Publically identifying a school as low-performing or failing attached a stigma to the school that policymakers hoped schools would strive to remove. It was assumed that schools would work harder to improve student
achievement in order to remove the label. While the negative stigma of being identified as a low-performing or failing school may motivate some teachers to improve, it may motivate others to leave the school (Mintrop, 2004).
Hanushek et al. (2004) found that at all levels of experience, higher average student achievement significantly reduced the probability that a teacher would transfer within or leave Texas public schools. They found that within urban districts in Texas, teachers transferred to schools with fewer academically and economically disadvantaged students. The probability of teachers transferring to another school in the district was 1.7% higher in schools with average test scores in the bottom quartile as compared to schools in the top quartile (Hanushek, et al., 2004).
Clotfelter et al. (2004) examined the extent to which North Carolina’s school-based accountability system, the ABCs program, affected the desirability of one type of school relative to another. Specifically, they were interested in whether schools serving low-performing students experienced additional challenges recruiting and retaining high-quality teachers as a result of the ABCs program. The ABCs program labeled schools as “low performing” if less than 50% of their students were at grade level and they did not meet their school-specific growth standard (Clotfelter et al., 2004). They found that the low performing designation increased the
undergraduate college the teacher attended. They did not find evidence that the accountability system adversely affected the quality of teachers in low-performing schools.
Boyd, et al. (2005) found that highly qualified teachers in New York City were more likely to transfer to another school or leave teaching when teaching in low-performing schools. They also examined the distance from new teachers' prior homes to their initial job, and found that teachers who were not residents of New York City when they applied for certification were approximately five times more likely to transfer to another district after their first year. Their findings indicate that some of the higher turnover in low-performing schools may be due to teachers’ preferences to work near their homes rather than preferences to avoid low-performing schools.
Feng, Figlio, and Sass (2010) examined how Florida’s new school accountability
program affected teachers’ mobility decisions. They were specifically interested in the extent to which increased accountability pressure affected teachers’ decisions to leave struggling schools. They found that schools that received lower grades under the new accountability system had higher turnover than those that did not experience a change, and the effects were strongest in schools that received an “F”. As compared to teachers in schools that did not receive a lower grade under the new accountability system, teachers in schools who receive a grade of "F" were “over 40 percent more likely to leave their school” and were “nearly 70 percent more likely to move to another school in the same district” (Feng et al., 2010, p. 22). They referred to this experience as “downward accountability shock.” When using students’ average achievement gains to analyze the quality of the teachers that stayed and left, they found that while the average quality of teachers that stayed improved at downward shocked schools, that the average quality of teachers that left improved more than the teachers that stayed. Their results indicate that while increased accountability pressure may have led to improvements in teacher quality as measured by students’ average achievement gains, it also increased the likelihood of high-quality teachers leaving struggling schools. Feng et al. (2010) proposed a policy solution of offering the most effective teachers increased incentives to remain in the school.
with high probabilities of making AYP. Similarly, Grissom, Nicholson-Crotty, and Harrington (2014) analyzed the 1994–2008 Schools and Staffing Survey data to examine teachers’
perceptions of their work environments and related job attitudes, including satisfaction and commitment to remain in teaching. In contrast to findings by Reback, et al. (2014), they found little evidence that NCLB affected teachers’ job satisfaction or commitment to remain teaching when comparing states with and without prior accountability systems or when further assessing this difference across high- and low-poverty schools.
Furthering the knowledge of both of these studies, Sun, Saultz, and Ye (2016) analyzed nationally representative samples from both the Schools and Staffing Surveys and Teacher Follow-Up Surveys from 1993–2009 to examine the effects of the NCLB on voluntary and involuntary teacher attrition and mobility. They examined how the effects of NCLB differed for teachers in tested subjects and grades and for teachers in disadvantaged schools that served a larger proportion of minority or poor students. Their findings suggested that NCLB
accountability did not change the average national rate of voluntary teacher attrition or mobility. Examining the impact on disadvantaged schools, they estimated that NCLB increased
involuntary teacher mobility in 2004–2005 and had no influence on voluntary teacher attrition or mobility.
Teacher Compensation Policies
monetary compensation, perhaps in a targeted way” (p. 1353). Researchers have found that teacher compensation policies have had differing impacts on teacher retention. Some have been designed to address teacher retention issues, while others have had unanticipated effects on teacher retention. Overall, research has shown that variations in salary influence teacher
retention. This section will examine how salary schedules and incentive pay plans have impacted teacher retention at high poverty schools.
Salary schedules. The use of salary schedules to determine teacher compensation is widespread. Podgursky (2006) found that 96% of school districts reported having a salary schedule for teachers (p. 11). Salary schedules can impact mobility of teachers within and across districts. Increases in salaries have been found to decrease teacher turnover. A study on new teacher retention in California found that the probability of elementary teacher turnover decreased by 17% with a salary increase of $4,400 (Reed, Ruben, & Barbour, 2006).
Most salary schedules are applied uniformly across all schools in a district. Almost all base pay solely on years of experience and level of education; they do not differentiate based on field, performance, or working conditions. This structure can pose recruitment and retention challenges to high poverty schools that often have more challenging working conditions than more affluent schools. Teachers in districts with uniform district-wide salary schedules may be reluctant to remain teaching at high poverty schools if they can transfer to another school in the district with students that are less challenging to educate and earn the same salary (Ladd, 2009). Podgursky (2006) argued that rigid salary schedules contribute to equity gaps in the experience and
When salaries are standardized across all schools in a district, teachers often transfer from high poverty schools to more affluent schools. In Texas public schools, Hanushek and Rivkin (2007) noted, “For those teachers who move, the type of students changes far more than their salaries do” (p. 76). They found that on average teachers transferred to schools where the number of students eligible for free or reduced-price lunch was 6% lower, while the change in salary was less than 1% (p. 76).
Salaries vary across districts, and districts serving high poverty students often have lower salaries than districts serving more affluent students. Adamson and Darling-Hammond (2012) found considerable variation in teachers’ salaries across districts; even those within the same county or labor market. Wage disparities between the highest salary districts and lowest salary districts in a labor market were found to be as large as a 2:1 ratio (p. 25). Districts paying lower salaries have been found to face challenges recruiting and retaining experienced and qualified teachers. Results from the 2012–2013 Teacher Follow-up Survey revealed that both attrition and mobility decreased as teachers’ salaries increased (Goldring et al., 2014).
Hanushek et al. (2004) found that Texas public schools serving academically
Using data from new teachers in Wisconsin, Imazeki (2005) found that salary increases were most effective in reducing transfers in female teachers when salaries were increased relative to nearby districts (p. 432). She suggested that wage increases of 20% could reduce attrition in urban districts to levels similar to an average district (p. 448). Additionally, she cautioned policymakers that “wage increases across all districts, that do not change relative wages, could have little direct effect on female transfer attrition rates” (p. 432).
Adamson and Darling-Hammond (2012) found that a 1% increase in average adjusted teacher salaries was associated with a 4% reduction in turnover in California. Further, they found that the lowest-salary districts had nearly twice as many low income students, teachers without a permanent credential, teachers with lower education, and teachers with fewer than three years of experience. They also found that class sizes were nearly 20% larger in the lowest-salary districts compared to the highest-salary districts (p. 22). Similarly, the highest-poverty districts had higher turnover, more teachers without credentials, and teachers with less education and
experience as compared to the lowest-poverty districts (Adamson & Darling-Hammond, 2012, p. 24). An analysis of teacher salaries in Nassau County in New York found that the highest
salaries were paid in suburban districts with very low percentages of high poverty students (Adamson & Darling-Hammond, 2012, p. 26).
Incentive pay plans. Incentive pay plans for teachers are often designed to improve teacher retention, student achievement, or both.They include retention bonuses and performance bonuses. Some policies have been implemented across all schools in a state or district and others have been limited to schools with less desirable working conditions.
five states were found to have targeted bonuses to high-need schools (Wheeler & Glennie, 2007, p. 2). The use of retention bonuses is based on the theory that high turnover in high-needs schools can be mitigated by a relatively small financial incentive (Springer, Swan, & Rodriguez, 2016). Barnard (1938/1968) noted that “when the burdens involved are numerous or heavy, the offsetting positive advantages must be either numerous or powerful” (as cited in Shafritz, Ott, & Jang, 2011, p. 97).He suggested that increasing wages was one way to increase positive
inducements; however, he also noted the limitations of material inducements. Barnard included several classes of inducements: material inducements, personal non-material opportunities, desirable physical conditions, and ideal benefactions (as cited in Shafritz, Ott, & Jang, 2011, p. 98). Some districts have used pure retention bonuses, those that are awarded solely for returning to a teaching position in the school or district, while others are tied to performance. Springer et al. (2016) suggested using retention bonuses tied to teacher effectiveness as a policy solution for improving the quality of teachers serving disadvantaged students (p. 216). They noted, “Because teachers across the effectiveness spectrum leave high-poverty, high-minority schools regularly on their own volition and are generally replaced by less experienced and effective teachers, bonuses that retain the teachers at the higher end of the effectiveness distribution can have substantial impacts on the quality of a school’s faculty” (p. 216).
represented approximately 4% of a teacher’s base salary on average (p. 1355). The program provided bonuses for all teachers certified in math, science or special education at an eligible school regardless of performance.
In 2013, Tennessee implemented a retention bonus program in its Priority Schools (the lowest performing 5% of schools). The program provided a $5,000 bonus to teachers rated “Significantly Above Expectation” (Level 5) during the 2012–2013 school year that remained teaching at a Priority School during the 2013–2014 school year. Springer et al. (2016) found that the rate of retention increased approximately 20% for Level 5 teachers of tested subjects and grades in Priority Schools. By targeting the bonuses to teachers rated “Significantly Above Expectation” the program was able increase low performing schools’ retention of the states’ most effective teachers.
Performance bonuses for public school teachers have been used in a variety of ways. Polices have included bonuses based on student achievement and teacher evaluation ratings. Berry (2009) found that many incentive pay plans have begun using a comprehensive approach to determining teacher effectiveness. He noted that “many school districts that have tried to enact performance pay using standardized tests as measures of teaching effectiveness have struggled to do so reliably and accurately” (p. 14). Some incentives were earned on an individual basis while all teachers in a school based on school wide results received others. Using a nationally
evaluations, and provided teachers incentives to take on additional responsibilities and leadership roles (U.S. Department of Education, 2016). The program has funded funded 131 projects
serving over 2,000 schools in 36 states (U.S. Department of Education, 2016).
In an evaluation of Texas’ Governor’s Educator Excellence Grant (GEEG) Program, Springer et al. (2009) found that the program had a significant impact on teacher turnover. The probability of turnover decreased for both beginning and experienced teachers as the size of the GEEG bonus award increased. The GEEG Program was implemented in high poverty, high performing Texas public schools. It provided performance bonuses for teachers based on performance indicators determined at the district level. Similarly, Taylor and Springer (2009) found that teacher-designed incentive pay plans in the GEEG program did not appear to induce significant changes in teacher productivity, but they did have a significant impact on teacher turnover (p. 5). They found that the probability of turnover decreased for teachers that received a bonus and increased for teachers that did not receive a bonus (p. 30).
North Carolina’s ABCs accountability program provided $1,500 bonuses to teachers in schools designated as “exemplary” (Ladd & Zelli, 2002). Ladd and Zelli (2002) found that the program made schools designated as low performing “even less attractive than in the absence of the program because teachers have a greater chance of receiving financial bonuses and positive recognition as professionals at other schools” (p. 523). Qualitative data from principals of schools that were designated as low performing indicated that they had difficulty recruiting and retaining high-quality staff members (p. 523). Ladd and Zelli predicted that the program would cause disparities in schools serving disadvantaged and low-performing students and reduce their ability to retain effective teachers (p. 523). Their predictions are consistent with studies that found that teacher turnover increased for teachers who did not receive a bonus (Springer et al., 2009, p. 105). It can be theorized that bonuses for gains in student performance may increase turnover at high poverty schools where teachers are less likely to receive a bonus.
The Role of School-Based Administrators in Teacher Retention
Researchers have theorized that while both teacher factors and environmental factors influence teachers’ job satisfaction and intent to continue teaching, that this relationship is mediated by school-based administrators. Burkhauser (2017) noted, “A growing body of
schools serving high poverty and minority students schools due to the challenging working conditions that often characterize these schools.
Previous research has identified a relationship between administrative support and teacher retention. Ingersoll and Smith (2003) analyzed nationally representative samples from both the Schools and Staffing Surveys and Teacher Follow-Up Surveys, and found that poor administrative support along with low salaries and student discipline problems were the primary reasons for dissatisfaction in beginning teachers that left their teaching jobs. Similarly, in
examining predictors of high rates of school-level turnover, Loeb et al. (2005) found that poor working conditions, low salaries, and student characteristics impacted teacher retention in California schools with high turnover. They found that the impacts of the schools' racial compositions and proportions of low-income students on teacher turnover were substantially reduced when taking working conditions and salaries into account. Ladd (2009) also found that when controlling for student demographic data, teacher working conditions were predictive of teacher turnover in North Carolina, and identified the quality of school leadership as a primary factor influencing working conditions.
teachers’ job satisfaction, and teachers’ job satisfaction as the most significant predictor of teachers’ intent to stay in teaching. Notably, they found that administrative support mediated the effect of teaching experience, student behavior, and teachers’ satisfaction with their salary on teachers’ job satisfaction and intent to continue teaching. Their findings suggested that improving teachers’ perceptions of administrative support would improve teacher retention.
Grissom (2011) examined the effects of principals on teacher satisfaction and turnover in high poverty and high minority schools using 2003–2004 Schools and Staffing Survey data and 2004–2005 Teacher Follow-Up Survey data. His findings suggested that both teacher satisfaction and teacher turnover may be impacted more by the quality of the principal in these traditionally hard-to-staff schools than in an average school. He found evidence that a 1.5 standard deviation increase in principal effectiveness would offset the turnover differential between hard-to-staff schools and other school. Notably, he also found that principals with higher teacher ratings were disproportionally located in schools serving more affluent students and less racial and ethnic minority students. Branch, Hanushek, and Rivkin (2012) examined how principal quality, as measured by student learning gains, impacted teacher turnover in Texas. They found that teacher turnover was highest in schools with the least effective principals, irrespective of the proportion of high poverty students. They also investigated whether high quality principals were more effective in retaining effective teachers and moving out ineffective teachers. They found evidence that the best principals were able to move out a greater proportion of ineffective teachers.
had a greater impact on job satisfaction than organizational factors. They noted that teachers were “three times more likely to plan to transfer from schools with particularly poor conditions of work than are teachers whose work environment is of average quality (p. 30). They found that teachers in high poverty and high minority schools reported having a less supportive working environment. Controlling for student demographics, they found that differences in the working conditions accounted for the largest proportion of the variance in teachers’ job satisfaction.
Synthesis
The purpose of this literature review is to examine what recent educational policies have
impacted teacher retention at schools serving high poverty and minority students, and in what ways. The research literature reviewed also examines how school-based administrators in these schools mediate these policies. Upon reviewing factors that have been found to impact teacher
retention, both working conditions and salary were identified as primary factors influencing
teachers’ decisions to stay or leave their current positions. Based on their relationship with these factors, school accountability policies and teacher compensation policies were selected to
School Accountability Polices
While school accountability polices intend to identify and close achievement gaps, in
many ways they have further disadvantaged the students they aimed to help. Many of the accountability polices negatively impacted teacher working conditions and the effect has been more pronounced at schools serving high poverty and minority students. Given that these schools often have lower student achievement scores than schools with fewer disadvantage students, they are more likely to be faced with sanctions due to poor student achievement. Additionally, the systems’ rewards often seem out-of-reach to teachers. Faced with increasing accountability pressure, teachers often choose to leave schools serving high poverty and minority students. Turnover of ineffective teachers can benefit schools if they are able to fill the vacancy with a more effective teacher. Additionally, there is no guarantee that ineffective teachers are not just shuffled around and rehired by other schools (Allensworth et al., 2009). The research is
inconclusive on how turnover in low-performing schools has impacted the schools’ overall teacher quality. Policymakers must examine how accountability systems disproportionally penalize schools serving high poverty and minority students, and understand how these effects influence teacher job satisfaction and retention.
Teacher Compensation Policies
The research supports the claim that salaries influence teacher retention. The current
Policymakers must offset the “burdens” often faced by teachers in schools serving high poverty and minority students in order to stem the migration of teachers to schools serving fewer
disadvantaged students. When pay is standardized across all schools in a district, there is little incentive to continue teaching at a school with poor working conditions. Ferguson (1991) noted, “equal salaries will not attract equally qualified teachers to dissimilar school districts” (p. 489).
Disparities in salaries across districts have also disproportionally impacted schools serving high poverty and minority students. Districts serving large numbers of high poverty and minority students will likely continue to lose teachers to districts serving fewer disadvantaged students if
they cannot offer comparable salaries. Given the disparities that often exist in salary schedules across districts, incentive pay in districts serving high poverty and minority students may not be enough to supplement the base pay to make it comparable to districts serving fewer
disadvantaged students (Adamson & Darling-Hammond, 2012). Equitable salary schedules within and across districts are a policy solution to reduce turnover in high poverty schools. The research suggests salary schedules could be used as a policy tool to improve teacher retention at
schools serving high poverty and minority students if they were redesigned to account for the differing working conditions across schools in a district.
Hanushek (2007) argued against the use of salary schedules based on education and
experience, and cautioned against using across-the-board raises to improve retention in schools
serving high poverty and minority students since there is no evidence that these actions improve the quality of teachers. He advocated that policies should be designed to retain high-quality teachers, not solely to reduce turnover. He proposed moving to a system that emphasizes
performance. The research examined indicates that the impact of incentive pay plans on retention
of the plan. Incentive pay plans were based on a variety of performance measures including
teacher evaluations and proficiency and growth on student’s standardized test scores. Some were
earned by all teachers in a school based on meeting schoolwide goals, while others were earned
on an individual basis. Goldhaber (2010) reasoned that while incentive pay plans can be used as
a policy tool to more fairly distribute teachers across schools, retain effective teachers, and
increase student achievement, “Teachers’ jobs are complex and multidimensional, and we know
very little about how to objectively and accurately quantify their productivity” (p. 2). He
cautioned against implementing incentives that may cause unintended effects. Similarly, Gibbons (1998) noted that “it is no use creating strong incentives for the wrong actions” (p. 119) Ladd and Zelli (2002) applied this theory to incentive pay within school accountability programs and proposed limiting financial incentives based solely on the results of state tests. Goodman and Turner (2010) argued the importance the design of teacher performance pay played in achieving
intended outcomes. Policies that provided retention bonuses for effective teachers on an
individual basis were most successful in retaining effective teachers in schools serving high poverty and minority students.
The Role of School-Based Administrators
schools. The Rand Change Agent Study found that “implementation dominates outcome” (as cited in McLaughlin, 2005, p. 60). School-based administrators play an important role in mediating the effects of federal, state, and local policies.
Working conditions separate from those directly resulting from student composition
influence teacher retention (Boyd et al., 2011). School-based administrators can have a large role
in shaping the schools’ climate and culture. These social factors impact teachers’ job satisfaction.
Johnson et al. (2012) noted, “It is surely important to have safe facilities, adequate resources, and sufficient time for preparation, but if teachers are to achieve success with their students—
particularly low-income and high minority students who rely most on the school for their learning—they also must be able to count on their colleagues, their principal, and the organizational culture of the school to make success possible” (p. 27).
Policymakers must consider how policies impact working conditions if they want to retain talented, effective teachers in high-poverty, hard-to-staff schools (Simon & Johnson, 2013). Johnson et al. (2012) noted, “If schools are to attract and retain the best possible teachers to work with the students who need them most, those schools cannot be workplaces of
Summary
While numerous federal, state, and local educational policies have been implemented in the last decade, few have been formally evaluated to determine their impact on America’s schools and students. The research literature reviewed in this section has provided some
CHAPTER 3: METHODOLOGY Introduction
The purpose of this study was to examine the impact of North Carolina’s new definition of a low-performing school on teacher retention and teacher working conditions. This study was restricted to the newly designated public schools in North Carolina that would not have been designated as low-performing schools under the state’s previous definition. The primary research question was: How has North Carolina’s new definition of a low-performing school impacted teacher retention in newly designated schools that did not meet the criteria for low-performing under the state’s previous definition? The hypothesis was that newly designated low-performing schools will have lower teacher retention rates compared to past years and compared to other North Carolina public schools for the same year. The secondary research question was: How has North Carolina’s new definition of a low-performing school impacted teacher working
conditions in newly designated schools that did not meet the criteria for low-performing under the state’s previous definition? The hypothesis was that newly designated low-performing schools will have lower ratings on the North Carolina Teacher Working Conditions Survey (NCTWC) compared to past years and compared to other North Carolina public schools for the same year.
This chapter outlines the methods of this study. The first section will identify the research design and its connection to the research questions. The second section will identify the
set and a description of the data being examined. The fourth section will describe the data analysis plan. The chapter will conclude with a brief summary of the methods.
Research Design
This study used a quantitative causal-comparative design. The design allowed the researcher to examine the relationship between the low-performing school label (independent variable) and teacher retention and teacher working conditions in North Carolina public schools (dependent variables). The analysis controlled for other variables apart from being designated as a low-performing school that may have impacted the teacher retention rate. Control variables included school type, grade range, locale classification, percent of economically disadvantaged students, and percent of students by race/ethnicity. Causal-comparative research does not definitively prove the independent variable caused the change in the dependent variable; however, the results demonstrate whether a relationship exists between the independent and dependent variables (Brewer & Kuhn, 2010). This study analyzed secondary administrative and survey data collected by the North Carolina Department of Public Instruction (NCDPI) and New Teacher Center (NTC). Once the data were obtained, the data were analyzed using descriptive and inferential statistics. Following the analysis, the researcher interpreted the results and reported the findings.
Population and Sample
were designated as low-performing schools during the 2015–2016 school year. There were 202 newly designated schools that would not have met the criteria of a low-performing school under the state’s previous definition. The sample was separated into treatment and control groups. The treatment group included the 202 schools that were newly designated as low-performing schools during the 2015–2016 school year that would not have met the criteria of a low-performing school under the state’s previous definition (New LPS). The control group included the other 2,276 North Carolina public schools that were not impacted by the state’s new definition of a low-performing school. The control group was separated into two groups. The first group included the 1,495 schools that were never designated as low-performing schools during the measurement window (Never LPS). The second group included the 781 schools that were designated as low-performing schools at least once during the measurement window, but were not newly designated as low-performing schools during the 2015–2016 school year due to meeting the criteria of a low-performing school under the state’s new definition (Old LPS).
Data Collection and Measures
2011 – 2012 Sc h o o l Ye a r 2012 – 2013 Sc h o o l Ye a r 2013 – 2014 Sc h o o l Ye a r 2014 – 2015 Sc h o o l Ye a r 2015 – 2016 Sc h o o l Ye a r 2016 – 2017 Sc h o o l Ye a r
2014 NCTWC Survey Administered
2016 NCTWC Survey Administered 2012 NCTWC Survey
Administered
Teacher Retention
Measurement Period Schools designated
North Carolina Department of Public Instruction Data Files
This study used the following NCPDI data files from the 2011–2012 through 2016–2017 school years: certified payroll data files to identify those paid as teachers and the schools in which they worked, teacher turnover data, school accountability data, and student and school demographic data. This section will further describe the NCPDI data files examined.
Certified payroll data files from the NCDPI payroll database were obtained for the 2012– 2013 through 2016–2017 school years. The files were used to calculate teacher retention rates, the primary dependent variable, at individual schools for the 2013–2014, 2014–2015, 2015– 2016, and 2016–2017 school years.To determine retention at the school level, each teacher’s unique identifier was queried against all employee budget codes in the previous year’s payroll data file. If a teacher’s unique identifier was found to be employed in the school as a teacher for both April of the current year and April of the previous year, the teacher was classified as retained at the school level. A measurement period of April to April was used because NCDPI indicated that the April data files were the most accurate representation of the school year (North Carolina Department of Public Instruction, n.d.). The data were aggregated at the school level in order to determine the teacher retention rates for each school during each of the four school years in the measurement period.
turnover rates by comparing the number of teachers employed during April of one year to the number of teachers not employed as a classroom teacher in the same school system during April of the following year (North Carolina Department of Public Instruction, n.d.). This measure of school teacher retention rates differed from the first measure because teachers that transferred to another school in the same district were counted as if they were retained at the same school. This second measure of school teacher retention rates was used for comparison with publically
available data.
School accountability data files were obtained for the 2011–2012 through 2014–2015 school years. The files were used to identify schools designated as low-performing schools, the independent variable. For the 2012–2013, 2013–2014, and 2014–2015 school years, schools were designated as low-performing schools based on the state’s previous definition which included those that received growth score of “not met expected growth” and had less than 50 percent of students scoring at or above Achievement Level III on Grade and End-of-Course tests. For the 2015–2016 school year, schools were designated as low-performing schools based on the state’s new definition which included those that received a school performance grade of D or F and a school growth score of “met expected growth” or “not met expected growth.”
school grades, and schools with elementary, middle, and high school grades. For locale classification there were two categories: rural and urban. Locale classifications were based on standard urban and rural definitions developed by the U.S. Census Bureau. For percent of economically disadvantaged students were are four categories: 0%–25%, 25%–50%, 50%–75%, and 75%–100%. The percent of economically disadvantaged students classification was based on the percentage of students qualifying for free and reduced priced lunches. For students’
Figure 3. Summary of control variables. Control Variables School Type Alternative Magnet Regular Other Hospital Special Education Vocational Grade Range Elementary Middle High Other Elementary & Middle
Middle & High
Elementary, Middle, & High Locale Classification Rural Urban Percent of Economically Disadvantaged Students 0%–25% 25%–50% 50%–75% 75%–100% Race/Ethnicity Black Hispanic White Other Asian Indian Pacific Islander