Call Center Analyser
User Guide
1.0.1 29/07/2014 Review and edits by G Broomhall
Table of Contents
1 INTRODUCTION ... 4
1.1 OVERVIEW ... 4
1.2 AVERAGE TALKVS. AVERAGE WAIT ... 4
1.3 ANSWEREDVS. ABANDONED ... 5
1.4 DETAILED DISTRIBUTION REPORT ... 6
2 ACCESSING THE CALL CENTER ANALYSER MODULE ... 7
2.1 PREREQUISITES ... 7
2.2 THE CALL CENTER ANALYSER PAGE ... 7
3 SCHEDULED EMAIL REPORTS ... 9
3.1 SETTINGUPTHE SMTP MAILSERVER ... 10
4 REPORTS ... 14
5 GRAPHS ... 15
6 REAL-TIME ... 16
Illustration Index
Figure 1: Distribution by Queue (Ave Wait vs. Ave Talk)...5Figure 2: Distribution by queue (Answered vs. Abandoned calls)...5
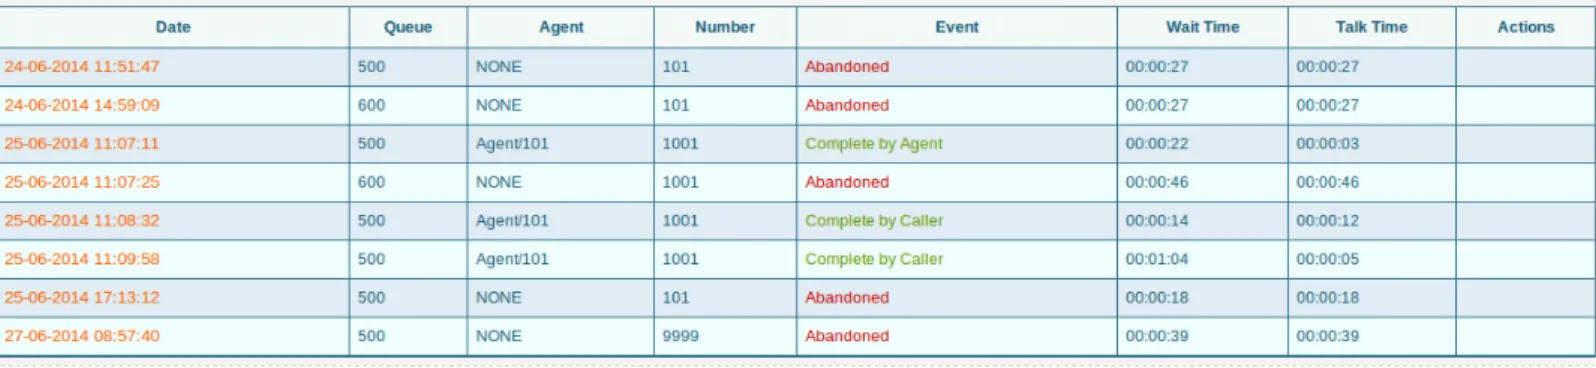
Figure 3: Detailed Distribution Report...6
Figure 4: Select “Call Center Analyser” to access the Call Center Analyser application 7 Figure 5: Call Centre Analyser login page...7
Figure 6: Call Center Analyser landing page...8
Figure 7: Navigating to the “Schedules/Alerts” page...9
Figure 8: Scheduled Reports page...10
Figure 9: Asternic Preferences page...11
Figure 10: SMTP Mail Server Setup...12
Figure 11: Call Center Analyser Scheduled Report Form...13
Figure 12: Example Distribution Report...14
Figure 13: An Example Graph (Ave Wait and Ave Talk)...15
1 Introduction
1.1 Overview
Powered by Asternic Call Center Stats Pro 2 and pre-integrated within Com.X PBX for ultimate flexibility and ease of use, Com.X Call Center Analyser is a flexible, real-time call queue monitoring package that allows a ComX Administrator to monitor a call centre's efficacy/productiveness by viewing and reporting on various selectable queue statistics.
These queue statistics can be viewed in a number of different ways, namely:
• Graphs (Distribution by queue)
• Reports (in csv or pdf format)
• Real-time Queue Monitoring
• Scheduled Emailed Reports
Note: See: http://www.asternic.net/features/ for further details on features that
Asternic has to offer.
1.2 Average Talk vs. Average Wait
“Distribution by Queue”: Call Center administrators can analyse multiple queues with one simple graph. Refer to Figure 1 below as an example. In this graph the average wait time and average talk time, measured in minutes, of each competing queue can easily be determined and therefore that particular queue's relative performance can be readily assessed.
Figure 1: Distribution by Queue (Ave Wait vs. Ave Talk)
1.3 Answered vs. Abandoned
“Answered vs. Abandoned”: Another helpful statistic is Answered vs. Abandoned which will allow the Call Center Administrator to gauge the basic effectiveness of that particular queue. Refer to Figure 2 below as an example for a queue labelled '6000'.
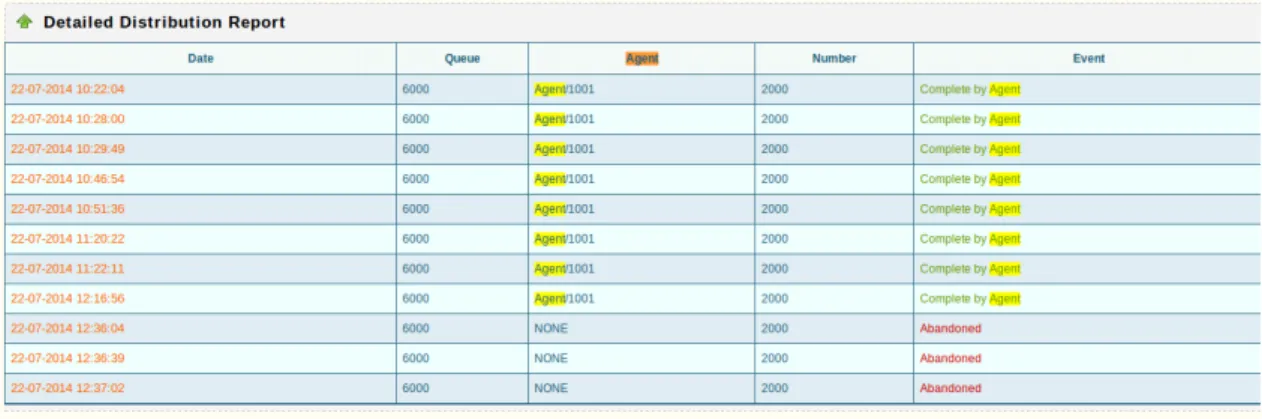
1.4 Detailed Distribution Report
The detailed distibution report is useful when an administrator needs a second by second account of how each individual agent interacted with the queue. This will show whether a particular agent answered or abandoned which specific incoming call and which actions were taken during that call. Refer to Figure 3 below fro a sample presentation.
Figure 3: Detailed Distribution Report
2 Accessing the Call Center Analyser Module
2.1 Prerequisites
• There must be at least 1 queue set up on the Com.X. Once configured, this
queue will be available for selection on the Call Center Analyser module's landing page.
• Licensing: Note that if a Call Center Analyser license has not been purchased
from Far South Networks the “Queue Stats” icon will not be visible.
2.2 The Call Center Analyser Page
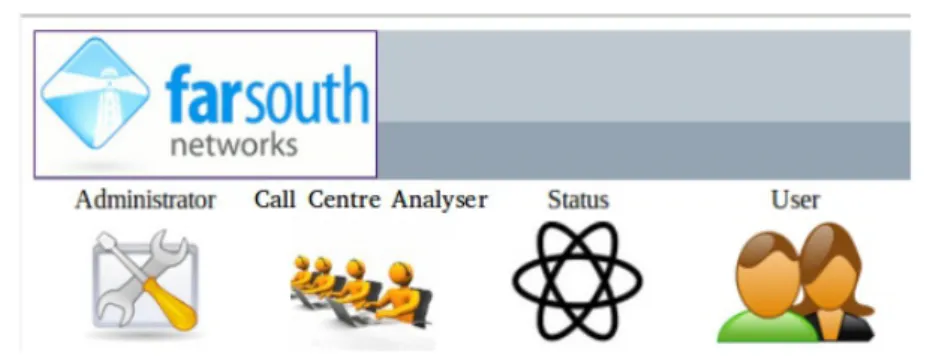
The Call Center Analyser module can be accessed by selecting the “Queue Stats” icon.
Figure 4: Select “Call Center Analyser” to access the Call Center Analyser application This will take you to the Login page below.
NB: Default login details are: User: 'admin' , Password: 'admin'.
Once licensing has been correctly set up and once logged into Call Center Analyser, the screen below should be visible. It shows a list of available queues on the left and a list of call center agents/extensions on the right.
Figure 6: Call Center Analyser landing page
3 Scheduled Email Reports
Once the desired statistics have been selected the system administrator is likely to want scheduled reports to be sent to their email address. Call Center Analyser
provides an automated mechanism to send reports via its “Setup-->Schedules/Alerts” page.
Figure 7: Navigating to the “Schedules/Alerts” page
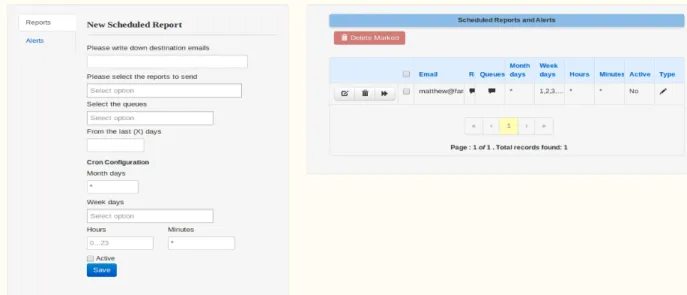
Once selected the page below should be visible. On the left is a new scheduled report creation form and on the right is a list of scheduled reports already stored in the 'qstats' database. In order for correct email schedule operation you must first set up your smtp mail server which is described in the next section.
Figure 8: Scheduled Reports page
3.1 Setting up the SMTP mail server
In order to set up scheduled reports a mail server must be set up first. If this is not yet set up the 'User' field in the “Mail Send Test” will display “You need to configure mail options here.”.
1. Click on “You need to configure mail options here” and you should see the
following page displayed:
Figure 9: Asternic Preferences page
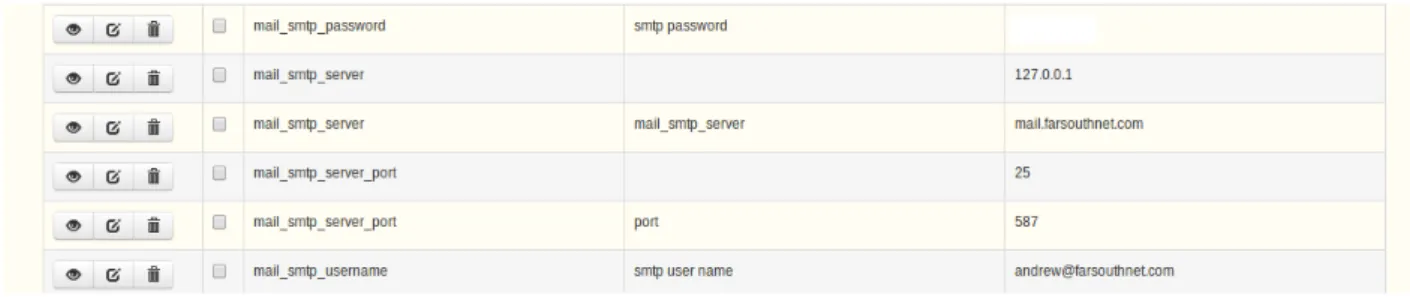
2. Click the “+Add” button. And fill in records for the following (See example in figure below): mail_smtp_server, mail_smtp_port, mail_smtp_username and mail_smtp_password.
Figure 10: SMTP Mail Server Setup
3. Once the records in step 2 have been added then fill in a destination email address and click the 'Test' button. See next page for step 4 ...
4. If the set up was successful then an email should be received by the destination email address.
Now that the mail server has been set up, we can now fill in a “Scheduled Report” (Refer to figure 11 below). Fill out destination emails below (note: More than one can be set however they must separated with a single ',' leaving no spaces in between). Select the reports to send and select which queues are to be monitored. Select the days of the week on which the reports are to be sent. Click the 'Save' button. Now regular emails will be sent to your specified email address.
NB: Scheduled emails can only be sent once a day!
4 Reports
Reports come in two different forms, 'predefined' reports allow the user to create reports based on a few generic predefined metrics such as “Unanswered Calls: by queue” or “Answered Calls: by wait time”. The other form of report is one which involves the report designer which allows you to create custom reports based on your own predefined metrics and formulas. Once the report has been created you can export it as either a PDF or CSV file.
Figure 12: Example Distribution Report
5 Graphs
Graphs will be displayed automatically when the “Display Report” button is clicked. The images themselves can be saved by right-clicking on the 'download' text immediately below the graph: click “save link as” and save to appropriate folder.
6 Real-time
This feature allows you to listen in on agent's phone calls in progress. It also allows you to 'whisper' to agents while the agent is talking to a client in order to pass on useful information. Figure 14 below presents a screen shot of the Real-time summary page. As you can see in the “Agent Status” window there are two queues being monitored, both of which are not in use at the moment. The “Queue Summary” window
immediately above gives useful over statistics like average duration and maximum wait time.
Figure 14: Real-time summary page