Wireless Condition Monitoring and Maintenance for Rooftop Packaged
Heating, Ventilating and Air-Conditioning
Srinivas Katipamula and Michael R. Brambley, Pacific Northwest National Laboratory
ABSTRACT
Rooftop package air-conditioners and heat pumps, while representing over half of U.S. commercial-building cooling energy consumption, are some of the most neglected of building systems. They are often found with inoperable dampers, dirty/clogged filters and coils, incorrect refrigerant charges, failing compressors, failed fans, missing enclosure panels, un-calibrated controls, failed sensors, and other problems. Frequently, actual operating hours deviate considerably from intended (and assumed) schedules.
Although there are no reliable estimates on what fraction of the units operate under degraded conditions and the energy inefficiencies associated with such operations, a range of savings from 10 to 30% is generally believed to be achievable by enhancing operation of these units. The potential nationwide energy savings from proper operation range from 23 to 70 trillion Btus annually in the U.S. Since the cost associated with conventional monitoring and servicing is quite high, conventional monitoring is seldom done. Combinations of wireless sensing and data acquisition, monitoring tools, automated diagnostics and prognostics show considerable promise to help remedy this maintenance problem for package heating, ventilating and air-conditioning (HVAC) units and the underserved small commercial building sector in which they are predominantly installed.
This paper characterizes the current problem with maintenance of packaged air conditioners and heat pumps, provides estimates of the total energy impacts of the problem, and describes a generic system in which these developing technologies are used to provide real-time condition monitoring for package HVAC units and their components. Costs with today’s technology are provided and future costs are estimated, showing that benefits will greatly exceed costs in many cases, particularly if low-cost wireless monitoring is used.
Introduction
Packaged cooling equipment is used in 42% (4.7 million) of all commercial buildings serving over 54% (36.5 billion sf) of the commercial building floor space in the U.S. (EIA 2002). The site cooling energy consumption associated with packaged cooling equipment is about 160 trillion Btus annually. Packaged heat pumps account for an additional 70 trillion Btus annually. Although packaged units consume a significant amount of energy annually (230 trillion Btus), they are some of the most neglected of building systems. During commissioning and re-tuning, they are often found with inoperable dampers, dirty/clogged filters and coils, incorrect refrigerant charges, failing compressors, failed fans, missing enclosure panels, incorrectly implemented controls, and other problems. Frequently, actual operating hours deviate considerably from intended (and assumed) schedules. Service contracts alone are not likely the solution to this problem.
These units are often run until a catastrophic failure occurs, such as complete loss of cooling caused by a failed compressor, failed condenser fan, failed supply fan, or significant loss of refrigerant. Upon complete failure, the owner, operator, or building occupant calls a service company to repair the unit. Complete failure, though, is often preventable. Avoiding failures by properly maintaining the equipment would reduce repair costs, increase operating efficiency, extend equipment life, and ensure comfortable conditions, but this would require awareness of equipment condition and when the equipment needs servicing. With increasing pressure to reduce operation and maintenance (O&M) costs and with the reduced number of operation staff in today’s facilities, regular visual inspection by staff is out of the question. Without a lower cost solution, package units are likely to continue to be maintained poorly and operated inefficiently.
Continuous Condition Monitoring
Packaged rooftop HVAC units consist of several sub-systems and components; therefore, complete condition monitoring of them would require several measurements. The problems/faults that can be detected depend on the number of sensor measurements and the diagnostic approach used. Although no reliable nationwide information exists on the types of problems and their prevalence, the data available is revealing. Stouppe and Lau (1989) reviewed over 15,700 insurance records that led to claims in HVAC and refrigeration equipment from 1980 through 1987, and Breuker and Braun (1998a) analyzed over 6000 service records of rooftop air-conditioner repairs by a service company between 1989 and 1995. Both studies found that the most common faults were electrical, whereas the most costly were due to compressor failure.
Because these studies only looked at insurance claims and service records, the faults identified in them are limited to those that are classified as “hard” failures. To correct hard failures, a service call is essential. Several studies, however, have also noted that packaged roof top units have operated under degraded conditions caused by insufficient refrigerant charge, broken dampers, stuck dampers, mis-calibrated sensors, failed sensors, lack of controls (e.g., proper schedules) and clogged heat exchangers (Katipamula et al. 2003, Ardehali et al. 2003 and 2002, Lunneberg 1999, PECI 1997). In general, these faults do not result in occupant discomfort because the system compensates by working harder (and expending more energy), and therefore, these faults are not generally reported nor are they corrected. Some of these faults require a service technician to correct, but many can be fixed with minor adjustments to controls or schedules and do not cause the HVAC system to fail completely; we call these faults “soft” faults.
Monitoring Plan, Automated Fault Detection and Diagnostics
Functionally, packaged rooftop units can be divided into two primary systems: 1) air side and 2) refrigerant side. The air-side system consists of the indoor fan, the air side of the indoor coil, and the ventilation damper system (including its use for air-side economizing), while the refrigerant-side components include the compressor, the refrigerant side of indoor and outdoor heat exchangers, the condenser fan, the expansion valve, and the reversing valve (for heat pumps).
The choice of the fault detection and diagnostic (FDD) approach depends on the type of faults to be identified and the sensor measurements available. Many researchers have developed FDD algorithms to detect and diagnose faults in air-conditioning equipment. In this paper we do not discuss the details of the diagnostic approaches which can be found in other references (Breuker and Braun 1998b, and Katipamula and Brambley 2004) but instead describe a monitoring plan and identify faults that can be detected using this plan.
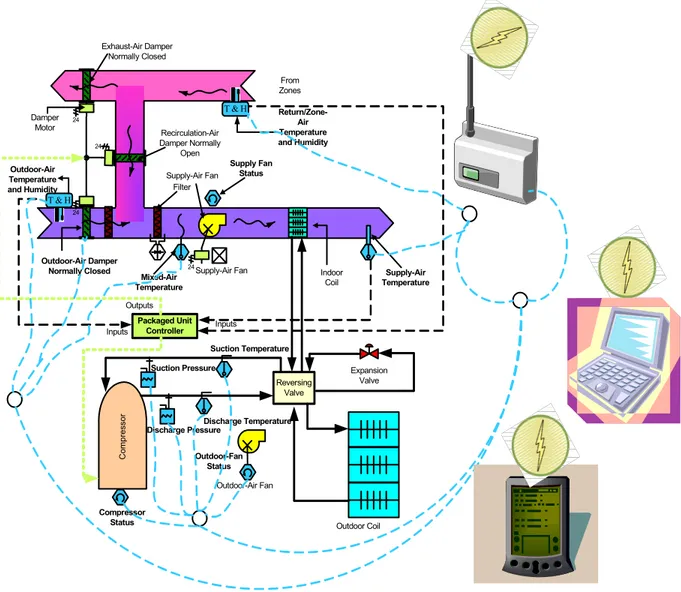
The minimum set of information required to monitor the state of the air-side system with temperature-based economizer controls or no economizing includes: 1) outdoor-air dry-bulb temperature, 2) return-air dry-bulb temperature, 3) mixed-air dry-bulb temperature, 4) outdoor-air damper-position signal, 5) supply-fan status, and 6) heating/cooling mode. To identify whether the system is actually in heating or cooling mode, the status of the compressor (and the reversing valve for heat pumps) is required. If these measurements are available, economizer operations and ventilation requirements can be monitored and evaluated to verify their correct performance. If an enthalpy-based economizer control is used, then the outdoor-air relative humidity (or dew-point temperature) and return-air relative humidity (if differential enthalpy controls are used) are required in addition to the 6 measurements needed to monitor the performance of systems with temperature-based economizer controls. If supply-air temperature is also measured, additional faults relating to control of supply-air temperature can be detected and diagnosed. Figure 1 shows a diagram of a measurement system for both the air side and the refrigerant side of a heat pump. Refer to Katipamula et al. (2003) for details on the diagnostic approach for detecting and diagnosing air-side faults. For refrigerant-side faults refer to Rossi and Braun (1997) and Breuker and Braun (1998a). A detailed review of both air-side and refrigerant-side diagnostics is also presented in Katipamula and Brambley (2004).
The faults that can be detected on the air side can be grouped into four categories: 1) inadequate ventilation, 2) energy waste, 3) temperature sensor and other miscellaneous problems including control problems, and 4) missing or out of range inputs.
The minimum set of measurements required to monitor refrigerant-side performance include: 1) outdoor-air dry-bulb temperature, 2) liquid-line temperature (refrigerant temperature as it leaves the condenser), 3) liquid line pressure (as it leaves the condenser), 4) suction line temperature (refrigerant temperature at the compressor inlet), and 5) suction line pressure (refrigerant pressure at the compressor inlet). In addition to the five measured quantities, several derived quantities are used in monitoring the refrigerant-side performance: 1) liquid sub-cooling, which is estimated as a difference between the condensing temperature (calculated from liquid pressure and refrigerant properties) and the measured liquid line temperature, 2) the superheat, which is the difference between the evaporating temperature (calculated from the suction pressure and refrigerant properties) and the measured suction temperature, and 3) condensing temperature over ambient, which is the difference between the condensing temperature and the outdoor-air dry-bulb temperature.
Figure 1. Schematic of Condition Monitoring System for Rooftop Packaged Units with Wireless Sensors
24 24 24 Exhaust-Air Damper Normally Closed Recirculation-Air Damper Normally Open Filter T & H Outdoor-Air Damper Normally Closed Damper Motor Outdoor-Air Temperature and Humidity Return/Zone-Air Temperature and Humidity T & H Mixed-Air Temperature Indoor Coil Supply-Air Temperature Packaged Unit Controller Outputs From Zones Inputs Inputs Supply-Air Fan 24 Supply Fan Status Supply-Air Fan Discharge Pressure Suction Pressure Suction Temperature Discharge Temperature Co mp re ss or Outdoor Coil Outdoor-Air Fan Outdoor-Fan Status Expansion Valve Compressor Status Reversing Valve
The refrigerant-side faults that can be detected with the five measurements (two pressures and three temperatures) include: 1) evaporator (indoor coil) heat transfer problems, 2) compressor valve leakage (compressor fault), 3) condenser (outdoor coil) heat transfer problems, 4) improper supply-fan speed, 5) expansion device fault, 6) improper charge (too little or too much refrigerant), and 7) non-condensable substances in the refrigerant, such as air in the system.
Additional measurements that improve diagnostic capability and also increase the number of faults that can be detected include: 1) supply-air dry-bulb temperature, 2) mixed-air dry-bulb temperature, 3) mixed-air relative humidity (or dew point), 4) surface temperature of the condenser, 5) surface temperature of the evaporator, and 6) compressor power consumption. Additional measurements enable refinement of the diagnostics provided by the minimum set of sensors. In addition, cooling/heating capacity and efficiency degradation can be computed and tracked with the additional measurements. Although having pressure measurements makes diagnosis of the faults more reliable, pressure sensors are expensive compared to temperature
and humidity sensors. Pressure sensors can be replaced with surface temperature sensors at the evaporator and condenser (Breuker and Braun 1998b), the measurements of which can be used as indicators of saturation temperature in the evaporator and condenser. Although the use of temperatures to estimate superheat and subcooling may lead to some error, their use will reduce the system cost and should still provide adequate diagnostics.
Although the monitoring system shown in Figure 1 can be used to detect both air-side and refrigerant-side faults, the prototype monitoring systems that are analyzed and discussed in the remainder of this paper only address “soft” faults associated with the air side. As indicated earlier, the costs of correcting such “soft” faults are minimal. Further analysis is required to determine the cost effectiveness of FDD and repair for hard faults.
Savings from Condition Monitoring
Although there are no reliable data on the number of package units in U.S. commercial buildings operating under degraded conditions and the energy waste associated with such operations, a range of savings from 10 to 30% is generally believed to be achievable by correcting operating problems of these units (based on anecdotal evidence). Assuming the range of savings is between 10% and 30%, the potential national energy savings range from 23 to 70 trillion Btus annually.
The cost for sensors, data acquisition, and of monitoring depends on the technology used and the deployment scenario, which will be presented in the next section. In this section, we describe a generic process for estimating the potential savings from use of wireless condition monitoring systems. The magnitude of savings achievable from improving the operation of an individual packaged unit depends on the size of the unit, its efficiency and the number of hours it operates. The annual load and energy use can be estimated using a full load equivalent operating hours (FLEOH) approach (Somasundaram et al. 2000). The FLEOH is effectively the number of hours that a system would have to run at full capacity to serve a total load equal to the actual annual load on the equipment and is given by the relation
Capacity Equipment Load Annual FLEOH= . (1)
The FLEOH is strictly defined in terms of the equipment capacity, not the peak load on the system; however, in order to enable analysis with the limited field data available, package units are assumed to be sized based on the design-day peak equipment load with no explicit over-sizing, i.e., Load Peak Day Design Capacity Equipment = , (2)
and the FLEOH for a piece of equipment is then approximated as the ratio of the annual load to the peak building load, i.e.,
Annual Load FLEOH .
Peak Building Load
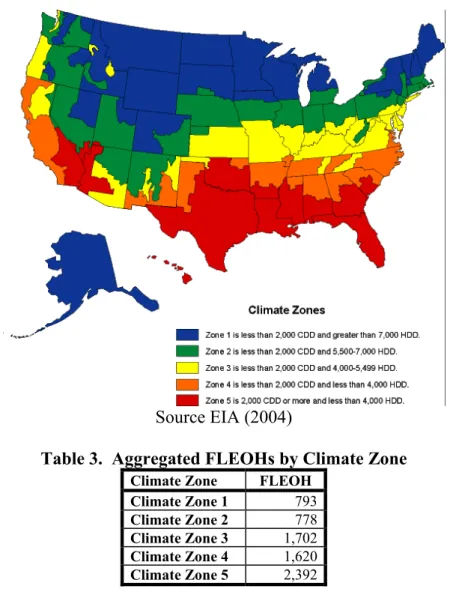
In general, this ratio will vary depending on building construction, building internal loads, building schedules, and orientation and exposure of the zone that the equipment serves. For any given building type, an average representative building can be assumed with constant internal-load characteristics and building schedules. This use of the FLEOH represents a simplified approach for estimating energy use. FLEOHs for six building types (viz., Assembly, Education, Food Service, Lodging, Office, and Retail) and five climate zones are listed in Table 1 and Table 2 for buildings with and without economizers, respectively. Figure 2 shows the five climate zones, which were adapted from the Commercial Building Energy Use Survey (CBECS) (EIA 2004).
Table 1. Building-Level FLEOHs (in hours per year) for Buildings with Economizers
Building Type/
Climate Zone Assembly Education Food Service Lodging Office Retail
Climate Zone 1 850 611 1,071 778 824 886
Climate Zone 2 831 613 1,030 773 794 844
Climate Zone 3 1,753 1,290 2,208 1,756 1,737 1,888
Climate Zone 4 1,647 1,203 2,077 1,581 1,661 1,850
Climate Zone 5 2,412 1,838 2,905 2,460 2,333 2,555
Source: Katipamula and Gaines (2003)
Table 2. Building-Level FLEOHs (in hours per year) for Buildings without Economizers
Building Type/
Climate Zone Assembly Education Food Service Lodging Office Retail
Climate Zone 1 1,006 765 1,468 1,121 1,206 1,318
Climate Zone 2 1,043 817 1,589 1,210 1,325 1,434
Climate Zone 3 1,920 1,433 2,614 2,104 2,115 2,354
Climate Zone 4 1,990 1,481 2,901 2,261 2,317 2,629
Climate Zone 5 2,590 2,013 3,350 2,867 2,782 3,110
Source: Katipamula and Gaines (2003)
Further simplifying, the FLEOHs for the different building types can be aggregated into a single FLEOH for each of the five climate zones. One indicator of the aggregate FLEOH for a climate zone is the weighted average FLEOH where the weights represent the fraction of total floor space represented by each building type for the climate zone from the CBECS survey (EIA 2004). The average FLOEHs obtained this way are shown in Table 3.
Energy use and energy savings per ton of capacity are then given by
Annual Load 1
Annual Energy Use per ton of Capacity x Equipment Capacity COP
= (5)
Figure 2. The US Climate Zones As Defined by EIA for the CBECS
Source EIA (2004)
Table 3. Aggregated FLEOHs by Climate Zone
Climate Zone FLEOH
Climate Zone 1 793
Climate Zone 2 778
Climate Zone 3 1,702
Climate Zone 4 1,620
Climate Zone 5 2,392
Annual Savings per ton Annual Energy Use per ton of capacity x Fractional Savings= (6) Annual Load Fractional Savings
x ,
Equipment Capacity COP
=
where COP = EER/3.412, EER (Btu/kWh) is the energy efficiency ratio, and the variable Fraction Savings is an estimate of the energy savings resulting from the changes made (e.g., use of the condition monitoring system).
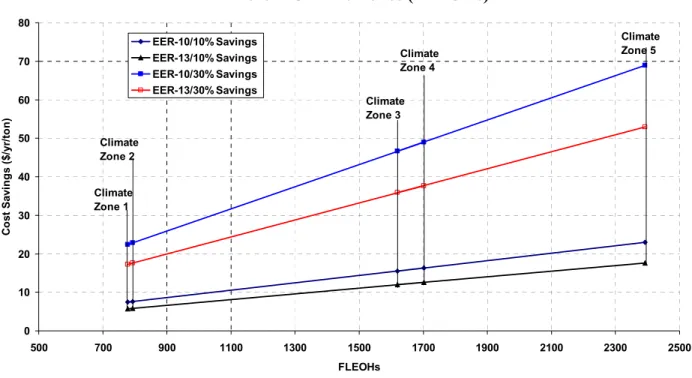
Annual savings per ton of cooling capacity corresponding to the solutions to Equations (4) through (6) as a function of FLEOH are shown in Figure 3 for two equipment efficiencies (EER of 10 and 13), for 10% and 30% potential savings and an electricity price of 0.08 $/kWh.
Figure 3. Annual Cost Savings per ton of Cooling on Energy Achievable at Different Climate Zones (FLEOHs)
0 10 20 30 40 50 60 70 80 500 700 900 1100 1300 1500 1700 1900 2100 2300 2500 FLEOHs C o st S av ings ( $/y r/ to n ) EER-10/10% Savings EER-13/10% Savings EER-10/30% Savings EER-13/30% Savings Climate Zone 1 Climate Zone 2 Climate Zone 3 Climate Zone 4 Climate Zone 5
Costs of Package-Unit Monitoring Systems
Continuous monitoring is rarely, if ever, used for package HVAC equipment, presumably because of cost and lack of reliable estimates of the savings achievable. In this section, we estimate the cost of implementing continuous monitoring systems, first for a wired installation and then when wireless data acquisition technology is used. For wired sensing and data acquisition, a number of generic solutions are currently available commercially. These systems (solutions) have been implemented for many different applications, e.g., monitoring in water and sewage treatment, industrial processes, meteorology, and manufacturing. Differences exist in the type of networking used, the transmission power of devices, supported network topologies and, as a result, the cost. For evaluation purposes, we have selected a wired data acquisition system using widely available RS-485 serial communication, which supports longer wiring distances than RS-232 and is widely available at reasonably low cost compared to other systems (Kintner-Meyer et al. 2002).
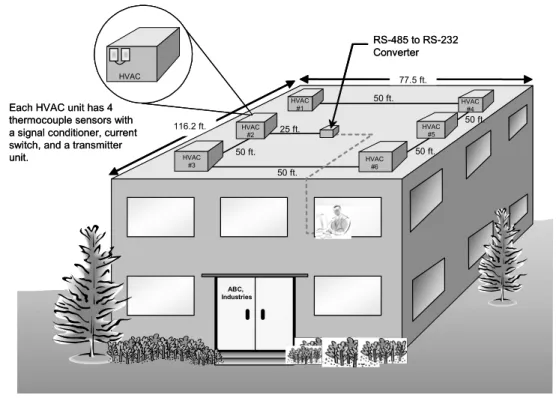
Because costs of wired systems depend on the length of wiring runs, which are determined by the number of units monitored as well as the distances between units, we have selected a representative configuration of units for a specific small commercial building as shown in Figure 4. The building is an 18,000 square foot, 2 story building with a 9,000 square foot footprint (and roof area). It is served by 6 package HVAC units located as shown on the roof. An RS-485 to RS-232 converter is centrally located. From this point an RS-232 serial cable runs to a personal computer in the building where data can be processed using automated diagnostic tools to produce information of use to building staff in operating and maintaining the rooftop equipment.
Figure 4. Schematic Depiction of HVAC and Monitoring Equipment Layout. 116.2 ft. 77.5 ft. HVAC #6 HVAC #5 HVAC #4 HVAC #3 HVAC #1 HVAC #2 50 ft. 50 ft. 50 ft. 50 ft. 50 ft. 25 ft. HVAC
Each HVAC unit has 4 thermocouple sensors with a signal conditioner, current switch, and a transmitter unit. ABC, Industries RS-485 to RS-232 Converter 116.2 ft. 77.5 ft. HVAC #6 HVAC #5 HVAC #4 HVAC #3 HVAC #1 HVAC #2 50 ft. 50 ft. 50 ft. 50 ft. 50 ft. 25 ft. HVAC HVAC
Each HVAC unit has 4 thermocouple sensors with a signal conditioner, current switch, and a transmitter unit.
ABC, Industries
RS-485 to RS-232 Converter
Itemized costs for the wired monitoring system are shown in Table 4. The system consists of data collection modules connected in a daisy-chain configuration using twisted-pair wiring. Four thermocouples monitor temperatures at each of the HVAC units, and a current switch detects the on/off status of the supply-air fan. Two signal conditioners are installed on each HVAC unit, one for the thermocouple signals and one for the fan status signal. Wiring is installed on the rooftop in ½-inch metal conduit. Costs for all components and labor for installation are shown in Table 4. The total estimated installed cost of the system is $5,786 or $193/sensed point.
In 2002, the costs of wired and wireless monitoring systems for package HVAC units were roughly comparable (see Kintner-Meyer, et al. 2002 and Kintner-Meyer and Brambley 2002). The costs of electronics have decreased over the last two years and the costs for wireless sensing have decreased even more rapidly than the costs of the components for wired data acquisition systems. By carefully matching capabilities and performance to the specific requirements for HVAC monitoring and packaging components (e.g., signal conditioning and radio transmitter together), the cost of wireless monitoring has been reduced even further (see prototype unit in Figure 5). The component and total costs of a wireless system replacing the wired system in Figure 4 are given in Table 5. At $78 per sensor point, costs for the wireless system are just over 1/3 of the cost of the wired system (at $193 per point). For this retrofit application, wireless monitoring clearly possesses a cost advantage over installation of a wired system, and the cost may be sufficiently low to encourage careful monitoring of package units, which has not been done widely to date.
Table 4. Costs for a Wired System for Monitoring Six HVAC Units
Description Quantit
y Cost Thermocouple sensors ($10 each) 24 $240
Current switches ($77 each) 6 $462 RS-485 to RS-232 converter 1 $94 Thermocouple input signal conditioners (199.00 each) 6 $1194
Digital I/O modules (99.00 each) 6 $594 Twisted pair wire (12.5 cents/ft) 275 ft $34 Rigid metal conduit, ½” ($1.03/ft) 275 ft $283 Labor for installing sensors (2 hr per HVAC unit @
$60/hr) 12 hr $720
Labor for wire and conduit (275 ft) $7.00/ft $1925 Labor for wiring from receiver to computer ($60/hr) 4 hr $240
Total Cost $5,78
6 Average cost per sensor point $193
Table 5. Costs for a Low-Cost Wireless System for Monitoring HVAC Units
Description Qty Cost
Transmitters (including sensors, signal processing, and
radio transmitter; $187 each) 6 $1122
Receiver ($195 each) 1 $195
Labor for installing transmitters, sensors, and receiver (2
hr per HVAC unit + 1 hr for receiver; $60/hr) 13 hr $780 Labor for wiring from receiver to computer ($60/hr) 4 hr $240
Total Cost $2337
Average cost per sensor point $78
The cost of the wired system was estimated from the cost of various commercially-available individual components, while the wireless monitoring system was commercially-available as an integrated unit. The cost of hardware excluding labor and cost of wire for the wired system is approximately $2,600 and for the wireless-system hardware it is about $1,300. If an integrated wired data collection unit like the wireless one were made, the cost of hardware for the wired system would presumably be comparable to the wireless system ($1,300) and the cost per point for the wired system would drop to $147. Although lower than the cost for the wired system built from off-the-shelf components, because of the cost of wiring and its installation, the wired system would still cost nearly twice as much as the wireless system.
The preceding analysis provides costs for a specific example with six 7.5-ton HVAC units. Because monitoring equipment must be installed on each HVAC unit, total costs of monitoring systems increase as the number of HVAC units increases. In contrast, as the number of HVAC units increases, the cost per ton of HVAC capacity decreases (see Figure 6). For a given HVAC unit size, as the number of HVAC units increases, the impact of the fixed costs for the central receiver and its installation decrease and the cost per ton decreases rapidly for the first few units, then asymptotically approaches a constant value corresponding to the cost per ton for the equipment installed on the HVAC units themselves (i.e., for sensors and the transmitter/signal conditioning package). Furthermore, as the size of the HVAC unit increases, the cost to monitor a unit remains constant (because the equipment required does not change) and the cost per ton of capacity and per unit of energy saved decreases. Therefore, the economics of monitoring using a wireless system improve as the number and size of the units increase.
Cost Effectiveness of Wireless Monitoring
The cost of the HVAC condition monitoring system is shown along with savings on energy expenditures over 3 years in Figure 7 as a function of total cooling capacity. More severe cooling climates correspond to larger cooling capacity. Points of equality of 3-year savings and
Figure 6. Wireless Monitoring System Costs for Three HVAC Unit Sizes $0 $20 $40 $60 $80 $100 $120 $140 $160 $180 0 2 4 6 8 10 12
Number of HVAC Units
S ys te m C o st pe r To n C apa ci ty ( $/t on) 5-Ton Units 7.5-Ton Units 15-Ton Units
Figure 7. Monitoring System Costs and Savings on Energy Expenditures over 3 Years for Estimated Energy Savings of 15% for the 18,000 Square Foot, 2-Story Building.
$0 $1,000 $2,000 $3,000 $4,000 $5,000 $6,000 $7,000 30 35 40 45 50 55 60 65
Cooling Capacity (tons)
M o nit o ri ng C o st /S av ings Climate Zone 1 Climate Zone 3 Climate Zone 5 5-Ton Units 7.5-Ton Units 15-Ton Units Savings
system costs correspond to a 3-year simple payback period. All points on the cost curves that fall below the savings line have payback periods less than 3 years.
Figure 7 shows that wireless monitoring is cost-effective (when measured by a 3-year payback period) for 15-ton units down to a total cooling capacity just a little over 35 tons. Likewise, wireless monitoring is cost effective down to cooling capacities of about 42 tons and 48 tons for 7.5-ton units and 5-ton units, respectively. Longer acceptable payback periods and full life-cycle cost analysis show much larger ranges of acceptable cost effectiveness.
Conclusions
The analysis completed as the basis for this work, a sample of which is presented in the paper itself, supports two key conclusions:
1. Today, retrofit of already-installed package rooftop HVAC units can be done more cost effectively with wireless technology than with generic wired data acquisition equipment. 2. For all but the mildest climates, the savings possible from using a low-cost wireless
monitoring system and correcting the “soft-faults” in response to the information it provides far exceed the cost of the monitoring hardware. Typically, payback periods are 3 years or less for the monitoring system.
A few caveats are in order to qualify the results reported in this paper.
1. Savings of 15% can justify the cost of a wireless monitoring system costing about $78 per sensor point. The savings possible on average from correcting soft faults with package units cannot be quantified well today because the data necessary to adequately characterize the condition of HVAC units in the building stock are just not available. Anecdotes from researchers in the field tend to support the claim that savings are likely between 10% and 30%.
2. The wireless system evaluated is the lowest-cost system of which the authors are aware. It was built specifically for the research partially reported in this paper. Other systems are likely to be more expensive and should be priced carefully before their purchase and installation by building staff. Although the cost of this prototype wireless monitoring system is low, the manufacturer of the system indicated that the system cost would be significantly lower when mass produced.
3. A two-story building of 18,000 sf was used in the analysis to estimate the cost of monitoring and the resulting savings gained by correcting the faults that were identified. However, it should be noted that smaller buildings will be economically less favorable, while larger buildings (>18,000 sf) will be more favorable.
4. The prototype wireless monitoring system assessed in this paper was only designed to monitor air-side conditions and not refrigerant-side conditions of package HVAC units. In addition, the air-side faults assumed to be repaired were “soft,” permitting repair at little or no cost. Repair of “hard” faults would have higher costs and vary significantly with the specific fault and repair required, thus requiring further analysis to determine the cost effectiveness of repair.
Looking toward the future, the authors are exploring ways of adapting lower-cost, rapidly evolving wireless sensor networking technology to provide even lower-cost wireless monitoring and control systems. These systems should help increase market appeal (especially for those buildings less than 10,000 sf) and bring significant savings to the owners, managers, and occupants of small commercial buildings across the country.
Acknowledgements
The authors would like to acknowledge the Office of Building Technology Programs of the U.S. Department of Energy Office of Energy Efficiency and Renewable Energy for supporting the Buildings Systems Program from which this work is derived. The authors also wish to thank Air-Sentry Inc. for modifying their residential monitoring system design and building prototypes of the resulting low-cost commercial package unit monitoring systems for testing by Pacific Northwest National Laboratory.
References
Ardehali, M.M. and T.F. Smith. 2002. Literature Review to Identify Existing Case Studies of Controls-Related Energy-Inefficiencies in Buildings. Technical Report: ME-TFS-01-007. Department of Mechanical and Industrial Engineering, The University of Iowa, Iowa City, Iowa.
Ardehali, M.M., T.F. Smith, J.M. House, and C.J. Klaassen. 2003. “Building Energy Use and Control Problems: An Assessment of Case Studies.” Accepted for ASHRAE Transactions, Vol. 109, Pt. 2, 2003.
Breuker, M.S., and J.E. Braun. 1998a. Common faults and their impacts for rooftop air conditioners. International Journal of Heating, Ventilating, Air Conditioning and Refrigerating Research 4(3): 303-318.
Breuker, M. S. and J.E. Braun. 1998b. Evaluating the Performance of a Fault Detection and Diagnostic System for Vapor Compression Equipment. HVAC&R Research, 4(4):401-425.
Energy Information Administration (EIA). 2004. US Climate Zones website:
http://www.eia.doe.gov/emeu/cbecs/climate_zones.html
Energy Information Administration (EIA). 2002. 1999 Commercial Building Energy Consumption and Expenditures (CBECS), EIA website:
http://www.eia.doe.gov/emeu/cbecs/detailed_tables_1999.html
Katipamula, S., M.R. Brambley, N.N. Bauman, and R.G. Pratt. 2003. "Enhancing Building Operations through Automated Diagnostics: Field Test Results." In Proceedings of 2003 International Conference for Enhanced Building Operations.
Katipamula S., M.R. Brambley, and L. Luskay. 2003. "Automated Proactive Techniques for Commissioning Air-Handling Units." Journal of Solar Energy Engineering--Transactions of the ASME 125(3):282-291.
Katipamula, S., and M.R. Brambley. 2004. Fault Detection, Diagnostics and Prognostics for Building Systems – A Review. HVAC&R Research, 10(x):xxx-xxx.
Katipamula S, Gaines S. 2003. Characterization of Building Controls and Energy Efficiency Options Using Commercial Building Energy Consumption Survey. PNWD-3247, Pacific Northwest National Laboratory, Richland, WA.
Kintner-Meyer M., M. R. Brambley, T. A. Carlon, and N. N. Bauman. 2002. "Wireless Sensors: Technology and Cost-Savings for Commercial Buildings." In Teaming for Efficiency: Proceedings, 2002 ACEEE Summer Study on Energy Efficiency in Buildings: Aug. 18-23, 2002, Vol.7; Information and Electronic Technologies; Promises and Pitfalls., pp. 7.121-7.134. American Council for Energy Efficient Economy , Washington, D.C.
Kintner-Meyer M, and MR Brambley. 2002. "Pros & Cons of Wireless." ASHRAE Journal
44(11):54-61.
Lunneberg, T. 1999. “When Good Economizers Go Bad.” E Source Report ER-99-14, E Source, Boulder, Colorado.
Portland Energy Conservation Inc. (PECI). 1997. Commissioning for Better Buildings in Oregon. Oregon Office of Energy, Salem, Oregon.
Rossi, T.M. and Braun, J.E. 1997. “A Statistical, Rule-Based Fault Detection and Diagnostic Method for Vapor Compression Air Conditioners.” HVAC&R Research, 3(1):19-37. Somasundaram, S., P.R. Armstrong, D.B. Belzer, S.C. Gaines, D.L. Hadley, S. Katipamula, D.L.
Smith, and D.W. Winiarski. 2000. “Screening Analysis for EPACT-Covered Commercial HVAC and Water-Heating Equipment.” PNNL-13232, Pacific Northwest National Laboratory, Richland, Washington.
Stouppe, D.E., and Y.S., Lau. 1989. Air Conditioning and Refrigeration Equipment Failures. National Engineer 93(9): 14-17.