Cellular Best Practices
Guide
Contents
About Creating Efficient Cellular Apps
4Cellular Processors: Interface to the Cellular Network
5 Cellular Data Is Expensive 5A Device Has an Application Processor and a Cellular Processor 6 How the Cellular Processor Communicates 7
Best Practices for Developing Cellular Apps
8 Bundle Data Requests to Limit Background Activity 8Background “Pings” 9 Ad Frameworks 10
Bundle Connections to Reduce Control Plane Traffic 10 Saving App Data to the Cloud in Real Time 12 Conserve Battery When There Is No User Input 12 Respect User Data Plans 13
Switching Video Playback from Wi-Fi to Cellular 14 Manage Data Download Patterns 15
Manage Data Generation, the Cache, and Data Requests 19
Instruments Analysis Tool
20Main Features of Instruments 20 Quick Tour of Instruments Views 21
Interfaces View 22 Connections View 23 Processes View 24 Combined View 25
Combining with Other Instruments Views 26 Identifying Outliers 26
Understanding the Instruments Log File 28 Understanding Testing 29
Figures
Cellular Processors: Interface to the Cellular Network
5 Figure 2-1 Power and data states of a cellular device’s processors 6Best Practices for Developing Cellular Apps
8Figure 3-1 A view of background “pings” that need to be eliminated 9 Figure 3-2 A view of unbundled ads, resulting in high overhead 10 Figure 3-3 A view of excessive, low-volume, foreground traffic 11
Figure 3-4 A view of an app saving data to the cloud in real time making numerous new connections 12 Figure 3-5 A game overriding the automatic dimming of the screen with disappointing results 13 Figure 3-6 A VoIP app using your data plan to transport other users’ data 14
Figure 3-7 Video playback downloading on Wi-Fi and unknowingly moving to cellular 15 Figure 3-8 An app's oscillating download pattern showing no new connections 16
Figure 3-9 The communication overhead resulting from state transitions within a single connection 17 Figure 3-10 The data download rate affecting the power state, creating oscillation 18
Instruments Analysis Tool
20Figure A-1 The Instruments user interface: Displaying a wide range of information in a compact space 21
Figure A-2 The Connections tool's Interfaces view visibly identifying traffic going to each interface 22 Figure A-3 The Connections tool's Connections view showing all the TCP and UDP connections initiated
on each interface 23
Figure A-4 The Connections tool's Processes view showing the data traffic initiated by each process of the app 24
Figure A-5 The Instruments combined view showing time-aligned details 25
Figure A-6 Instruments displaying a combined view with several different individual instruments 26 Figure A-7 The Additional Details button, for generating an interface inactivity histogram 27 Figure A-8 An interface inactivity histogram to help identify anomalous behavior 27
Figure A-9 Two ways to save Instruments logs: on your device or on your workstation 28
2014-04-09 | Copyright © 2014 Apple Inc. All Rights Reserved.
Applications (apps) designed for Ethernet and Wi-Fi have natural limitations imposed by the architecture of cellular networks. Two of the most significant limitations are bandwidth usage and battery usage. High bandwidth usage and unnecessary connections can cost the user in data plan charges. High data-transfer rates and other factors can consume battery life. Poor app design can consume extraordinary amounts of both. It is in the interests of developers, carriers, and hardware manufacturers to avoid these kinds of problems. While Apple has its developer support programs, carriers like AT&T and Sprint also have frameworks to analyze apps and have programs to educate and encourage developers in creating efficient and well-behaved apps that are safe for networks—which Apple developers may want to explore.
This document is intended for developers of apps on Apple devices that use cellular networks for data transfer (iPhones and iPads). It presumes that you are already familiar with the basics of Ethernet and Wi-Fi data transfer. It uses the Xcode Instruments tool to display data about apps’ behavior, so some familiarity with Xcode and Instruments may be helpful. The advice here may also be useful to developers of apps on other platforms, but it is not intended to discuss those environments.
Note: If you are not familiar with the Instruments analysis tool, see the appendix,Instruments Analysis Tool (page 20), for an introduction.
Wi-Fi and Ethernet technologies are similar, and apps can run on either interchangeably. This is not true for cellular networks, where data transfer has different requirements. Whereas Wi-Fi connectivity is relatively inexpensive, the cost per byte of the same data transmitted over a cellular connection can be quite costly—for the carrier as well as the user. Cellular networks are quite complex in how they acquire and use radio
(airwave/spectrum) resources. That complexity is expensive for the carrier and they pass those expenses on to the user.
Cellular Data Is Expensive
On most mobile devices, apps can use multiple forms of connectivity, each carrying different expenses. Yet the transition from one to the other is often outside of the users’ awareness. In addition, to manage cellular connections, the device itself usually has multiple cellular data modes with different data rates and different power usage, also invisible to the user.
When a mobile device user out of Wi-Fi range opens an Internet app, it typically takes the exchange of eight to ten cellular network messages (depending on the protocol) before a single byte of data is transmitted. This is far more overhead than in a typical Ethernet/Wi-Fi LAN exchange and it is the principal reason that apps designed for Ethernet and Wi-Fi are often not as efficient when used over a cellular interface.
2014-04-09 | Copyright © 2014 Apple Inc. All Rights Reserved.
5
Important: You cannot assume that apps that work efficiently on Ethernet and Wi-Fi will perform similarly when used over a cellular interface.
A Device Has an Application Processor and a Cellular Processor
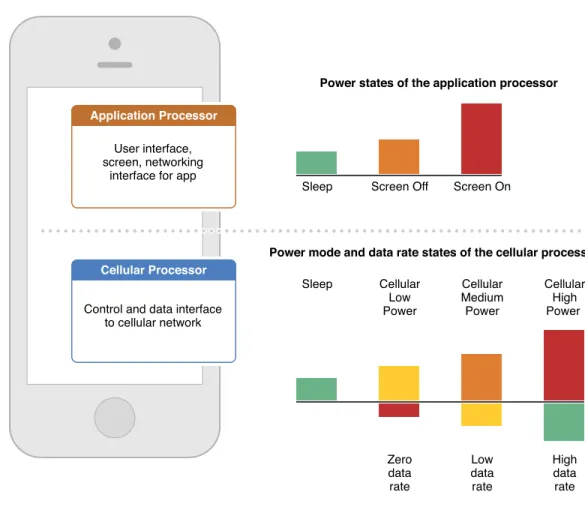
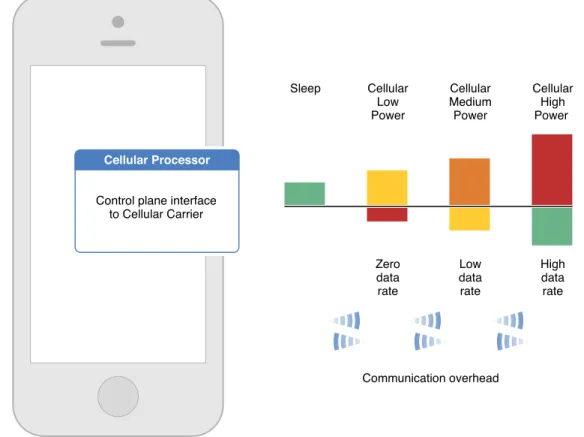
Typically, a device has both an application processor and a cellular processor, which each operate in different power states and data states, as shown in Figure 2-1.
Figure 2-1 Power and data states of a cellular device’s processors
The cellular processor typically has three different “on” states, as shown here; some protocols have four. The states are defined by the power consumed and the data rates. There may be a “zero state” for an established but idle connection with no data being transmitted. Processors use higher power states to send larger amounts of data. The choice of state and the decision to change state is automatically negotiated with the cellular network.
Cellular Processors: Interface to the Cellular Network
How the Cellular Processor Communicates
The cellular processor communicates with the cellular network in two different planes: thecontrol plane, which manages the communication protocol, and thedata plane, which carries the actual data packets.
To provide good user performance, cellular network providers attempt to deploy a network that will never have its capacity exceeded while keeping costs reasonable. Yet they can be vulnerable to the behavior of apps over which they have no control. Many apps are designed with features that, intentionally or not, push the boundaries of the networks. As a result, carriers often need to restrict app behavior to keep them within the limitations of the networks. For example, a carrier could limit the number of connections that an app triggers, especially in the control plane.
Apps may also be restricted by the device manufacturers. For example, devices can restrict an app’s use of memory, processing, or battery resources.
Cellular Processors: Interface to the Cellular Network
How the Cellular Processor Communicates
2014-04-09 | Copyright © 2014 Apple Inc. All Rights Reserved.
Apple engineers analyzed the performance of many third-party apps, included streaming, gaming, messaging, and productivity apps. The analysis used more than 50 metrics, including:
● Control plane overhead
● Data consumption on the cellular interface ● Wi-Fi/cellular interface behavior
● Power consumption specific to cellular usage ● Background and active modes
The analysis, including experience with Apple’s own apps, resulted in several “best practices” for application development.
Note: The real-world data behind the following best practices is displayed using the Instruments analysis tool. If you are not familiar with Instruments, see the appendix,Instruments Analysis Tool (page 20).
Bundle Data Requests to Limit Background Activity
Limit app background activity either by bundling your requests or by making requests when another app has already initiated a connection (if that can be determined).
Background activity is not based on interactions with the user but rather on some other desired pattern of communication. Here are two examples.
Background “Pings”
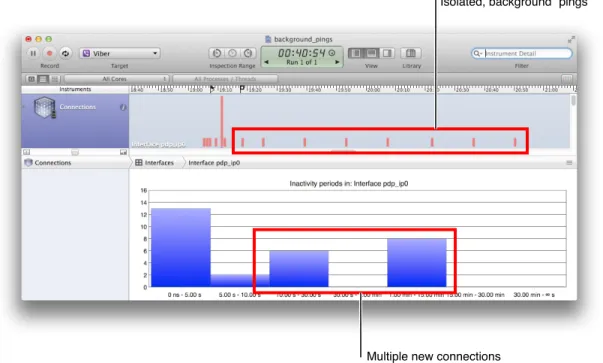
The example in Figure 3-1 shows excessive, low-volume, background traffic because of a recurrent keepalive signal that runs even when the app is in the background, repeatedly initiating a new connection to transmit a very small amount of data. Although this kind of pinging is typically not a problem in Ethernet and Wi-Fi apps, repeated, independent connections, even with small amounts of data, can create large amounts of overhead with cellular connections.
Figure 3-1 A view of background “pings” that need to be eliminated
In this case, the background pings should be eliminated or bundled with other connections.
Best Practices for Developing Cellular Apps
Bundle Data Requests to Limit Background Activity
2014-04-09 | Copyright © 2014 Apple Inc. All Rights Reserved.
Ad Frameworks
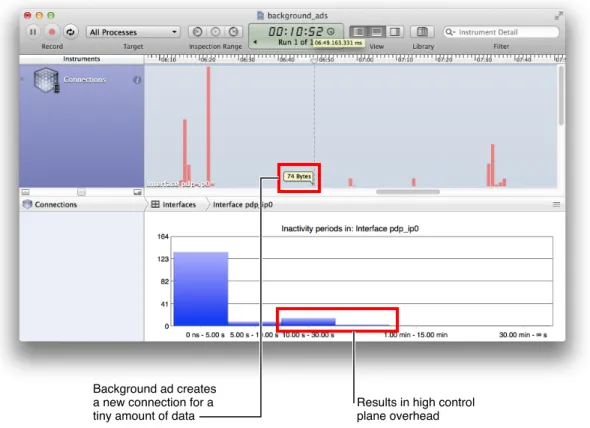
Figure 3-2 shows a problem with the advertising framework the app is using. In the background, separate from the app’s activity, the framework is downloading ads at irregular intervals. Although each download has very little data, each one requires new control plane connections.
Figure 3-2 A view of unbundled ads, resulting in high overhead
The ad delivery mechanism needs to be redesigned to avoid the overhead that comes from downloading the ads one at a time.
Bundle Connections to Reduce Control Plane Traffic
Both of the examples in the previous section take place in the background, when the user is not actively using the app. Even when the user is actively interacting with an app, it may attempt to communicate with separate, small chunks of data which can produce large overhead.
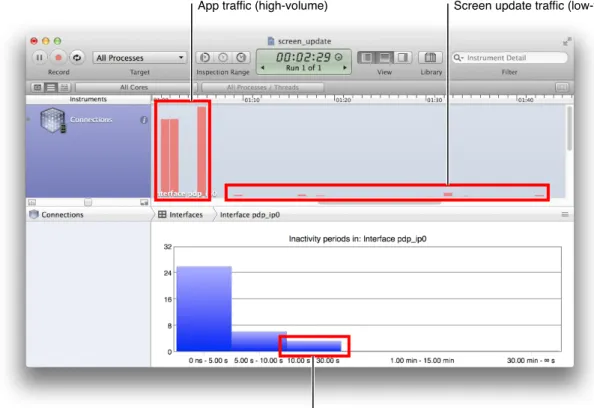
Figure 3-3 shows an app in active mode, where intermittent connections with very small amounts of data are creating high cellular control plane overhead. In this case, the app has been designed to show text on the user’s screen and when the user scrolls down, new text is requested. As the user scrolls down a few lines at a time, new data is downloaded in small chunks, with a new connection for each chunk.
Best Practices for Developing Cellular Apps
Reorganizing the download process can make more efficient use of the connection overhead.
Figure 3-3 A view of excessive, low-volume, foreground traffic
Best Practices for Developing Cellular Apps
Bundle Connections to Reduce Control Plane Traffic
2014-04-09 | Copyright © 2014 Apple Inc. All Rights Reserved.
Saving App Data to the Cloud in Real Time
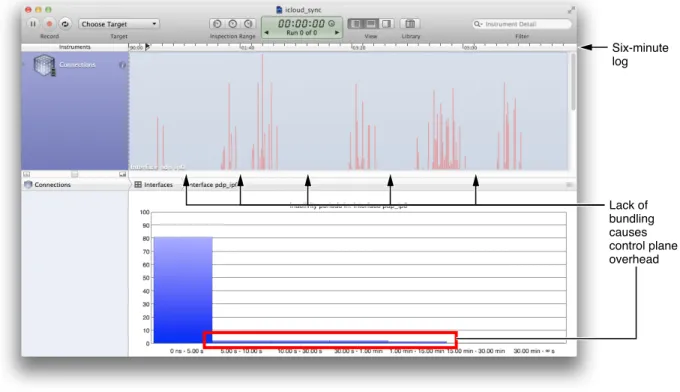
Figure 3-4 shows a six-minute log of an app that is saving data to the cloud in real time. This example shows an app that is in active use. The user is repeatedly touching the screen and typing to select and edit the original input while composing text. Each time the user touches or types, the data is saved to the cloud, as if the user is not using an app on the device but is interacting with the cloud directly.
Figure 3-4 A view of an app saving data to the cloud in real time making numerous new connections
Without any specific bundling of the data, every user interaction generates more cellular control plane overhead and additional data transfer. The lack of bundling thus impacts both the network overhead and the device's data plan.
Conserve Battery When There Is No User Input
Use power resources efficiently by monitoring user inputs to determine when an Auto-Lock override should be turned off.
Best Practices for Developing Cellular Apps
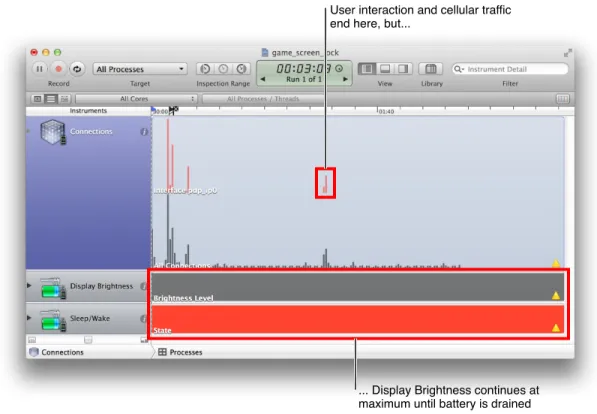
The Auto-Lock feature on an iPhone sets the time that elapses before the iPhone automatically locks or turns off the display, if there is no user input. Typically, games attempt to override a device’s Auto-Lock functionality to provide what the game designers consider to be a better user experience. For example, a game may prevent the screen from going dark while the user is not taking any action. Generally, this is what the user wants—until the user sets the game down, walks away for half an hour, and returns to find a drained battery.
Figure 3-5 shows an example of a game that overrides the screen Auto-Lock functionality and keeps the screen on until the battery drains completely. A balance needs to be found between annoying the user unnecessarily and keeping the screen on without any checks for activity.
Figure 3-5 A game overriding the automatic dimming of the screen with disappointing results
Fortunately, this situation is easy to identify using the display brightness and sleep/wake instruments.
Respect User Data Plans
Honor device/user data plans with indications to user, especially when Wi-Fi is not available. Apps should not download or upload data for any purpose other than that needed for normal usage.
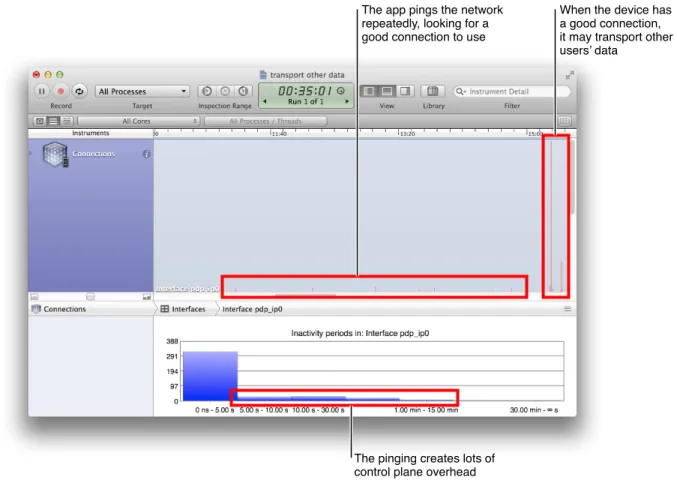
Figure 3-6 shows a very popular VoIP app that uses an ad hoc transport model, taking advantage of whatever connections are available. When it is open on a cellular device in background mode, the app’s flexible data transport model uses the cellular device as a router for other users’ data. Thus it is sending data that was never
Best Practices for Developing Cellular Apps
Respect User Data Plans
2014-04-09 | Copyright © 2014 Apple Inc. All Rights Reserved.
originated (intentionally or otherwise) by the user of the device and is eating into this user’s data plan. Worse, it initiates many new connections to do so, further increasing the overhead that consumes the user’s data allowance.
Figure 3-6 A VoIP app using your data plan to transport other users’ data
Estimate of the number of connections that your app needs to function properly. When you see more connections than you expect, investigate to determine what is initiating those connections.
Switching Video Playback from Wi-Fi to Cellular
A video playback app can be a huge consumer of bandwidth if it makes no distinction between Wi-Fi and cellular connections.
Best Practices for Developing Cellular Apps
In this example (Figure 3-7), a user began a video download while on a Wi-Fi connection. At some point, the device lost the Wi-Fi connection and transparently transitioned to a cellular connection, perhaps while the user walked from a building to a parking lot. The app gave the user no input and no choice of whether to continue the download under the new, potentially expensive, data channel.
Figure 3-7 Video playback downloading on Wi-Fi and unknowingly moving to cellular
Manage Data Download Patterns
Download data in as big a burst as possible for every connection, especially when using a cellular network.
Best Practices for Developing Cellular Apps
Manage Data Download Patterns
2014-04-09 | Copyright © 2014 Apple Inc. All Rights Reserved.
The app in Figure 3-8 has all of its connections at the left side of the histogram. Because the app is creating few new connections, it might appear there is no problem with its download process. However, there is a repeating pattern in the download data: Large data spikes are alternating with periods of no data, approximately every ten seconds. Yet the app is not making new connections for these spikes.
Figure 3-8 An app's oscillating download pattern showing no new connections
Best Practices for Developing Cellular Apps
This oscillating pattern is a more subtle overhead issue than simply creating new connections. Cellular traffic operates at different power and data levels within a single continuous connection. The choice of data rates is managed by the cellular network in negotiation with the mobile device. Even within a single connection, managing the transitions between low, medium, and high data rates requires communication overhead, as illustrated in Figure 3-9.
Figure 3-9 The communication overhead resulting from state transitions within a single connection
Best Practices for Developing Cellular Apps
Manage Data Download Patterns
2014-04-09 | Copyright © 2014 Apple Inc. All Rights Reserved.
In Figure 3-10, an Apple internal analysis tool shows the actual Wideband Code Division Multiple Access (WCDMA) power and data states used by the device. They are oscillating along with the data bursts with short periods of high power and high data transfer between longer periods of medium power and little data. Although new connections are not being created, there is heavy communication overhead and wasted power with no data being transferred.
Figure 3-10 The data download rate affecting the power state, creating oscillation
In this app, an estimation of the data download rate determines the playback rate. Because a medium data rate predominates, the app specifies a lower playback quality, even though a higher playback quality could be easily supported.
This app determines how much to download based on the lower data rate. But because the block of data is sufficiently large to automatically put the device into high-power mode, the requested data packet completes quickly. This behavior leaves the processor and channel idle until the next packet comes due, scheduled according to the lower data rate.
The cellular processor runs at high or medium power over half of the time when no data is being transferred, thereby wasting resources and degrading the user experience.
Best Practices for Developing Cellular Apps
Although the WCDMA state is not directly observable in Instruments, knowing about its state transition overhead may help you diagnose oscillating download problems like this and may help you to design apps that avoid this issue. If this app had a built-in understanding of the network’s power and data-rate transition criteria, it could transfer larger blocks of data at high power and deliberately go into low power between the blocks, conserving battery life while providing higher playback quality.
Manage Data Generation, the Cache, and Data Requests
As an app developer, you need to be conscious of how data is being uploaded and downloaded by your app to avoid wasting network resources.
Encoding and compression.Be aware of how much data is actually transmitted over the cellular interface per byte generated by the app. A single byte of data can have as much as 1500 bytes of overhead.
Cache utilization.Use the cache efficiently to avoid unnecessary downloading of same data over and over again.
Data request patterns.Look for patterns in how data is requested. Perhaps all the images of a webpage can be downloaded in one connection instead of making multiple connections.
Each of these aspects of data usage impacts the network through changes in the device’s state and through the generation of control plane traffic.
Best Practices for Developing Cellular Apps
Manage Data Generation, the Cache, and Data Requests
2014-04-09 | Copyright © 2014 Apple Inc. All Rights Reserved.
This appendix provides a brief introduction to the Instruments analysis tool to help you understand the data displays used in the best practices described inBest Practices for Developing Cellular Apps (page 8).
Main Features of Instruments
Instruments is one of the Xcode developer tools, available through the Open Developer Tools menu. This appendix describes how you can use the Instruments analysis tool to monitor problem areas by checking an app’s efficiency both on the network and on the device.
Although Instruments should be familiar to most iPhone developers, it’s worth reviewing some of the features that are important to testing cellular apps. The Instruments analysis tool:
● Is easy to use
● Allows you to identify issues and outliers quickly, without having to learn a lot of details about the
underlying data-pipe mechanisms
● Identifies the device-side impact as well as the impact on the network ● Measures a few seconds’ worth of data or logs over multiple days
● Provides appropriate granularity in whatever timescale is being measured ● Has little to no impact on the device and app behavior while the tool is in use
The Instruments analysis tool includes a suite of individual instruments that you can use to identify unusual patterns of network activity. The Connections tool and the App Profiling tool are particularly useful in recognizing the types of network problems that inefficient apps can cause.
An overview of the Instruments user interface is available inTouring InstrumentsinInstruments User Guide.
Instruments Analysis Tool
This document specifically refers to the Track Pane in the upper half of the view, the Navigation Bar in the middle, and the Detail Pane in the lower half of the view, as shown in Figure A-1.
Figure A-1 The Instruments user interface: Displaying a wide range of information in a compact space
This document is not intended to be a tutorial in using the Instruments tool. This description is meant to familiarize you with Instruments enough to understand the example displays inBest Practices for Developing Cellular Apps (page 8).
Quick Tour of Instruments Views
The Connections instrument shows many activities that should be familiar to developers. It has three views: Interfaces, Connections, and Processes.
Instruments Analysis Tool
Quick Tour of Instruments Views
2014-04-09 | Copyright © 2014 Apple Inc. All Rights Reserved.
Interfaces View
The Connections tool’s Interfaces view (Figure A-2) monitors traffic on cellular and Wi-Fi interfaces.
Figure A-2 The Connections tool's Interfaces view visibly identifying traffic going to each interface
The Interfaces Detail pane shows metrics and other details for each interface. Each interface that you select will be graphed in the Track pane, showing data volume over time.
Instruments Analysis Tool
Connections View
The Connections tool’s Connections view (Figure A-3) monitors all TCP and UDP connections as the app triggers them.
Figure A-3 The Connections tool's Connections view showing all the TCP and UDP connections initiated on each interface
The Connections Detail pane shows metrics and other details for each connection and the selected connections are graphed in the Track pane, showing data volume over time.
Instruments Analysis Tool
Quick Tour of Instruments Views
2014-04-09 | Copyright © 2014 Apple Inc. All Rights Reserved.
Processes View
The Connections tool’s Processes view (Figure A-4) monitors data traffic connections for each process that the app is running.
Figure A-4 The Connections tool's Processes view showing the data traffic initiated by each process of the app
The Processes view shows the traffic for each process created or used by the app. Select which processes are graphed using the checkboxes in the Detail pane. All traffic related to other processes is shown in the bottom line of the Detail pane, identified as*Other*. To protect the user’s privacy, you can only individually monitor apps that you have developed.
Instruments Analysis Tool
Combined View
The Connections tool supports creating combined views that allow you to have interfaces, connections, and processes graphed in time-aligned combination (Figure A-5).
Figure A-5 The Instruments combined view showing time-aligned details
Use the Combined view to identify which process was active, what interface the traffic used, and what connections the activity generated. All checked items from all three Detail lists will be graphed in the Track pane.
Instruments Analysis Tool
Quick Tour of Instruments Views
2014-04-09 | Copyright © 2014 Apple Inc. All Rights Reserved.
Combining with Other Instruments Views
The Connections instrument is only one of the individual instruments available in the Instruments tool. You can combine a Connections view with other instruments. For example, Figure A-6 shows a time-aligned view of the Connections, Network Activity, Energy Usage, Display Brightness, and CPU Activity instruments.
Figure A-6 Instruments displaying a combined view with several different individual instruments
A combined view allows you to compare multiple factors in a time-aligned view to help identify problems.
Identifying Outliers
The Instruments tool can help identifyoutliers, those instances that are outside the overall normal range of an app’s operation. These outliers can have the greatest impact on the cellular data network.
Instruments Analysis Tool
To find outliers, open the Connection tool’s Interfaces view and locate the Additional Details button ( ) for the interface (Figure A-7). The button appears when you select a specific interface or when you hover your cursor over an interface entry. Click that button to generate a histogram of the app’s connections inactivity.
Figure A-7 The Additional Details button, for generating an interface inactivity histogram
Many Instruments tools have a button like this that provides additional details, depending on the tool. For Interfaces, it generates a histogram showing the inactive time between every two consecutive packets (Figure A-8).
Figure A-8 An interface inactivity histogram to help identify anomalous behavior
This interface inactivity histogram is used in many of the following best practices.
Instruments Analysis Tool
Identifying Outliers
2014-04-09 | Copyright © 2014 Apple Inc. All Rights Reserved.
In general, best practice is to avoid connection idle time values that fall in the middle area (10 seconds to 15 minutes between connections). Instead, operate your app either in continuous connection (the left end) or where the timing is not critical (the right end). If your app requires frequent new connections to the cellular physical layer infrastructure (the middle area), this behavior can both degrade performance and increase user and carrier costs.
Understanding the Instruments Log File
Complete instructions on creating an Instruments log file (also called atrace file) are beyond the scope of this guide. Please see “Collecting Data on Your App” for more details.
To understand the examples inBest Practices for Developing Cellular Apps (page 8), it will be useful to know that Instruments has two methods for creating log files for analysis (Figure A-9):
● With your device tethered to your workstation, view the results in real time in Instruments. ● With your device untethered, save the log on your device, view the log file in Instruments later.
Figure A-9 Two ways to save Instruments logs: on your device or on your workstation
Seeing your device’s activities in real time can be useful for some situations, such as seeing the results of user actions. Being able to operate untethered allows you to test scenarios such a moving from a Wi-Fi area to an area with only cellular service.
Instruments Analysis Tool
Understanding Testing
Typical tests of any app include two modes: active tests and background tests.
To accurately evaluate an app’s performance, first run a testwithout the app to be profiled, to understand the traffic generated by the basic usage of the device. Then do a second run,with the app to be profiled, to understand the additional traffic generated by the app.
To run an active test, record the app while it is in foreground mode for anywhere from a few seconds up to 15 or 20 minutes.
For background tests, run the app in background mode; the screen can be either on or off. You can see the impact of the app on cellular performance by looking at the number of connections made (cellular control plane as well as TCP/UDP), the amount of data transferred, the data transfer patterns, and other metrics. Instruments can monitor these tests for however long you want to run them, from a few minutes to a couple of days. Use longer-duration tests to understand the keepalive patterns generated by apps. Some apps generate more connections when they are freshly set up (out of the box) than when they have been running for a few days.
Instruments Analysis Tool
Understanding Testing
2014-04-09 | Copyright © 2014 Apple Inc. All Rights Reserved.
This table describes the changes toCellular Best Practices Guide.
Notes Date
New document that provides best-practice guidelines for developers of iOS apps that use cellular networks for data transfer.
2014-04-09
Apple Inc.
Copyright © 2014 Apple Inc. All rights reserved.
No part of this publication may be reproduced, stored in a retrieval system, or transmitted, in any form or by any means, mechanical, electronic, photocopying, recording, or otherwise, without prior written permission of Apple Inc., with the following exceptions: Any person is hereby authorized to store documentation on a single computer or device for personal use only and to print copies of documentation for personal use provided that the documentation contains Apple’s copyright notice.
No licenses, express or implied, are granted with respect to any of the technology described in this document. Apple retains all intellectual property rights associated with the technology described in this document. This document is intended to assist application developers to develop applications only for Apple-branded products. Apple Inc.
1 Infinite Loop Cupertino, CA 95014 408-996-1010
Apple, the Apple logo, Instruments, iPad, iPhone, and Xcode are trademarks of Apple Inc., registered in the U.S. and other countries. IOS is a trademark or registered trademark of Cisco in the U.S. and other countries and is used under license.
Ping is a registered trademark of Karsten Manufacturing and is used in the U.S. under license.
APPLE MAKES NO WARRANTY OR REPRESENTATION, EITHER EXPRESS OR IMPLIED, WITH RESPECT TO THIS DOCUMENT, ITS QUALITY, ACCURACY,
MERCHANTABILITY, OR FITNESS FOR A PARTICULAR PURPOSE. AS A RESULT, THIS DOCUMENT IS PROVIDED “AS IS,” AND YOU, THE READER, ARE ASSUMING THE ENTIRE RISK AS TO ITS QUALITY AND ACCURACY. IN NO EVENT WILL APPLE BE LIABLE FOR DIRECT, INDIRECT, SPECIAL, INCIDENTAL, OR CONSEQUENTIAL DAMAGES RESULTING FROM ANY DEFECT, ERROR OR INACCURACY IN THIS DOCUMENT, even if advised of the possibility of such damages.
Some jurisdictions do not allow the exclusion of implied warranties or liability, so the above exclusion may not apply to you.